Introduction
Retinoblastoma is a malignant ocular tumor that
occurs during childhood. Over 95% of the tumors have mutated
RB1, which is located on chromosome 13 (1). This leads to the deficiency of protein
retinoblastoma (pRb), the translational product of the RB1
gene, which regulates the G1 checkpoint of the cell
cycle by binding to E2 factor (E2F) (2). Therefore, loss of pRb leads to
unregulated cell cycle progression, reduced apoptosis and
uncontrolled cell proliferation (2,3).
Several chemotherapies, radiotherapies and thermotherapies have
been used to treat retinoblastoma (4–6).
However, numerous patients experience recurrence or symptoms
related to the toxicity of chemotherapies, and enucleation is still
often implemented, which significantly affects the quality of life
after operation (4). Therefore, an
alternative therapeutic strategy is imperative to enhance the eye
salvation rate and quality of life in young patients.
The translational product of RB1, pRb, binds to E2F
and inhibits cell cycle progressive activities. Therefore,
deficiency of pRb leads to overexpression and hyperactivity of E2F,
which is also known to interact functionally with specificity
factor 1 (Sp1) (7,8). The C- terminal domain of Sp1 binds to
the N-terminus of E2F, which facilitates its activities (7). Another study has also reported
cooperative relations between these two proteins in
Drosophila and mice (9). An
increase in Sp1 can lead to increased expression and activity of
protein arginine deiminase II (PADI2) (10,11). A
previous study on human keratinocytes reported that Sp1 was
involved in regulating PADI2, and that the activity and binding of
Sp1 facilitated the transcription of PADI2 (10). Another study reported that Sp1
facilitated the mRNA expression of PADI2 in bone marrow cells in
rheumatoid arthritis (11).
Therefore, it can be deduced that an increase in Sp1 can lead to
overexpression of PADI2. Since E2F activity is known to be
increased in retinoblastoma due to RB1 deficiency, this implies
that PADI2 may also be overexpressed.
The epigenetic regulator PADI2 is involved in the
transcription of genes that accelerate cell proliferation, and is
overexpressed in numerous cancer types, including breast, skin and
ovarian cancer (12–15). PADI2 citrullinates the arginine of
histone H3, which leads to increased transcription of cell
cycle-progressing genes such as RNA polymerase II (16). Previous clinical studies have
reported a significant association between PADI2 level and survival
(15,17). Furthermore, preclinical studies have
reported tumor-suppressive effects of PADI2 inhibition (13,17–20).
Based on the RB1 deficient characteristics of
retinoblastoma and previous studies on the role of PADI2 in
numerous tumors, it was hypothesized that this may be a novel
therapeutic target in retinoblastoma. The present is a preclinical
study on the PADI2 inhibitor BB-Cl-amidine in in vitro and
in vivo models of retinoblastoma. Representative cell lines
and orthotopic xenograft mouse models were used to evaluate the
efficacy and toxicity of BB-Cl-amidine. The results revealed that
PADI2 expression was upregulated in retinoblastoma, and PADI2
inhibition attenuated oncogenic activity. These results suggested
therapeutic potential and promising prospects for further clinical
translation.
Materials and methods
Drugs
BB-Cl-amidine (cat. no. HY-111347A) was purchased
from MedChemExpress, while E2F inhibitor (cat. no. 324461) was
purchased from Sigma-Aldrich; Merck KGaA.
Cell lines
Two retinoblastoma cell lines, Y79 and WERI-Rb-1,
were used in the present study. Y79 [cat. no. HTB-18; American Type
Culture Collection (ATCC)] and WERI-Rb-1 (cat. no. HTB-169; ATCC)
cells were cultured in RPMI-1640 medium (cat. no. 30-2001; ATCC and
cat. no. LM011-01; Welgene, Inc.) at 37°C with 5% CO2. A
normal retinal pigment epithelium cell line, ARPE-19, was used for
comparison. ARPE-19 (cat. no. CRL-2302; ATCC) cells were cultured
in DMEM-F12 medium (cat. no. 30-2006; ATCC and cat. no. LM002-04;
Welgene, Inc.).
Orthotopic xenograft mouse model
An orthotopic retinoblastoma mouse model was
generated by injecting cultivated Y79 and WERI-Rb-1 cell lines into
the vitreous cavity of BALB/c-nude mice (OrientBio Inc.) according
to previous protocols (21,22). All animal experiments were performed
with the approval (approval no. SNU-220512-3) of the Institutional
Research Ethics Committee of Seoul National University College
(Seoul, Korea). All mice were 6-weeks old female. A total of 20
mice were used with an average weight of 20 g. They were kept in
cages with individual circulation. The temperature was controlled
in the range of 20–25°C. Remaining food and water were monitored
daily and refilled whenever needed. The light/dark cycle was 14/10
h according to the institution's guideline. The health conditions
and behavior of all animals were monitored 5 times a week with
professional veterinarian assistance. The number of mice per
standard cage was restricted to 5 mice according to the
institution's animal ethics guideline. Cells at a density of
2×10⁴ cells per eye were suspended in PBS. Prior to
intravitreal cell injection, mice were put under complete
anesthesia to minimize suffering and distress. They were also
placed under infrared lighting to prevent hypothermia when under
anesthesia and were monitored carefully until full conscious was
confirmed. For anesthesia, Zoletil (30 mg/kg; Virbac) and xylazine
(10 mg/kg; Bayer-Korea, Ltd.) were injected intraperitoneally
according to a previous protocol (23). A previous publication supported the
use of Zoletil for anesthetic purposes (24). After adequate anesthesia, the cell
suspension was injected into one eye per mouse using a 30-gauge
needle. Control group and an experimental group which received
BB-Cl-amidine injection consisted of 10 mice. BB-Cl-amidine (2 µM)
was injected intravitreally following the anesthesia 2 weeks after
the injection of cells. All mice were euthanized, visually graded
and enucleated 4 weeks after cell injection, making the total
duration of 4 weeks. It was planned to euthanize any mice that
exhibited ≥15% loss of body weight, or showed protruded eyeball.
However, no mouse was succumbed or reached humane endpoints during
the duration of the experiment. When the pre-planned termination
timepoint was reached, all mice were first anesthesized with the
same protocol implemented before intravitreal injection. After full
unconsciousness was confirmed, mice were placed in a CO2
chamber where they were sacrificed by a flow rate of CO2
that caused 50% displacement of the cage volume per min. This took
place at January 2022. Animal death was confirmed by 20 min of
observation of full unconsciousness and absence of breathing and
heartbeat. All procedures followed the guidelines of the National
Institutes of Health for euthanasia of rodents. Mice were
maintained and treated in a specific-pathogen-free facility, in
accordance with the Association for Research in Vision and
Ophthalmology statement for the use of animals in ophthalmic and
vision research.
pLKO.1 lentiviral infection
The lentiviral pLKO.1 vector-small hairpin RNA
(shRNA) based on a 2nd generation system targeting PADI2 (shPADI2),
and negative control (shNS) were supplied by Yonsei University. The
following shRNA sequences were used: shNS,
5′-CCGGCAACAAGATGAAGAGCACCAACTCGAGTTGGTGCTCTTCATCTTGTTGTTTTT-3′;
shPADI2 (1),
5′-GCACCTTCATCGACGACATTT-3′; and shPADI2 (2), 5′-GTGTGCTGCATGAAGGATAAT-3′. To
generate stable transfectants, 293T cells were seeded in 60-mm
plates and the 1 µg lentiviral pLKO.1 vector and virus packing
mixture (including 750 ng psPAX2 packaging plasmid and 250 ng
pMD2.G envelope plasmid) were co-transfected into 293T cells (cat.
no. CRL-1573; ATCC) with Polyethylenimine (PEI, cat. no. 408727;
Sigma-Aldrich; Merck KGaA) for 24 h at 37°C. 293T cells were
changed with fresh medium and incubated for 48 h at 37°C. Next, the
virus-containing medium was harvested and concentrated using a
lenti-X concentrator (cat. no. 631231; Takara Bio, Inc.) according
to the manufacturer's instructions. A total of 5 ml of
lentivirus-containing medium and 1.5 ml of a concentrator were
mixed, incubated for 30 min at 37°C, and centrifuged by 1,500 × g
for 45 min at 4°C in a centrifuge (cat. no. 1248R; LABOGENE). After
removing the supernatant, the viral pellet was resuspended in fresh
medium and added to Y79 cells seeded in 60-mm plates without
dilution for lentiviral transduction. The multiplicity of infection
(MOI) value was not defined. Culture scales of the packaging cells
and the target cells were the same, and the virus obtained from one
plate of 293T infected one plate of Y79 cells. The shRNA-transduced
Y79 cells were incubated for 24 h at 37°C. After 24 h, the medium
was replaced with fresh medium containing 1 µg/ml puromycin (cat.
no. P8833; Sigma-Aldrich; Merck KGaA). Puromycin-resistant clones
were selected. Knockdown efficiency was evaluated using western
blotting.
Reverse transcription PCR
(RT-PCR)
Y79 cells were seeded in 60-mm plates at a density
of 1×10⁶ cells and treated with E2F inhibitor 40 µM.
After treating E2F inhibitor for 0, 24 and 48 h, the cells were
harvested. Following harvest, total RNA was extracted using QIAzol
Lysis Reagent (cat. no. 79306; Qiagen, Inc.) according to the
manufacturer's instructions. Total RNA concentration was measured
using a NanoDrop 2000 spectrophotometer (NanoDrop Technologies;
Thermo Fisher Scientific, Inc.) at a wavelength of 260 nm. Total
RNA (1,000 ng) was reverse transcribed to cDNA using amfiRivert
cDNA Synthesis Platinum Master Mix (cat. no. R5600; GenDEPOT, LLC)
at 42°C for 1 h, and the reaction was quenched by heating at 94°C
for 5 min. RT-PCR was performed using Takara PCR Thermal Cycler
Dice (cat. no. TP600; Takara Bio, Inc.). cDNA (1 µl) was amplified
with 2.5 U Pfu polymerase, 50 mM KCl, 10 mM Tris-HCl (pH
8.3), 1.5 mM MgCl2, 0.02 mM dNTPs (cat. no. E-2015-1;
Bioneer Corporation) and 0.1 µM each primer. The following primer
sequences were used: PADI2 forward, 5′-ACAAAGTGGGCGTGTTCTACG-3′ and
reverse, 5′-CCACCCGTGTACTTGACCA-3′; and HPRT forward,
5′-TGACACTGGCAAAACAATGCA-3′ and reverse,
5′-GGTCCTTTTCACCAGCAAGCT-3′. The PCR products were electrophoresed
on 2% agarose gels at 100 V for 30 min. The HPRT was used as
internal control for normalization. The PCR products were
electrophoresed on 2% agarose gels containing SafePinky DNA Gel
staining solution (cat. no. S1001-025; GenDEPOT, LLC) at 100 V for
30 min. The agarose gel was exposed and the bands were visualized
using Gel Doc™ XR system (cat. no. 170-8170; BIO-RAD, Inc.).
Cell proliferation assay
Y79 and ARPE-19 cells were seeded in 96-well plates
at a density of 5×10³ cells per well and treated with
DMSO or different concentrations of BB-Cl-amidine (0.5, 1, 1.5, 2
and 2.5 µM) for 48 h. Subsequently, 20 µl MTS reagent (cat. no.
G3580; Promega Corporation) was added to each well, and the cells
were incubated at 37°C for 1 h in the dark. Finally, the quantity
of the formazan product was measured by recording the absorbance at
490 nm using a 96-well plate reader (cat. no. 340PC384; Molecular
Devices, LLC).
Cell counting and colony formation
assay
For the cell counting assay, Y79 cells were seeded
in 12-well plates at a density of 1×10⁵ cells/well. The
cells were treated with DMSO or BB-Cl-amidine (2 µM), harvested,
and counted at 0, 24, 48 and 72 h after treatment. Each counting
was performed eight times, and the mean was obtained.
For the colony formation assay, Y79 cells were
seeded in 12-well plates coated with 100 mg/ml poly-D-lysine (cat.
no. A38904-01; Gibco; Thermo Fisher Scientific, Inc.) at a density
of 1×10³ cells per well and treated with DMSO or
BB-Cl-amidine (2 µM). The cells were then incubated at 37°C for 2
weeks. After forming colonies, the colonies were washed twice with
PBS, fixed with 100% methanol for 10 min, stained with 1% crystal
violet for 30 min, and washed with distilled water. Finally, the
images of colonies were captured, and the colonies were counted
using the ImageJ 1.53K software (National Institutes of
Health).
Immunofluorescence assay
Y79 cells were plated on a 12-well plate coated with
poly-D-lysine and incubated at 37°C for 48 h. For inhibition of
PADI2, Y79 cells were treated with BB-Cl-amidine 2 µM or small
hairpin RNA (shRNA). Subsequently, the cells were fixed with 4%
paraformaldehyde at room temperature for 10 min and permeabilized
with 0.1% Triton X-100 for 5 min. Next, the cells were treated with
2% bovine serum albumin (BSA, cat. no. A0100-010; GenDEPOT, LLC)
for 1 h to minimize nonspecific binding and then incubated with
primary antibodies in 2% BSA at 4°C overnight. The next day, the
cells were treated with Alexa Fluor 488 goat IgG antibody (cat. no.
A-11034; Thermo Fisher Scientific, Inc.) in 2% BSA (1:1,000) at
room temperature for 1 h. Nuclear staining was performed using DAPI
solution (cat. no. 62248; Thermo Fisher Scientific, Inc.). Finally,
the slips were observed under a fluorescence microscope (EVOS™ FL
Auto 2 Imaging system, cat. no. AMAFD2000; Thermo Fisher
Scientific, Inc.). The primary antibodies used were against Ki67
(1:500; cat. no. ab15580; Abcam) and BrdU (1:500; cat. no.
11296736001; Roche Diagnostics).
Wound healing assay
Y79 cells were cultured overnight in 12-well plates
coated with poly-D-lysine. After Y79 cells were 100% of confluency,
straight wounds were created using 200-µl pipette tips. Next,
straight wounds were created using 200-µl pipette tips. After
washing with culture medium to remove cell debris, the wounded
cells were incubated in medium with 10% FBS (cat. no. F0900-050;
GenDEPOT, LLC) containing DMSO or BB-Cl-amidine (2 µM). Images of
the wound gaps were captured at 0, 24, 48 and 72 h. The results
were evaluated using an EVOS microscope (cat. no. AMAFD2000; Thermo
Fisher Scientific, Inc.).
Invasion assay
Transwell inserts (24-well plate; pore size 8.0 µM;
cat. no. 37224; SPL Life Sciences) were coated with 100 µg/ml
fibronectin (cat. no. F2006; Sigma) for 1 h. The upper surface of
the Transwell insert was then coated with 100 µl Matrigel diluted
1:5 in serum-free RPMI-1640 medium at 37°C overnight. Y79 cells
were seeded at a density of 1×10⁵ cells per well in the
upper chamber with 200 µl serum-free medium and treated with DMSO
or BB-Cl-amidine (2 µM). The bottom chamber was filled with 800 µl
complete medium containing 10% FBS (cat. no. F0900-050; GenDEPOT,
LLC). After 36 h, the invasive cells were fixed with 100% methanol
for 10 min and stained with 1% crystal violet at room temperature
for 10 min. Finally, images of the Transwell inserts were captured
using an EVOS microscope (cat. no. AMAFD2000; Thermo Fisher
Scientific, Inc.) at ×20 magnification. The migration assay was
performed similarly to the invasion assay, with the exception of
the Transwell inserts, which were not coated with Matrigel.
Western blot assay
Upon harvesting, cells were lysed in lysis buffer
[50 mM Tris-HCl (pH 8.0), 200 mM NaCl and 0.5% NP-40] containing a
protease inhibitor cocktail (cat. no. 11836153001; Sigma-Aldrich;
Merck KGaA) for 30 min on ice. The lysates were centrifuged at
15,000 × g at 4°C for 15 min and the supernatants were collected.
Total protein was quantified by BCA assay (cat. no. 23227; Thermo
Fisher Scientific, Inc.). Total protein (~20 µg) was separated by
10–14% SDS-PAGE and transferred to a PVDF membrane (cat. no.
1620177; Bio-Rad Laboratories, Inc.). The membranes were blocked in
Tris-buffered saline containing 0.1% Tween 20 and 5% skim milk
(cat. no. CNS109; CELLNEST) at room temperature for 30 min, and
incubated with primary at 4°C for overnight and secondary
antibodies at room temperature for 1 h. The signal was visualized
using an enhanced chemiluminescence detection system (cat. no.
W3652-020; GenDEPOT, LLC). The band intensities were calculated
using the ImageJ 1.53K software (National Institutes of
Health).
The following primary antibodies were used:
Anti-β-actin (1:3,000; cat. no. A5441; Sigma-Aldrich; Merck KGaA),
anti-PADI2 (1:1,000; cat. no. 12110-1-AP; Proteintech Group, Inc.)
anti-cleaved poly (ADP-ribose) polymerase (PARP) (1:1,000; cat. no.
5625), anti-AKT (1:1,000; cat. no. 9272) and anti-phosphorylated
(p)-AKT (1:1,000; cat. no. 9271; all from Cell Signaling
Technology, Inc.). The HRP-conjugated AffiniPure Goat Anti-Rabbit
IgG (H + L) and HRP-conjugated AffiniPure Goat Anti-Mouse IgG (H +
L) secondary antibodies were as follows: (1:3,000-5,000; cat. nos.
111-035-003 and 115-035-003; Jackson ImmunoResearch Laboratories,
Inc.). In addition, the b-actin was used as a loading control for
normalization.
Cell apoptosis assay
Cell apoptosis assay was performed using Annexin
V-FITC Apoptosis Kit (cat. no. K101-100; BioVision, Inc.). Cells
were treated with DMSO or different concentrations of BB-Cl-amidine
(1 and 2 µM). After washing with PBS, the harvested cells were
resuspended in 500 µl 1X binding buffer and 5 µl annexin V-FITC,
propidium iodide (PI), or both at room temperature for 5 min in the
dark. Finally, early (annexin V-FITC+/PI−)
and late (annexin V-FITC+/PI+) apoptosis was
measured by flow cytometric analysis (BD FACSCanto II; BD
Biosciences) and BD FlowJo software (v.10.8.1; FlowJo LLC).
Additionally, Apopxin Green Indicator staining assay
was performed using Apoptosis/Necrosis Assay Kit (cat. no.
ab176749; Abcam). Cells were seeded in 12-well plates and treated
with DMSO or different concentrations of BB-Cl-amidine (0.5 and 1
µM) at a density of 5×10⁴ cells per well. After 48 h,
the cells were prepared and treated according to the manufacturer's
protocol. Images of apoptotic (green, GFP channel) and viable cells
(blue, DAPI channel) were captured using a fluorescence microscope
(EVOS-FL; Thermo Fisher Scientific, Inc.).
Cell cycle assay (PI staining
assay)
Cell cycle assay was performed with PI staining.
Briefly, cells were treated with DMSO or BB-Cl-amidine (2 µM) for
48 h and harvested. The harvested cells were washed and fixed.
Next, 200 µl RNase (1 mg/ml; cat. no. 12091021; Thermo Fisher
Scientific, Inc.) was added. The samples were incubated at 37°C for
30 min and stained with 300 µl PI solution (50 mg/ml in PBS; cat.
no. P4170; Sigma-Aldrich; Merck KGaA) in the dark. Finally, the
cell cycle was measured by flow cytometric analysis (BD FACSCanto
II and BD FlowJo software v.10.8.1).
Visual grading of tumor
A visual grading system for evaluating tumor
formation was used. Following sacrifice, the eyes were evaluated
according to the preset grading system and images were obtained for
further review. The grading system consists of grades 0 to 5, and
the standards were elaborated by our group, as previously described
in a previous study (25).
Immunofluorescence of mouse
tissue
The enucleated eyeballs of mice were formalin-fixed,
embedded in paraffin blocks, sectioned (4 µm) and deparaffinized
with Shandon Xylene Substitute (cat. no. 6764506; Epredia). The
sections were then stained with a primary antibody against PADI2
(cat. no. 12110-1-AP; Proteintech Group, Inc.) overnight at 4°C
according to the manufacturer's protocols. After overnight
incubation, Alexa Fluor 594-attached antibody (1:400; cat. no.
A-11012; Invitrogen; Thermo Fisher scientific, Inc.) was used as a
secondary antibody. The results were evaluated by fluorescence
microscopy (Eclipse 90i; Nikon Corporation).
Human tissue microarray
Human retinoblastoma tissue slides, including 24
retinoblastoma tissues originated from 12 different donors (cat.
no. BV35111a; Biomax). Immunostaining of the purchased slides was
performed as aforementioned with tissue from mice, using the same
antibodies and observing the results under a fluorescence
microscope. The slides were stained with hematoxylin and eosin
(H&E) for histological analysis and comparison. H&E slides
were scanned and analyzed using an Aperio ImageScope ×64 (Leica
Microsystems, Inc.).
Toxicity evaluation
Mice (6-week-old C57BL/6; Koatech) were
intravitreally injected with 2 µM BB-Cl-amidine after general
anesthesia. Optomotor response measurement (OptoMotry HD;
CerebralMechanics) and electroretinography (cat. no. UTAS E-2000;
LKC Technologies) were performed 1 week after injection according
to previous guidelines (26).
Enucleated eyes were prepared and analyzed using H&E staining
and TUNEL assay. Structure and toxicity evaluations were performed
according to a previously established protocol (22). The results of H&E staining were
analyzed by measuring the a/b ratio, where ‘a’ is the length from
the innermost ganglion cell layer to the outermost inner nuclear
layer, while ‘b’ is the length from the innermost ganglion cell
layer to the outermost outer nuclear layer. All mice were
maintained in a specific-pathogen free facility as previously
described, in accordance with the ARVO statement.
Statistical analysis
Data from the visual grading of tumors were
statistically analyzed using the U-Mann Whitney test (27,28).
The results of the cell viability, colony formation, wound healing
and apoptosis assays were analyzed via one-way ANOVA with post-hoc
Bonferroni's test. The results of the cell proliferation assay were
analyzed by comparing the control and BB-Cl-amidine groups at
different time points with unpaired Student's t-test.
Quantification of BrdU, and Ki67 staining was also performed with
unpaired Student's t-test. The proportion of cell cycle status was
analyzed using two-way ANOVA with post-hoc Bonferroni's test. All
statistical analyses were performed using GraphPad Prism version 9
(GraphPad Software; Inc.).
Results
PADI2 is highly expressed in
retinoblastoma and RB1 mutation induces PADI2 overexpression
The protein expression of PADI2 in ARPE-19, Y79 and
WERI-Rb-1 cells was first evaluated. Western blotting showed that
PADI2 protein was highly expressed in the retinoblastoma cell lines
Y79 and WERI-Rb-1 compared with that in human retinal pigment
epithelium ARPE-19 cells (Fig. 1A).
Immunohistochemistry performed on retinoblastoma and normal retina
tissue indicated that the expression of PADI2 was upregulated in
both mouse and human retinoblastoma tissues (Figs. 1B and C, and S1A). A distinct difference in expression
of PADI2 was observed between the retina of normal mice and
orthotopic retinoblastoma tissue (Figs.
1B and S1A). The expression of
PADI2 was also elevated in human retinoblastoma tissue (Fig. 1C).
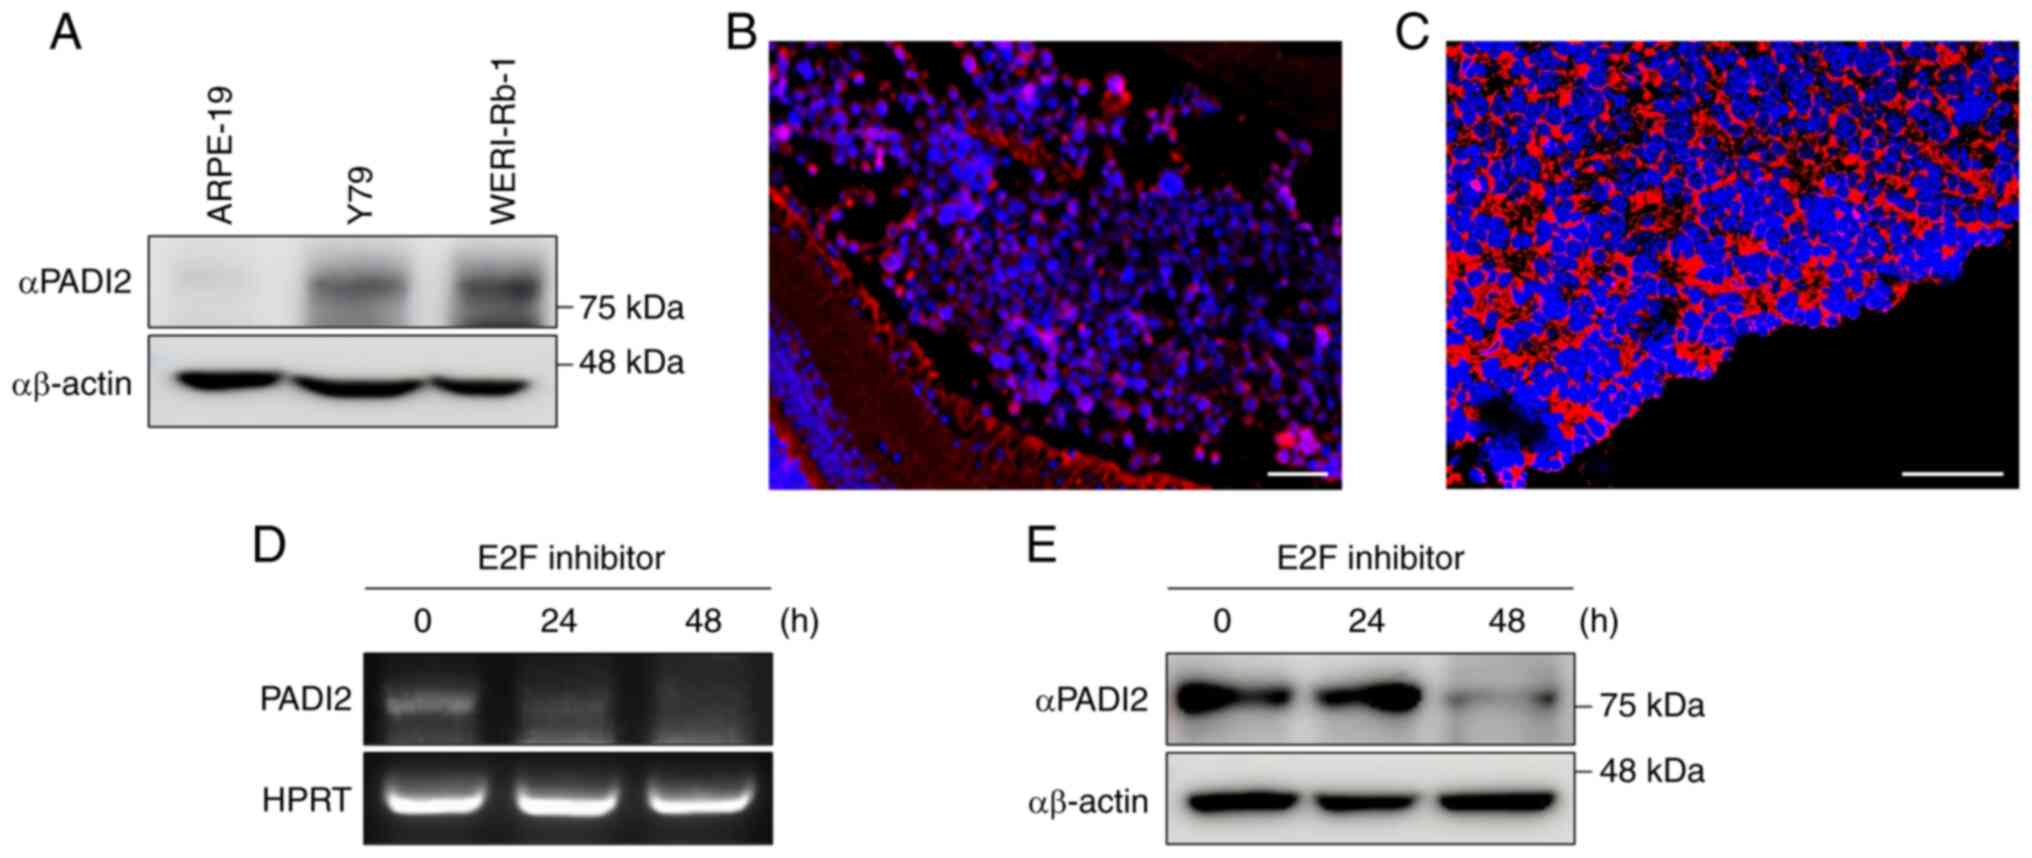 | Figure 1.PADI2 is highly expressed in
retinoblastoma, and E2F inhibition induces PADI2 overexpression.
(A) Protein expression level of PADI2 in the human retinoblastoma
cell lines Y79 and WERI-Rb-1 compared with that in the human
retinal pigment epithelial cell line ARPE-19, as determined by
western blotting. (B and C) Expression of PADI2 in (B) orthotopic
retinoblastoma tissue of mouse (magnification, ×200) and (C) human
retinoblastoma tissue (magnification, ×400), as determined by
immunostaining assay. Scale bar, 50 µm. (D and E) mRNA and protein
expression levels of PADI2 after treatment with an E2F inhibitor
(40 µM) for 0, 24 and 48 h, as determined by (D) reverse
transcription PCR and (E) western blotting. PADI2, protein arginine
deiminase II; E2F, E2 factor. |
A previous study reported that Sp1-binding sites
were highly present in the PADI2 promoter (10). Indeed, E2F becomes free when it is
not bound to pRb, which is absent in retinoblastoma cells due to
RB1 gene mutation, and interacts with Sp1 which results in
elevation of both proteins (7–9).
Elevated Sp1 then interacts with PADI2 promoter. Therefore, it was
hypothesized that free E2F may regulate the expression of PADI2 in
retinoblastoma with mutated RB1. To confirm this hypothesis, the
mRNA and protein expression of PADI2 was confirmed by treatment
with an E2F inhibitor. It was found that the expression of PADI2
was downregulated when cells were treated with an E2F inhibitor for
48 h (Fig. 1D and E), and that
PADI2 was aberrantly expressed in retinoblastoma.
PADI2 inhibition suppresses
proliferation and regulates phosphorylated (p)-AKT expression in
vitro
The present study aimed to determine the role of
PADI2 in retinoblastoma. To confirm whether PADI2 affected the
viability of Y79 cells, the effects of BB-Cl-amidine (a small
molecule inhibitor of PADI2) were evaluated in Y79 and ARPE-19
cells. Cells were treated with DMSO and BB-Cl-amidine for 48 h, and
MTS assay was performed. The results revealed that BB-Cl-amidine
reduced the viability of Y79 cells in a dose-dependent manner
(Fig. 2A); however, ARPE-19 cells
were not affected (Fig. 2B). These
results demonstrated that PADI2 inhibition explicitly attenuated
the viability of the aforementioned retinoblastoma cell line.
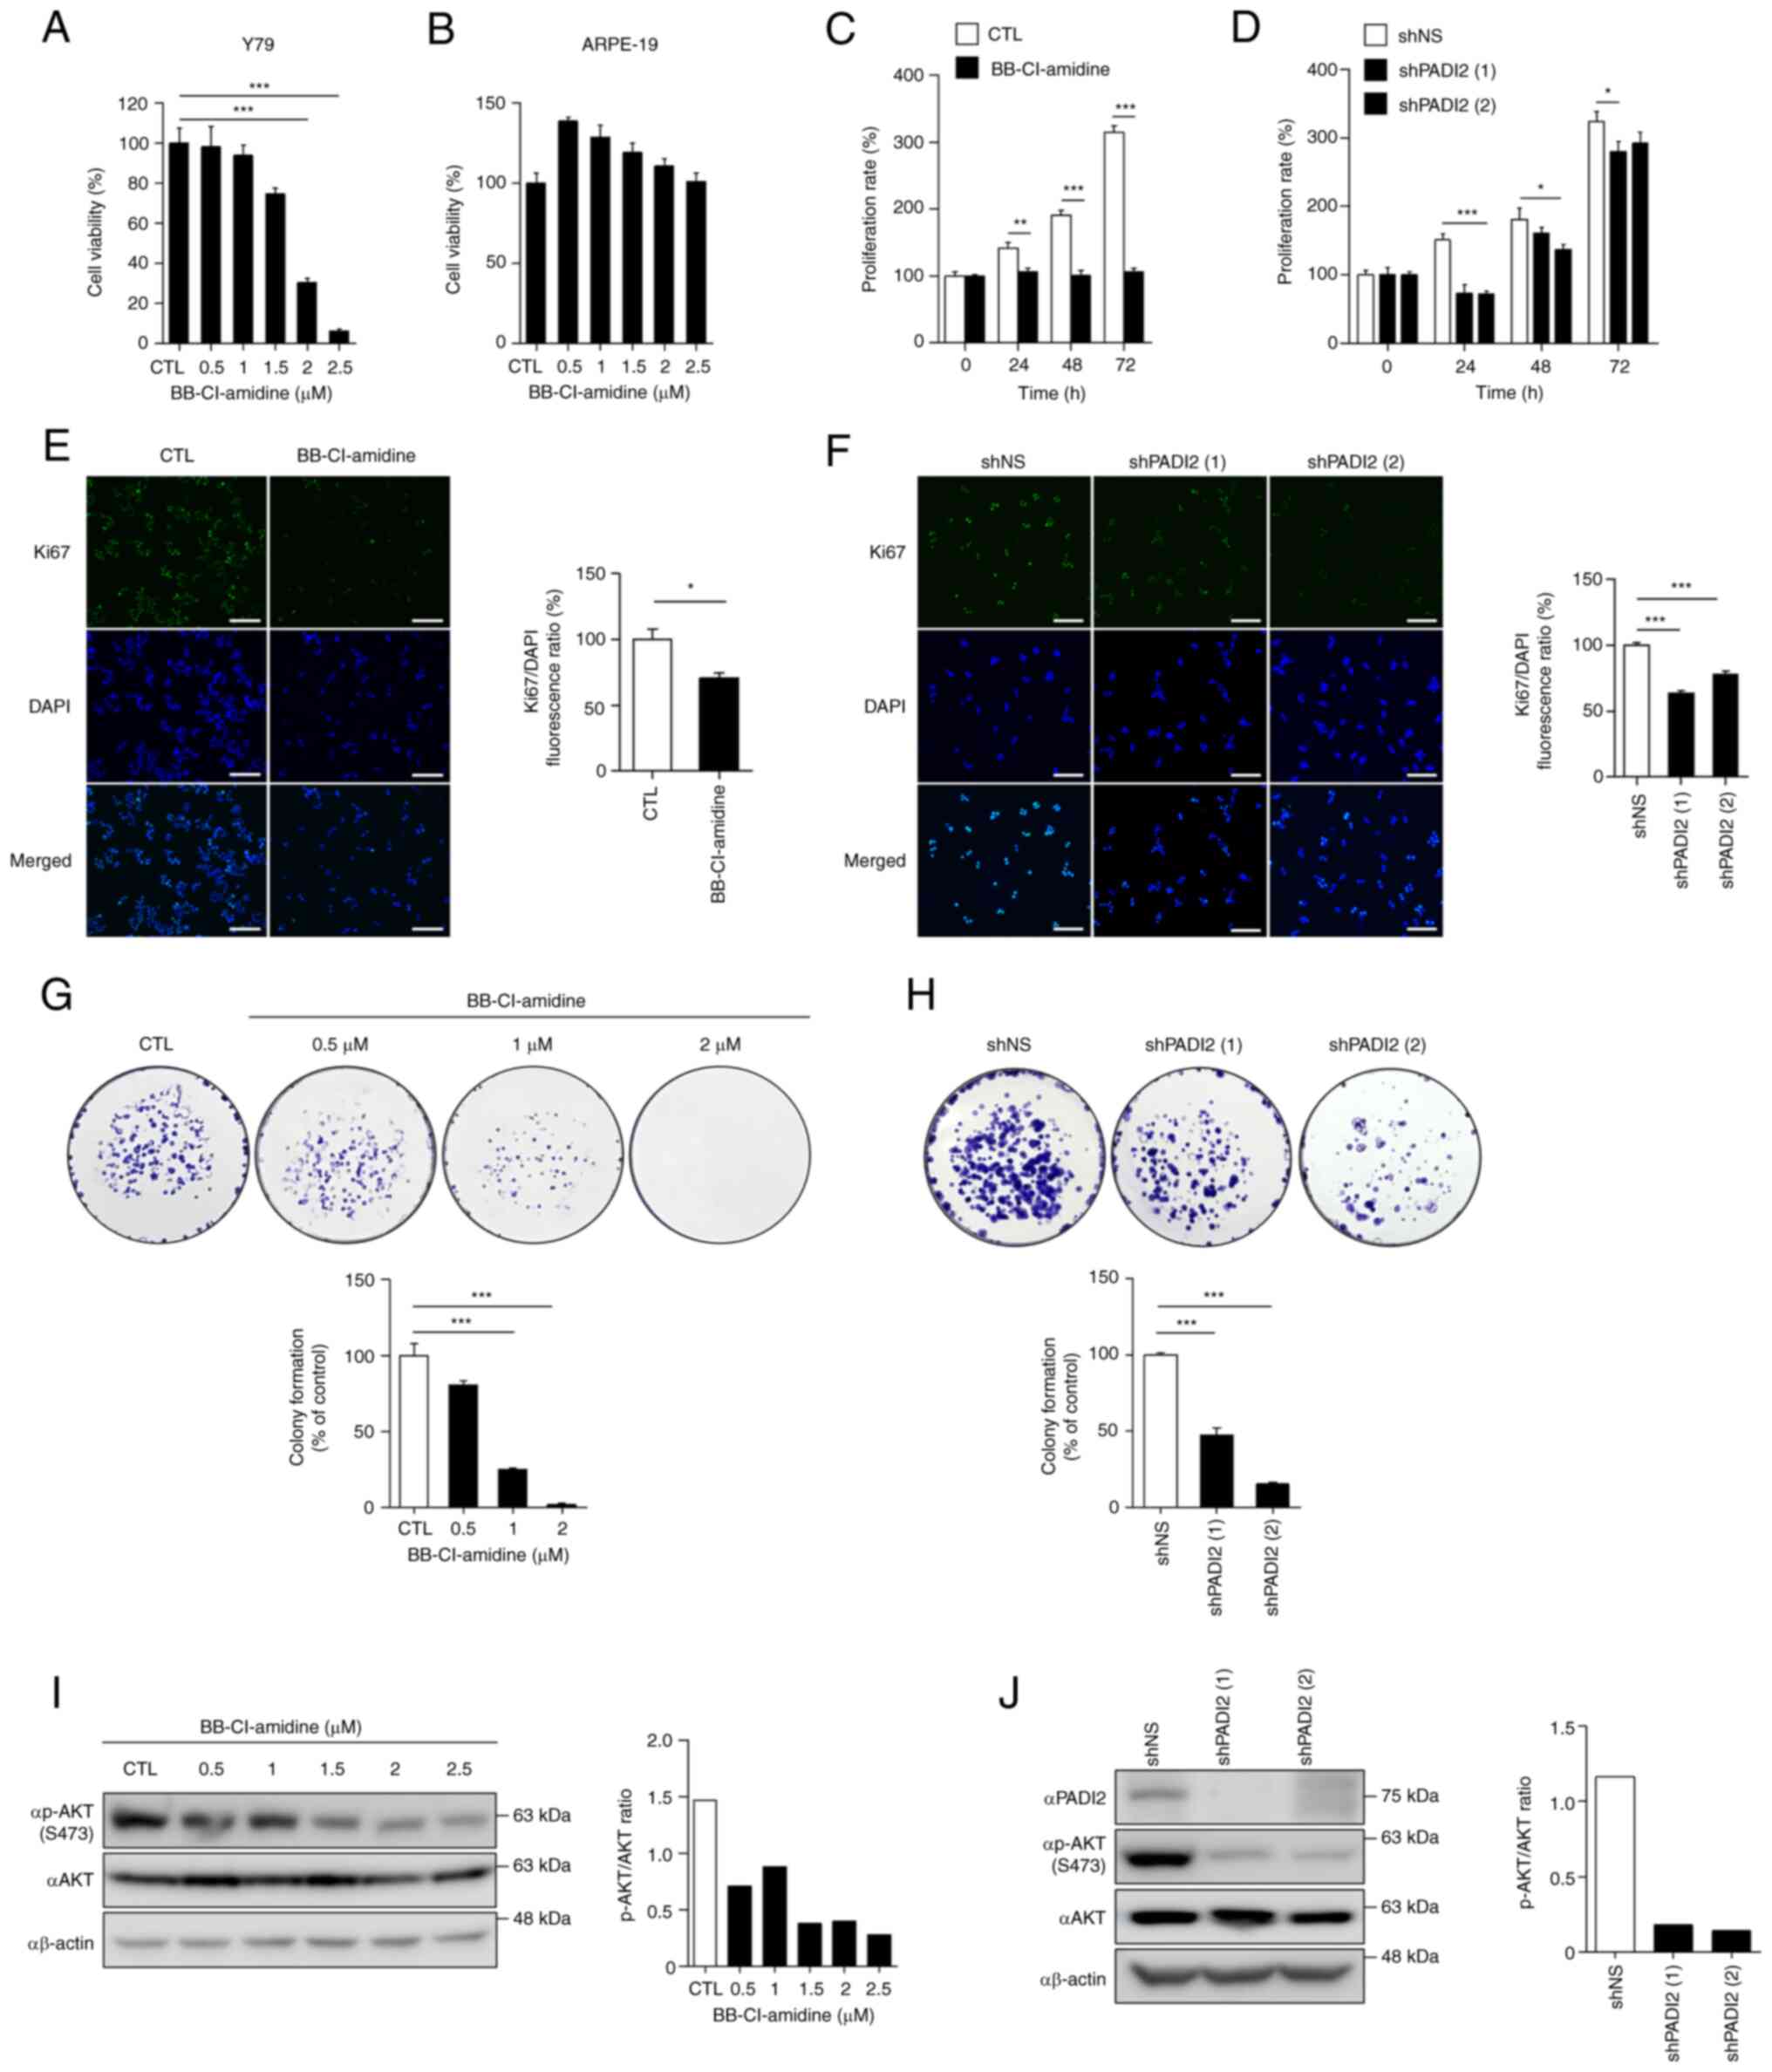 | Figure 2.PADI2 inhibition suppresses
proliferation and regulates p-AKT expression in vitro. (A
and B) Cell viability of (A) Y79 and (B) ARPE-19 cells treated with
BB-Cl-amidine (a small molecule inhibitor of PADI2) for 48 h in a
dose-dependent manner by MTS assay (n=4). (C and D) Proliferation
rates of (C) Y79 cells treated with DMSO and 2 µM BB-Cl-amidine
(n=8) or (D) control and PADI2-depleted Y79 cells in a
time-dependent manner, as determined by cell counting assay (n=4).
(E and F) Fluorescence intensity of the proliferation marker Ki67
in (E) Y79 cells treated with DMSO and 2 µM BB-Cl-amidine for 48 h
(n=3) or (F) control and PADI2-depleted Y79 cells, as determined by
immunofluorescence assay (n=4). Representative immunostaining
images (left) and graphs of the Ki67/DAPI fluorescence ratio
(right) are shown (magnification, ×20). Scale bar, 125 µm. (G and
H) Quantitative analysis of colony formation in (G) Y79 cells
treated with DMSO and BB-Cl-amidine (n=3) or (H) control and
PADI2-depleted Y79 cells for 2 weeks (n=4). Representative images
of colony formation (top) and graphs of colony formation (% of
control) (bottom) are shown. (I and J) Protein expression of PADI2,
p-AKT and AKT in (I) Y79 cells treated with DMSO and BB-Cl-amidine
for 48 h or (J) control and PADI2-depleted Y79 cells, as determined
by western blotting. Western blotting images (left) and graphs of
the P-AKT/AKT ratio (right) are shown. Bars indicate SEM. *P≤0.05,
**P≤0.01 and ***P≤0.001, as determined by (A and F-H) one-way ANOVA
with post-hoc Bonferroni test, (C and D) two-way ANOVA with
post-hoc Bonferroni test or (E) unpaired Student's t-test. PADI2,
protein arginine deiminase II; p-, phosphorylated. |
Next, changes in cell proliferation were analyzed to
investigate whether inhibition of PADI2 regulated the proliferation
of Y79 cells. When BB-Cl-amidine was treated time-dependently, Y79
cells did not proliferate compared with control cells (Fig. 2C). Furthermore, PADI2 in Y79 cells
was depleted using a lentiviral system to determine whether PADI2
knockdown had similar effects to BB-Cl-amidine treatment.
PADI2-depleted Y79 cells proliferated more slowly than control
cells (Fig. 2D). The fluorescence
intensity of BrdU and Ki67 (cell proliferation markers) was also
evaluated. The results showed that BrdU incorporation and Ki67
levels effectively decreased in BB-Cl-amidine-treated Y79 cells
(Figs. 2E and S2A). In addition, Ki67 staining was
performed in PADI2-knockdown Y79 cells, indicating that PADI2
ablation inhibited cancer cell growth (Fig. 2F). To further evaluate the oncogenic
role of PADI2 in retinoblastoma, colony formation, invasion and
wound healing assays were performed following BB-Cl-amidine
treatment and PADI2 depletion. PADI2 inhibition reduced colony
formation (Fig. 2G and H),
invasiveness (Fig. S2B) and wound
healing activity (Fig. S2C) in Y79
cells.
Furthermore, it was hypothesized that the molecular
mechanism of PADI2 involves cell proliferation and invasion. AKT
kinase regulates cell proliferation and survival in numerous human
cancer types, including retinoblastoma, and breast, colorectal and
prostate cancer (29–35). p-AKT regulates tumorigenesis and
metastasis in breast cancer (30),
and elevated p-AKT activity increases tumor progression and
invasiveness in prostate cancer expressing low levels of PTEN
(31). In addition, inhibition of
methyltransferase-like 3 induces apoptotic cell death via the
PI3K/AKT/mTOR signaling pathway (34), and oncogenes such as tribbles
pseudokinase 3 and ribosome biogenesis regulator 1 homolog promote
cell proliferation and invasion via the AKT/mTOR signaling pathway
in retinoblastoma (33,35). Therefore, it is crucial to identify
targets that control the AKT signaling pathway in cancer. As
revealed in Fig. 2I, the p-AKT
levels gradually decreased in BB-Cl-amidine-treated Y79 cells. When
p-AKT expression in PADI2-depleted Y79 cells was confirmed, the
p-AKT level was reduced compared with that in the control cells
(Fig. 2J). Thus, PADI2 regulated
p-AKT expression, thereby enhancing cancer cell proliferation.
PADI2 inhibition induces cancer cell
death in vitro
Next, cancer cell death induced by PADI2 suppression
was verified in Y79 cells. PARP belongs to the NAD+
ADP-ribosyl transferase family, which is essential for the
metabolism of various biological processes and is involved in
apoptosis (36). Treatment of Y79
cells with BB-Cl-amidine increased the level of cleaved PARP in a
dose-dependent manner (Fig. 3A).
This result was also observed in PADI2-knockdown Y79 cells
(Fig. 3B). In addition, it was
found that the expression of cleaved PARP was elevated in WERI-Rb-1
cells following BB-Cl-amidine treatment (Fig. S3A). These results indicated that
both BB-Cl-amidine and PADI2 elimination had pro-apoptotic effects
in retinoblastoma cells.
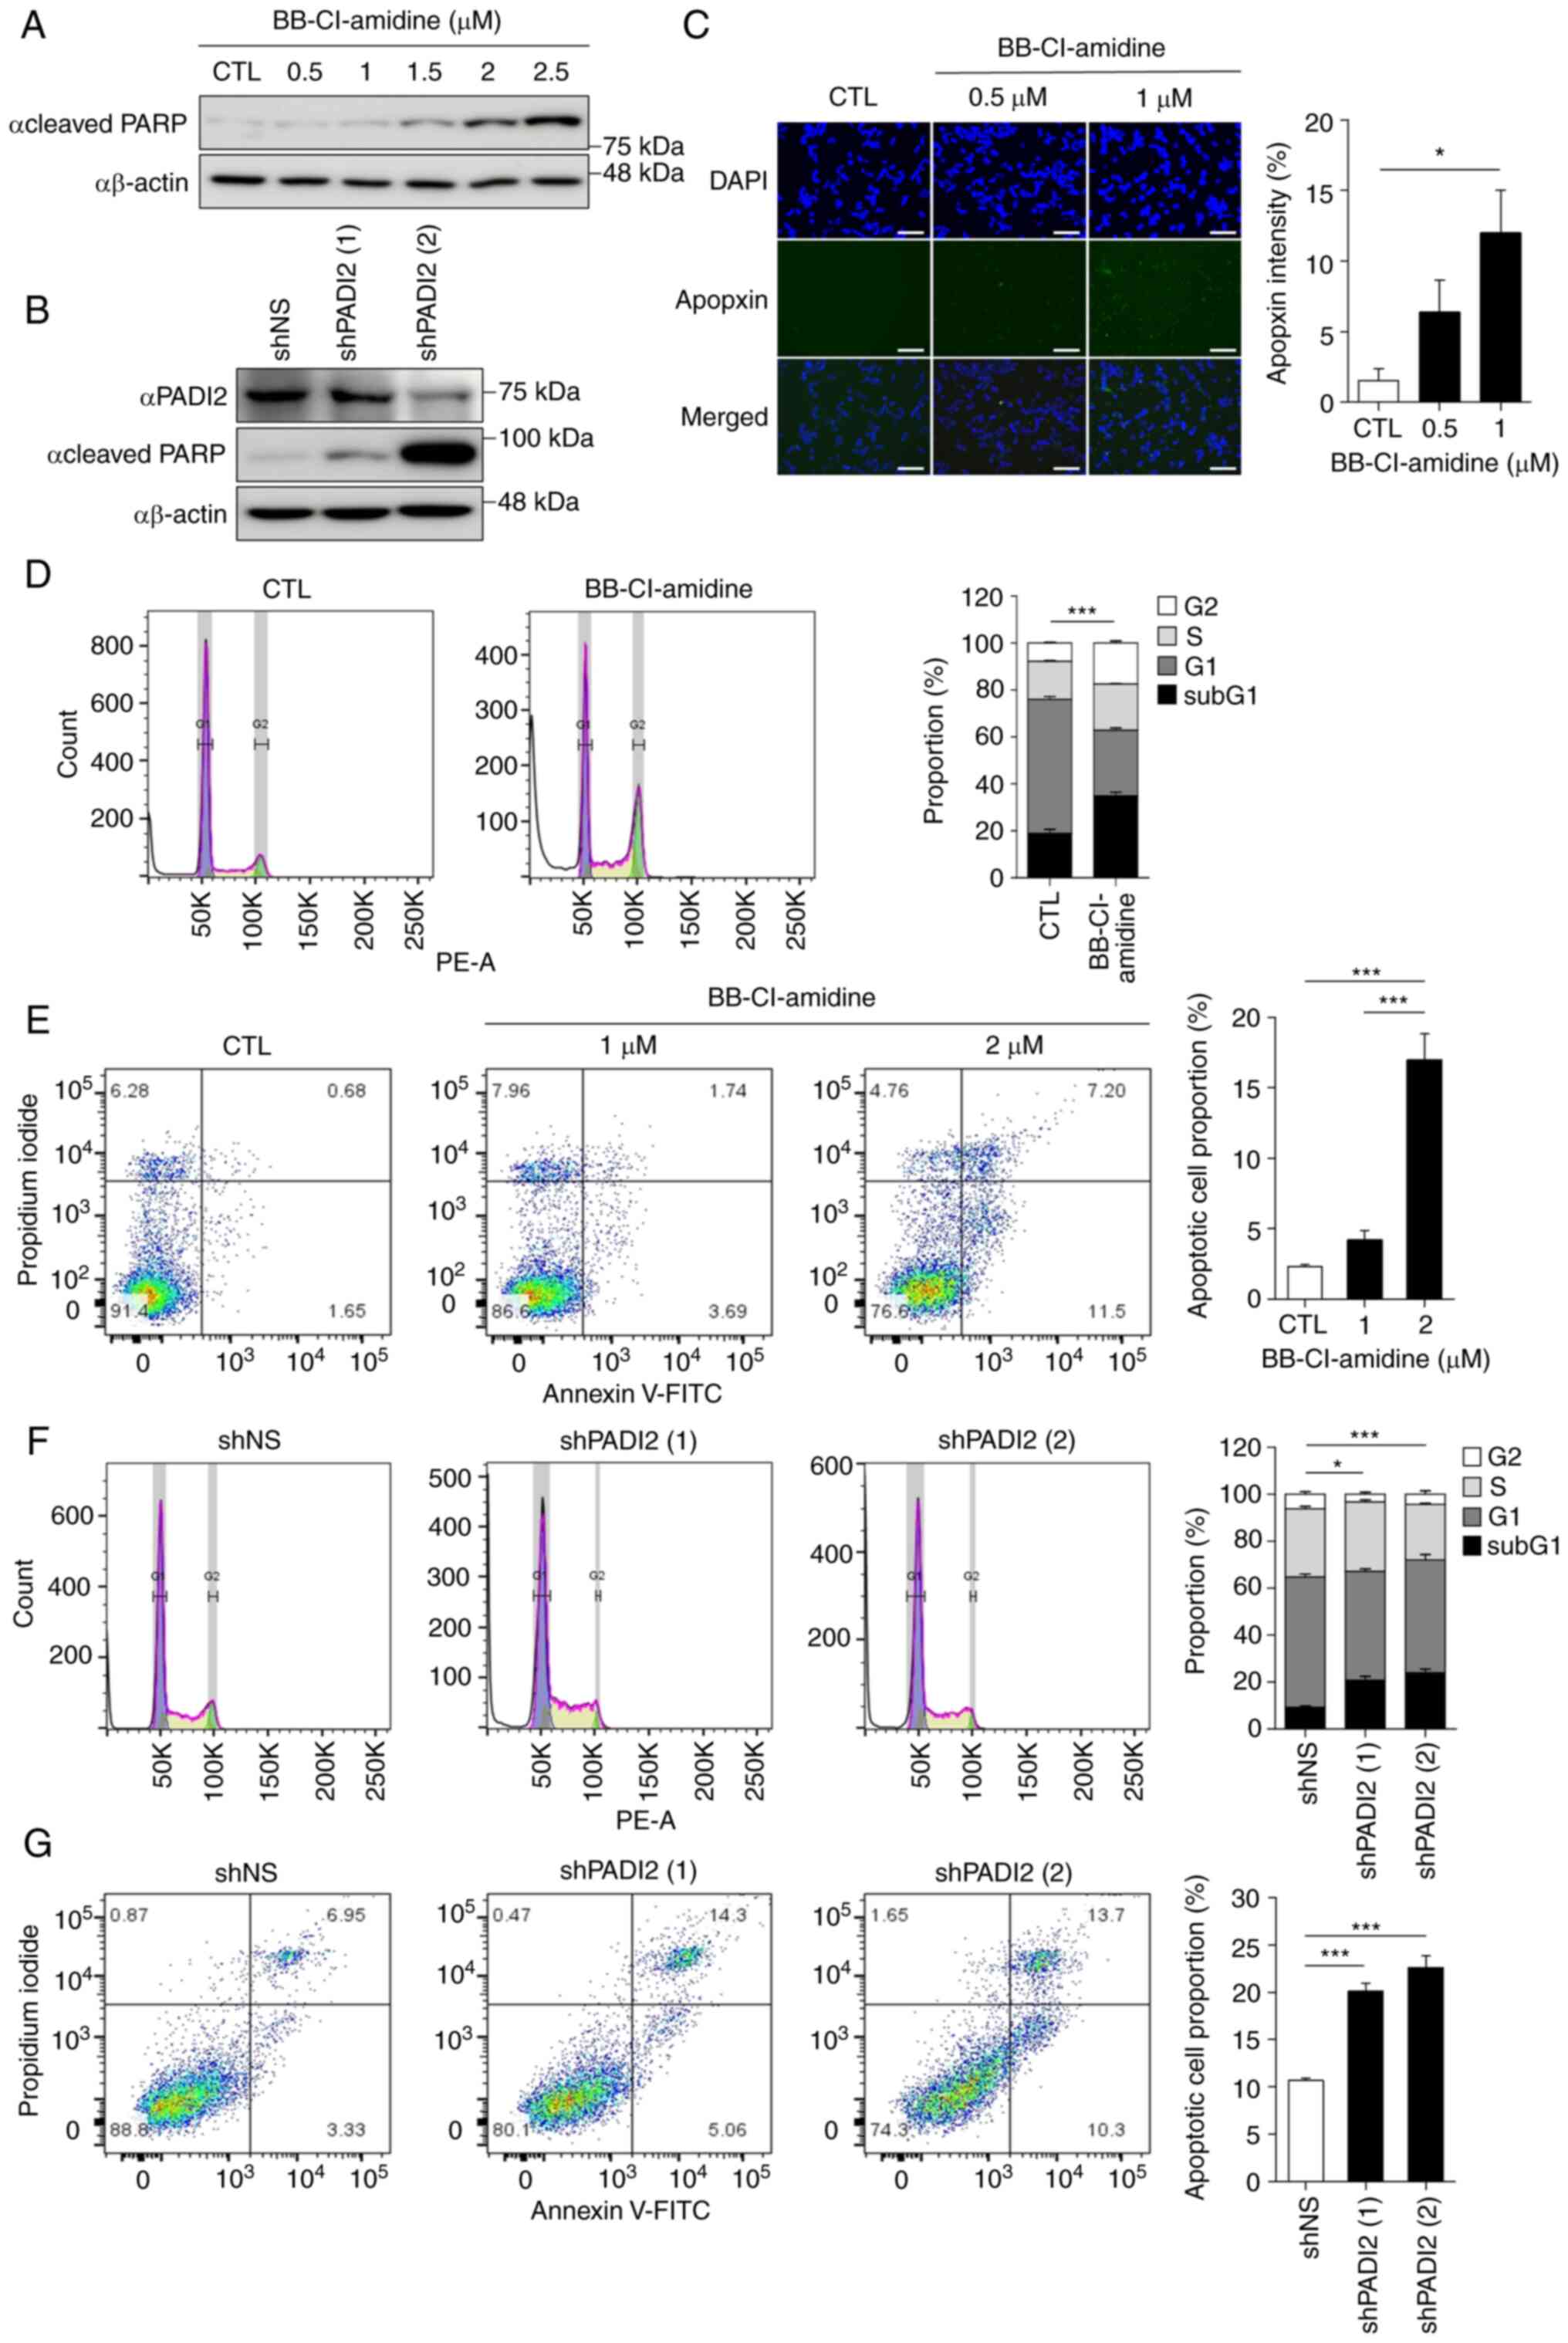 | Figure 3.PADI2 inhibition induces cancer cell
death in vitro. (A and B) Expression of cleaved poly
(ADP-ribose) polymerase protein in (A) Y79 cells treated with DMSO
and BB-Cl-amidine for 48 h in a dose-dependent manner or (B)
control and PADI2-depleted Y79 cells, as determined by western
blotting assay. (C) Apoptosis-positive areas in Y79 cells treated
with DMSO and BB-Cl-amidine (0.5 and 1 µM) for 48 h were analyzed
by Apoptosis/Necrosis Assay Kit. Apopxin Green+
indicates the apoptotic cells. Representative immunostaining images
(left) and graphs of Apopxin Green intensity (right) are shown
(magnification, ×20). Scale bar, 125 µm (n=5). (D) Distributions of
the cell cycle at sub-G1 (black), G1 (dark
grey), S (bright grey) and G2 (white) phases in Y79
cells treated with DMSO and 2 µM BB-Cl-amidine for 48 h, as
determined by flow cytometry (n=4). (E) Proportions of total
apoptotic cells in Y79 cells treated with DMSO and 2 µM
BB-Cl-amidine for 48 h, as determined by annexin V-FITC/PI staining
(n=4). (F) Distribution of the cell cycle in control and
PADI2-depleted Y79 cells, as evaluated by flow cytometry (n=4). (G)
Proportion of total apoptotic cells in control and PADI2-depleted
Y79 cells, as determined by annexin V-FITC/PI staining (n=4). (D-G)
Statistical graphs (top) and representative cell distribution
results (bottom) are shown. Bars indicate SEM. *P≤0.05 and
***P≤0.001, as determined by (C, E and G) one-way ANOVA with
post-hoc Bonferroni test and (D and F) two-way ANOVA with post-hoc
Bonferroni test. PADI2, protein arginine deiminase II; PI,
propidium iodide. |
Additional cell death analyses were performed,
including the Apopxin Green Indicator staining, annexin V-FITC
assay and cell cycle analysis. As demonstrated in Fig. 3C, the fluorescence intensity of the
apoptotic phosphatidylserine sensor Apopxin Green was significantly
enhanced after treatment with BB-Cl-amidine in Y79 cells. When
WERI-Rb-1 cells were treated with BB-Cl-amidine, similar result as
in Y79 cells were confirmed (Fig.
S3B). As the concentration of BB-Cl-amidine increased, a
greater percentage of sub-G1 population was observed (Fig. 3D). Furthermore, flow cytometric
analysis of annexin V revealed a similar tendency under
BB-Cl-amidine treatment in Y79 cells (Fig. 3E). When PADI2 shRNA was introduced,
the sub-G1 population and annexin V staining pattern were
consistent with those of PADI2 inhibitor treatment (Fig. 3F and G). Taken together, these data
suggested that PADI2 inhibition effectively induced cancer cell
death.
PADI2 inhibition suppresses tumor
growth in vivo
Orthotopic transplantation mouse models were used to
examine the in vivo effects of PADI2 inhibition. PADI2
inhibition was performed with either shRNA introduction or
BB-Cl-amidine injection. Two weeks after intravitreally injecting
the representative retinoblastoma cell lines Y79 and WERI-Rb-1,
BB-Cl-amidine was administered intravitreally at a dosage of 2 µM,
in parallel to the in vitro assays. PBS, the solvent of
BB-Cl-amidine, was injected into the control groups. The size of
the tumors was evaluated after 2 weeks, immediately after
euthanasia, according to previously described standards of grade
(21,25) (Fig.
4A). The mean grade of the groups injected with the PADI2
inhibitor was significantly lower than that of the control in both
Y79 and WERI-Rb-1-injected mice. This indicated that inhibition of
PADI2 suppressed tumor growth in vivo. In addition, tumors
of grade 5 did not occur in PADI2-inhibited eyes (Fig. 4B and C). Representative images of
H&E staining in each group also showed histological differences
caused by PADI2 inhibition (Fig. 4B and
C). After 4 weeks, tumors transfected with PADI2 shRNA were
evaluated using the same protocols (21,25),
and were compared with control mice (which were injected with Y79
cells) without PADI2 shRNA transfection. Tumors originating from
PADI2-depleted retinoblastoma cells showed attenuated growth,
similar to the results obtained with BB-Cl-amidine (Fig. 4D). Collectively, these data
demonstrated that PADI2 inhibition suppressed tumor growth in
retinoblastoma mouse models.
BB-Cl-amidine has a low-toxicity
profile
To assess its potential for clinical translation,
the toxicity profile of the PADI2 inhibitor BB-Cl-amidine was
investigated. Optomotor response measurement and
electroretinography were used to assess the optical function, while
H&E staining and TUNEL assay were used for histological
examination. In total, 3 mice were injected with BB-Cl-amidine in
one eye and PBS in the other eye for comparison. There was no
significant difference in optomotor response between the two
groups, indicating no definite toxic effects on visual function
(26) (Fig. 5A). Electroretinography was analyzed
using two representative points: i) The a-wave, which is the
initial negative deflection representing photoreceptor function,
and ii) the b-wave, which is the positive deflection representing
bipolar, amacrine and Muller cell functions (37). The mean of amplitudes of the a- and
b-waves showed no significant difference between the two groups,
which together indicated no toxicity in the functional aspects of
the retina (37) (Fig. 5B).
In agreement with previous results, there was no
difference in histological integrity between different groups
according to H&E staining (Fig. 5C
and D). TUNEL assay revealed similar results, with only three
to six TUNEL-positive cells, indicating the presence of only a few
apoptotic cells in both injection and control groups. These results
demonstrated that BB-Cl-amidine had a markedly low toxicity
profile, which supported its potential for clinical translation
(Fig. 5E and F). Collectively, the
current study revealed that RB1 deficiency upregulated PADI2
expression by E2F activation, and that PADI2 inhibition
significantly attenuated cancer cell growth via p-ATK inactivation,
which resulted in cancer cell death (Fig. 5G).
Discussion
Previous studies have reported that PADI2 is
upregulated in various cancer types and is involved in
tumorigenesis (17,20). Therefore, PADI2 is considered a
potential therapeutic target for cancer treatment. However, the
role of PADI2 in retinoblastoma has not been elucidated to date.
The present study determined that PADI2 functioned as an oncogenic
driver in the tumorigenesis of retinoblastoma in vitro and
in vivo. Since there are numerous binding sites for Sp1 in
the promoter of PADI2, and activated Sp1 increases the expression
of PADI2 in retinoblastoma (10),
it was confirmed in the current study that PADI2 was highly
expressed in representative retinoblastoma cell lines and samples
from patients with retinoblastoma. Since the expression of PADI2 is
low in human retinal pigment epithelium cells and PADI2 inhibition
has little effect on the viability of these cells, PADI2 has
clinical importance as a specific therapeutic target in
retinoblastoma.
The current study demonstrated that the modulation
of PADI2 occurred in two directions in retinoblastoma. First,
upregulation of PADI2 enhanced the growth of retinoblastoma. It was
observed that the proliferation of Y79 cells was suppressed, and
p-AKT was downregulated by treatment with BB-Cl-amidine, a potent
inhibitor of PADI2 (38). In
addition, it was confirmed that PADI2-knockdown Y79 cells exhibited
similar characteristics as cells subjected to treatment with
BB-Cl-amidine. It was first suggested that BB-Cl-amidine was a
selective inhibitor of PADI2 with an antitumor effect in
retinoblastoma. In a recent study, p-AKT was reported to be
involved in retinoblastoma proliferation by inactivating
methyltransferase-like 3, which plays a role in an epigenetic
modification of RNA and is associated with the development of
tumors (34). Therefore, further
studies on the involvement of specific epigenetic regulators or
downstream target genes affected by the axis of PADI2-AKT
activation are needed. Next, PADI2 inhibition was found to induce
cancer cell death in the present study. It was observed that PADI2
inactivation elevated cleaved PARP expression and apoptotic
signatures in retinoblastoma. These results suggested that PADI2
inhibition may be able to simultaneously control cell proliferation
and death, suggesting that it may be an important regulator of
retinoblastoma.
Retinoblastoma has been primarily regarded as a
genetic disease induced by mutations or deletions in the RB1
gene. Various treatments targeting RB1 have been explored,
but treatment limitations have not yet been overcome. Therefore, it
is imperative to consider epigenetic factors that are beyond the
limits of genetic factors. The current study showed that enzymatic
inhibition or ablation of PADI2 could be a crucial epigenetic
therapy for retinoblastoma. It is necessary to develop and optimize
a potent inhibitor of PADI2 or design a delivery method that can
selectively eliminate PADI2 using CRISPR/Cas9 in cancer tissues in
an attempt to overcome the limitations of the existing
treatments.
In conclusion, the present study demonstrated the
oncogenic function of PADI2 in retinoblastoma. PADI2 expression was
enhanced by activating the binding of Sp1 to free E2F. Treatment
with a selective inhibitor of PADI2 and knockdown of PADI2
expression led to suppression of cell proliferation via p-AKT
inactivation and cancer cell death in vitro. In vivo
experiments also showed that PADI2 inhibition significantly
weakened tumorigenic effects. These results provide fundamental
considerations for developing a novel therapeutic strategy for
retinoblastoma.
Supplementary Material
Supporting Data
Acknowledgements
Not applicable.
Funding
The present study was supported by the Basic Science Research
Program (grant nos. NRF-2020R1C1C1010489 and NRF-2022R1A2C1003768),
the National Research Foundation of Korea (funded by the Korean
government; grant no. 2022R1A2C2010940) and Korea University
Medical Center (grant no. K2210331).
Availability of data and materials
The datasets used and/or analyzed during the current
study are available from the corresponding author on reasonable
request.
Authors' contributions
SK and YKS participated in formal analysis,
investigation, data curation, methodology, writing of the original
draft of the manuscript, reviewing and editing of the article and
confirm the authenticity of all the raw data. CSC participated in
data curation and investigation. HJK participated in methodology,
writing, reviewing and editing the manuscript. SF participated in
methodology, reviewing and editing the manuscript. DHJ participated
in conceptualization, data curation, formal analysis, methodology,
writing of the original draft of the manuscript, and reviewing and
editing of the article. HK participated in conceptualization,
formal analysis, data curation, supervision, methodology, writing
of the original draft of the manuscript, and reviewing and editing
of the article. All authors read and approved the final
manuscript.
Ethics approval and consent to
participate
All animal experiments were performed with the
approval (approval no. SNU-220512-3) of the Institutional Research
Ethics Committee of Seoul National University College (Seoul,
Korea).
Patient consent for publication
Not applicable.
Competing interests
The authors declare that they have no competing
interests.
References
|
1
|
Dimaras H, Corson TW, Cobrinik D, White A,
Zhao J, Munier FL, Abramson DH, Shields CL and Chantada GL:
Retinoblastoma. Nat Rev Dis Primers. 1:150212015. View Article : Google Scholar : PubMed/NCBI
|
|
2
|
Giacinti C and Giordano A: RB and cell
cycle progression. Oncogene. 25:5220–5227. 2006. View Article : Google Scholar : PubMed/NCBI
|
|
3
|
Vermeulen K, Van Bockstaele DR and
Berneman ZN: The cell cycle: A review of regulation, deregulation
and therapeutic targets in cancer. Cell Prolif. 36:131–149. 2003.
View Article : Google Scholar : PubMed/NCBI
|
|
4
|
Park SJ, Woo SJ and Park KH: Incidence of
retinoblastoma and survival rate of retinoblastoma patients in
Korea using the Korean national cancer registry database
(1993–2010). Invest Ophthalmol Vis Sci. 55:2816–2821. 2014.
View Article : Google Scholar : PubMed/NCBI
|
|
5
|
Jung EH, Kim JH, Kim JY, Jo DH and Yu YS:
Outcomes of proton beam radiation therapy for retinoblastoma with
vitreous seeds. J Pediatr Hematol Oncol. 40:569–573. 2018.
View Article : Google Scholar : PubMed/NCBI
|
|
6
|
Moon J, Choi SH, Lee MJ, Jo DH, Park UC,
Yoon SO, Woo SJ and Oh JY: Ocular surface complications of local
anticancer drugs for treatment of ocular tumors. Ocul Surf.
19:16–30. 2021. View Article : Google Scholar : PubMed/NCBI
|
|
7
|
Karlseder J, Rotheneder H and
Wintersberger E: Interaction of Sp1 with the growth- and cell
cycle-regulated transcription factor E2F. Mol Cell Biol.
16:1659–1667. 1996. View Article : Google Scholar : PubMed/NCBI
|
|
8
|
Lin SY, Black AR, Kostic D, Pajovic S,
Hoover CN and Azizkhan JC: Cell cycle-regulated association of E2F1
and Sp1 is related to their functional interaction. Mol Cell Biol.
16:1668–1675. 1996. View Article : Google Scholar : PubMed/NCBI
|
|
9
|
Rotheneder H, Geymayer S and Haidweger E:
Transcription factors of the Sp1 family: Interaction with E2F and
regulation of the murine thymidine kinase promoter. J Mol Biol.
293:1005–1015. 1999. View Article : Google Scholar : PubMed/NCBI
|
|
10
|
Dong S, Kojima T, Shiraiwa M, Méchin MC,
Chavanas S, Serre G, Simon M, Kawada A and Takahara H: Regulation
of the expression of peptidylarginine deiminase type II gene
(PADI2) in human keratinocytes involves Sp1 and Sp3 transcription
factors. J Invest Dermatol. 124:1026–1033. 2005. View Article : Google Scholar : PubMed/NCBI
|
|
11
|
Nagai T, Matsueda Y, Tomita T, Yoshikawa H
and Hirohata S: The expression of mRNA for peptidylarginine
deiminase type 2 and type 4 in bone marrow CD34+ cells in
rheumatoid arthritis. Clin Exp Rheumatol. 36:248–253.
2018.PubMed/NCBI
|
|
12
|
Ishigami A, Ohsawa T, Asaga H, Akiyama K,
Kuramoto M and Maruyama N: Human peptidylarginine deiminase type
II: Molecular cloning, gene organization, and expression in human
skin. Arch Biochem Biophys. 407:25–31. 2002. View Article : Google Scholar : PubMed/NCBI
|
|
13
|
Wang H, Xu B, Zhang X, Zheng Y, Zhao Y and
Chang X: PADI2 gene confers susceptibility to breast cancer and
plays tumorigenic role via ACSL4, BINC3 and CA9 signaling. Cancer
Cell Int. 16:612016. View Article : Google Scholar : PubMed/NCBI
|
|
14
|
Clancy KW, Russell AM, Subramanian V,
Nguyen H, Qian Y, Campbell RM and Thompson PR:
Citrullination/methylation crosstalk on histone H3 regulates
ER-target gene transcription. ACS Chem Biol. 12:1691–1702. 2017.
View Article : Google Scholar : PubMed/NCBI
|
|
15
|
Liu L, Zhang Z, Zhang G, Wang T, Ma Y and
Guo W: Down-regulation of PADI2 prevents proliferation and
epithelial-mesenchymal transition in ovarian cancer through
inhibiting JAK2/STAT3 pathway in vitro and in vivo, alone or in
combination with Olaparib. J Transl Med. 18:3572020. View Article : Google Scholar : PubMed/NCBI
|
|
16
|
Sharma P, Lioutas A, Fernandez-Fuentes N,
Quilez J, Carbonell-Caballero J, Wright RHG, Vona CD, Dily FL,
Schüller R, Eick D, et al: Arginine citrullination at the
C-terminal domain controls RNA polymerase II transcription. Mol
Cell. 73:84–96. e872019. View Article : Google Scholar : PubMed/NCBI
|
|
17
|
Wang L, Song G, Zhang X, Feng T, Pan J,
Chen W, Yang M, Bai X, Pang Y, Yu J, et al: PADI2-mediated
citrullination promotes prostate cancer progression. Cancer Res.
77:5755–5768. 2017. View Article : Google Scholar : PubMed/NCBI
|
|
18
|
Guertin MJ, Zhang X, Anguish L, Kim S,
Varticovski L, Lis JT, Hager GL and Coonrod SA: Targeted H3R26
deimination specifically facilitates estrogen receptor binding by
modifying nucleosome structure. PLoS Genet. 10:e10046132014.
View Article : Google Scholar : PubMed/NCBI
|
|
19
|
Horibata S, Rogers KE, Sadegh D, Anguish
LJ, McElwee JL, Shah P, Thompson PR and Coonrod SA: Role of
peptidylarginine deiminase 2 (PAD2) in mammary carcinoma cell
migration. BMC Cancer. 17:3782017. View Article : Google Scholar : PubMed/NCBI
|
|
20
|
Xue T, Liu X, Zhang M, Qiukai E, Liu S,
Zou M, Li Y, Ma Z, Han Y, Thompson P and Zhang X: PADI2-catalyzed
MEK1 citrullination activates ERK1/2 and promotes IGF2BP1-mediated
SOX2 mRNA stability in endometrial cancer. Adv Sci (Weinh).
8:20028312021. View Article : Google Scholar : PubMed/NCBI
|
|
21
|
Jo DH and Kim JH, Cho CS, Cho YL, Jun HO,
Yu YS, Min JK and Kim JH: STAT3 inhibition suppresses proliferation
of retinoblastoma through down-regulation of positive feedback loop
of STAT3/miR-17-92 clusters. Oncotarget. 5:11513–11525. 2014.
View Article : Google Scholar : PubMed/NCBI
|
|
22
|
Jo DH, Lee S, Bak E, Cho CS, Han YT, Kim
K, Suh YG and Kim JH: Antitumor activity of novel signal transducer
and activator of transcription 3 inhibitors on retinoblastoma. Mol
Pharmacol. 100:63–72. 2021. View Article : Google Scholar : PubMed/NCBI
|
|
23
|
Cho CS, Jo DH and Kim JH and Kim JH:
Establishment and characterization of carboplatin-resistant
retinoblastoma cell lines. Mol Cells. 45:729–737. 2022. View Article : Google Scholar : PubMed/NCBI
|
|
24
|
Khokhlova ON, Tukhovskaya EA, Kravchenko
IN, Sadovnikova ES, Pakhomova IA, Kalabina EA, Lobanov AV,
Shaykhutdinova ER, Ismailova AM and Murashev AN: Using
tiletamine-zolazepam-xylazine anesthesia compared to
CO(2)-inhalation for terminal clinical chemistry, hematology, and
coagulation analysis in mice. J Pharmacol Toxicol Methods.
84:11–19. 2017. View Article : Google Scholar : PubMed/NCBI
|
|
25
|
Jo DH, Lee K and Kim JH, Jun HO, Kim Y,
Cho YL, Yu YS, Min JK and Kim JH: L1 increases adhesion-mediated
proliferation and chemoresistance of retinoblastoma. Oncotarget.
8:15441–15452. 2017. View Article : Google Scholar : PubMed/NCBI
|
|
26
|
Jang H, Jo DH, Cho CS, Shin JH, Seo JH, Yu
G, Gopalappa R, Kim D, Cho SR, Kim JH and Kim HH: Application of
prime editing to the correction of mutations and phenotypes in
adult mice with liver and eye diseases. Nat Biomed Eng. 6:181–194.
2022. View Article : Google Scholar : PubMed/NCBI
|
|
27
|
Xu H, Koch P, Chen M, Lau A, Reid DM and
Forrester JV: A clinical grading system for retinal inflammation in
the chronic model of experimental autoimmune uveoretinitis using
digital fundus images. Exp Eye Res. 87:319–326. 2008. View Article : Google Scholar : PubMed/NCBI
|
|
28
|
Chen M, Copland DA, Zhao J, Liu J,
Forrester JV, Dick AD and Xu H: Persistent inflammation subverts
thrombospondin-1-induced regulation of retinal angiogenesis and is
driven by CCR2 ligation. Am J Pathol. 180:235–245. 2012. View Article : Google Scholar : PubMed/NCBI
|
|
29
|
Testa JR and Bellacosa A: AKT plays a
central role in tumorigenesis. Proc Natl Acad Sci USA.
98:10983–10985. 2001. View Article : Google Scholar : PubMed/NCBI
|
|
30
|
Liu W, Bagaitkar J and Watabe K: Roles of
AKT signal in breast cancer. Front Biosci. 12:4011–4019. 2007.
View Article : Google Scholar : PubMed/NCBI
|
|
31
|
Shukla S, Maclennan GT, Hartman DJ, Fu P,
Resnick MI and Gupta S: Activation of PI3K-Akt signaling pathway
promotes prostate cancer cell invasion. Int J Cancer.
121:1424–1432. 2007. View Article : Google Scholar : PubMed/NCBI
|
|
32
|
Fu R, Yang P, Wu HL, Li ZW and Li ZY:
GRP78 secreted by colon cancer cells facilitates cell proliferation
via PI3K/Akt signaling. Asian Pac J Cancer Prev. 15:7245–7249.
2014. View Article : Google Scholar : PubMed/NCBI
|
|
33
|
Yan X, Wu S, Liu Q and Zhang J: RRS1
promotes retinoblastoma cell proliferation and invasion via
activating the AKT/mTOR signaling pathway. Biomed Res Int.
2020:24204372020. View Article : Google Scholar : PubMed/NCBI
|
|
34
|
Zhang H, Zhang P, Long C, Ma X, Huang H,
Kuang X, Du H, Tang H, Ling X and Ning J: m(6)A methyltransferase
METTL3 promotes retinoblastoma progression via PI3K/AKT/mTOR
pathway. J Cell Mol Med. 24:12368–12378. 2020. View Article : Google Scholar : PubMed/NCBI
|
|
35
|
Bao XY, Sun M, Peng TT and Han DM: TRIB3
promotes proliferation, migration, and invasion of retinoblastoma
cells by activating the AKT/mTOR signaling pathway. Cancer Biomark.
31:307–315. 2021. View Article : Google Scholar : PubMed/NCBI
|
|
36
|
Diefenbach J and Bürkle A: Introduction to
poly(ADP-ribose) metabolism. Cell Mol Life Sci. 62:721–730. 2005.
View Article : Google Scholar : PubMed/NCBI
|
|
37
|
Creel DJ: Electroretinograms. Handb Clin
Neurol. 160:481–493. 2019. View Article : Google Scholar : PubMed/NCBI
|
|
38
|
Monreal MT, Rebak AS, Massarenti L, Mondal
S, Šenolt L, Ødum N, Nielsen ML, Thompson PR, Nielsen CH and
Damgaard D: Applicability of small-molecule inhibitors in the study
of peptidyl arginine deiminase 2 (PAD2) and PAD4. Front Immunol.
12:7162502021. View Article : Google Scholar : PubMed/NCBI
|


