Introduction
Peripheral nerve repair is one of the challenges of
clinical practice. Most patients prefer the use of autologous nerve
grafts to repair peripheral nerve defects. However, available nerve
sources for autologous transplantation are limited. Immune
rejection from the use of other nerves has not been effectively
addressed as well. After discontinuation of immunosuppressive
agents, heterogeneous nerve-transplanted Schwann cells exhibit
rejection. Subsequent studies have confirmed the immunogenicity of
Schwann cells (1), which show
transplant immune rejection (2,3).
Cell factors are the most important components of allogeneic
nerve-transplanted antigens, followed by the myelin sheath; the
levels of antigens of the collagen and extracellular matrix,
including Schwann cell basal lamina, are very low (4). Schwann cells are antigen-presenting
cells, which have the ability to synthesize, transfer and express
major histocompatibility complex class II (MHC II) antigens and
release cytokines (e.g., IL-2). Cytokines are essential materials
that induce T cells to differentiate. Many Schwann cell surfaces
in vivo can express MHC II, which also supports this theory
(5–7).
When adult Schwann cells are co-cultured with
sensitive T cells, they express MHC II antigens; this indicates
that cultured adult Schwann cells handle and process the integrity
antigen and the antigen presented to T lymphocytes (8). MHC II expression mainly occurs on the
cell membrane and in Schwann cells, which confirms that Schwann
cells are antigen-presenting cells. Experimental evidence also
shows that peripheral nerve Schwann cells are the main
antigen-presenting cells (9–12).
The allogeneic nerve transplanted in endothelial cells and
macrophages are also antigen-presenting cells (13). A certain amount of MHC II
expression is present in endothelial cells subjected to immune
rejection (14). Immune effector
cells and immune molecules act on endothelial cells (15).
When chemical digestion is used to treat allogeneic
nerve grafts (16), the main
histocompatibility complex antigens within the aforementioned
neural stem and the myelin sheath can be effectively removed,
greatly reducing immunogenicity and preventing rejection.
Simultaneously, the neural tube membrane and the lamellar structure
are retained, providing a good networks for nerve fiber
regeneration.
Although allograft nerves are generally considered
significantly less antigenic after chemical treatment,
corresponding system studies have been not reported. To confirm the
safety of the clinical application and the feasibility of the
method, T-lymphocyte subsets were studied after chemically
extracted allograft nerve grafts were transplanted, as well as
changes in activated T cells and cytokine expression to obtain an
immunologic basis for clinical application.
Materials and methods
Preparation of transplated nerves
A total of 16 healthy 6-week-old C57BL/6 mice
weighing 18–22 g were purchased from the Experimental Animal Center
of PLA General Hospital. The sciatic nerve, 0.3 mm in diameter and
1.2 cm long, was bilaterally harvested from the mice. Using the
improved Sondell method (17) for
nerve chemical extraction, the donor nerve was treated by a
chemical extraction process, and then placed in sterile
phosphate-buffered saline solution and stored at 4˚C.
Animal models
Up to 128 healthy 6-week-old BALB/C mice (provided
by the Experimental Animal Center of PLA General Hospital) weighing
18–22 g were randomly divided into 4 groups (n=32) as follows: NC,
sham operation group (negative control group); AG, fresh autograft
group; FN, fresh allogeneic nerve group; and CEN, chemically
extracted acellular allogeneic nerve group. The mouse femoral nerve
that corresponds to each group was embedded within the muscle gap.
The sham operation group served as the control. In the AG group,
fresh sciatic nerves 0.3 mm in diameter and 1.2 cm long that were
harvested and cut on the operation day from the BALB/c mice were
transplanted. Fresh sciatic nerves from the C57BL/6 mice, 0.3 mm in
diameter and 1.2 cm long, were transplanted in the FN group.
Chemically pretreated C57BL/6 mouse sciatic nerves were
transplanted in the CEN group. Sixteen 6-week-old BALB/c mice and
16 C57BL/6 mice served as the corresponding donors for the nerve
transplants of the AG and the FN group. The mice were randomly
assigned and the nerves were transplanted within 1 day.
Experimental index
The animals were sacrificed after 3, 7, 14 and 28
days. The mice in each group were sacrificed by cervical
dislocation at each time point (4 groups at each time point, all 32
mice) and then soaked in 75% ethanol for 5 min. The spleen was
cleaned, placed in a Petri dish and washed with normal saline (NS;
0.9% saline solution). Up to 5 ml of NS was added to each Petri
dish and a 200-mesh stainless steel sieve was subsequently
immersed. The spleens of the mice were placed on the steel sieve
and then ground with the plunger of a 5-ml syringe. The spleen cell
suspension was placed in a 50-ml glass centrifuge tube and
centrifuged at 1500 rpm for 8 min. The supernatant was aspirated,
the sediment was loosened, and then, 20 ml of injection water was
added and mixed rapidly for 15 min. This was followed by 2 ml of
10% sodium chloride solution, and mixed with small amounts of 0.9%
NS. The mixture was centrifuged at 1,500 rpm for 8 min. The
resulting pellet was then rinsed with 0.9% NS and then centrifuged
for another 8 min. A small amount of lymphocyte suspension was
taken from the cell suspension liquid, dyed with trypan blue,
placed on a plate and counted. Based on the count of each tube, the
extracted cell suspension was added to each tube to adjust the
lymphocytes to 1×10⁶/tube. Each Eppendorf tube was
marked and then centrifuged at 3,000 rpm for 3 min.
Fluorescence-labeled antibodies (5 μl each tube; CD3, CD4, CD8,
CD25, IL-2, IFN-γ, TNF-α monoclonal antibodies) were added to the
corresponding labeled Eppendorf tubes and were mixed thoroughly;
one was left as the negative control. Each tube was placed in the
dark at 4˚C for 30 min. The excess fluorescent antibodies were then
washed and the solution was fixed with 2% paraformaldehyde for flow
cytometry. Up to 10,000 lymphocytes were counted in each labeled
Eppendorf tube. The T cell subsets, activated T cells and the
percentage of lymphocytes expressing IL-2, IFN-γ and TNF-α were
analyzed with CellQuest™ software.
Statistical analysis
The data were analyzed using Stata7.0 statistical
software for single-factor ANOVA. Pairwise comparison between each
group was analyzed by the paired t-test, and mean ± SD represents
the average value. P<0.05 was considered statistically
significant.
Results
General data
Three mice died because of anesthesia, as well as
intra-operative and post-operative bleeding during the experiments.
The others survived. The mice gained consciousness 0.5–2.0 h after
the operation. They were less active and exhibited poor feeding
within 24–48 h. The surgical site of the mice swelled within 36–48
h after the surgery, but no bleeding wounds and exudates were
present and all the mice regained their normal gait after 3
days.
Activation of cell subsets and T
cells
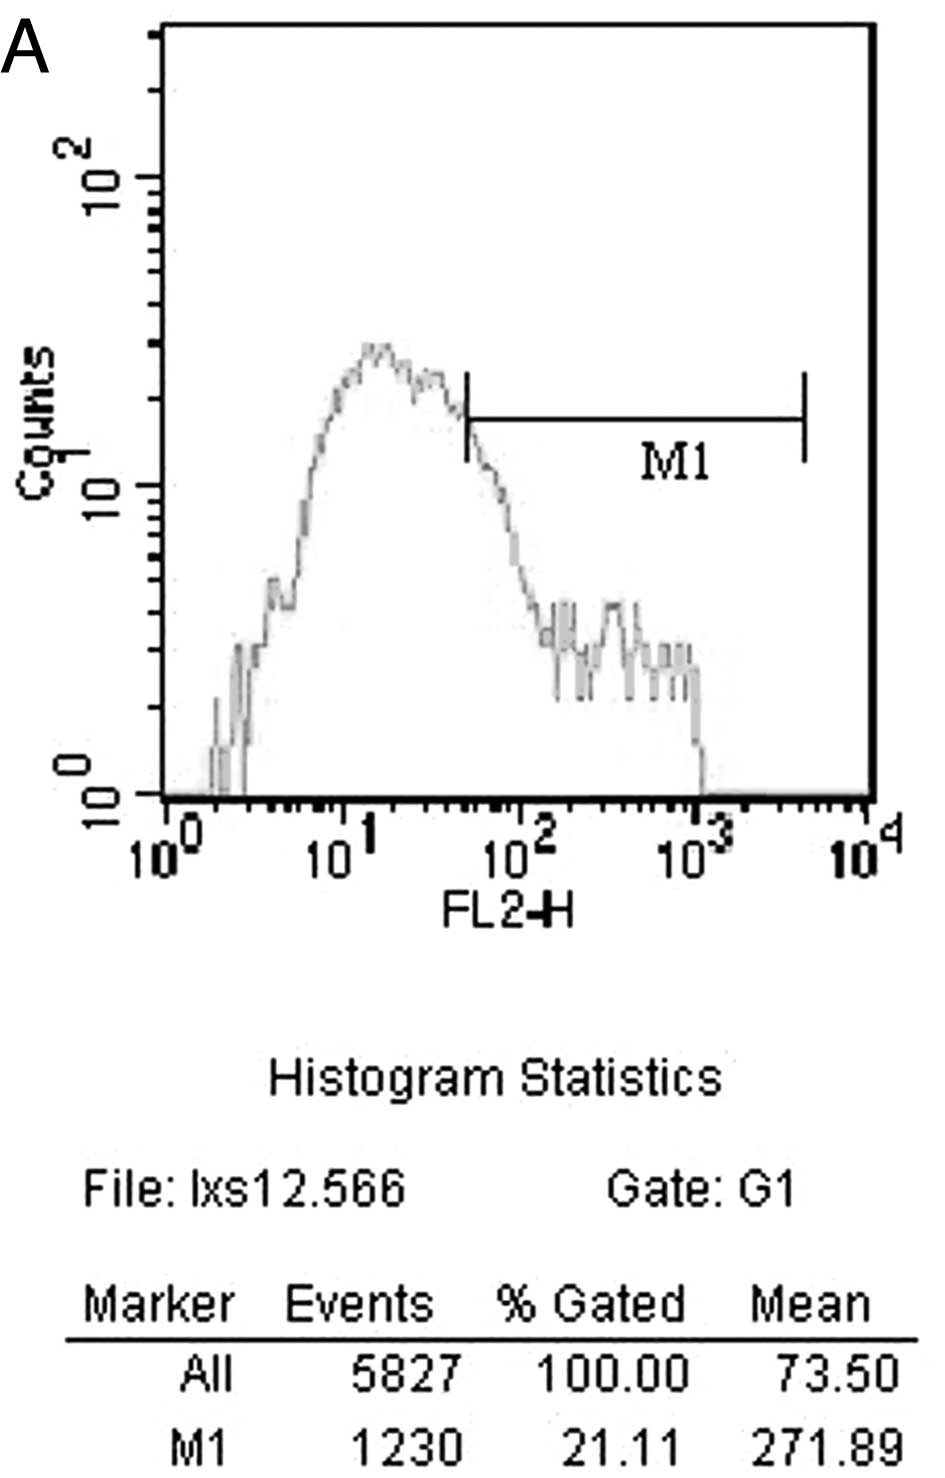
The percentages of T lymphocyte subsets and
activated T lymphocytes detected by flow cytometry at different
time points are shown in Tables
I–IV. The counts of
CD25+ T lymphocytes 14 days after surgery by flow
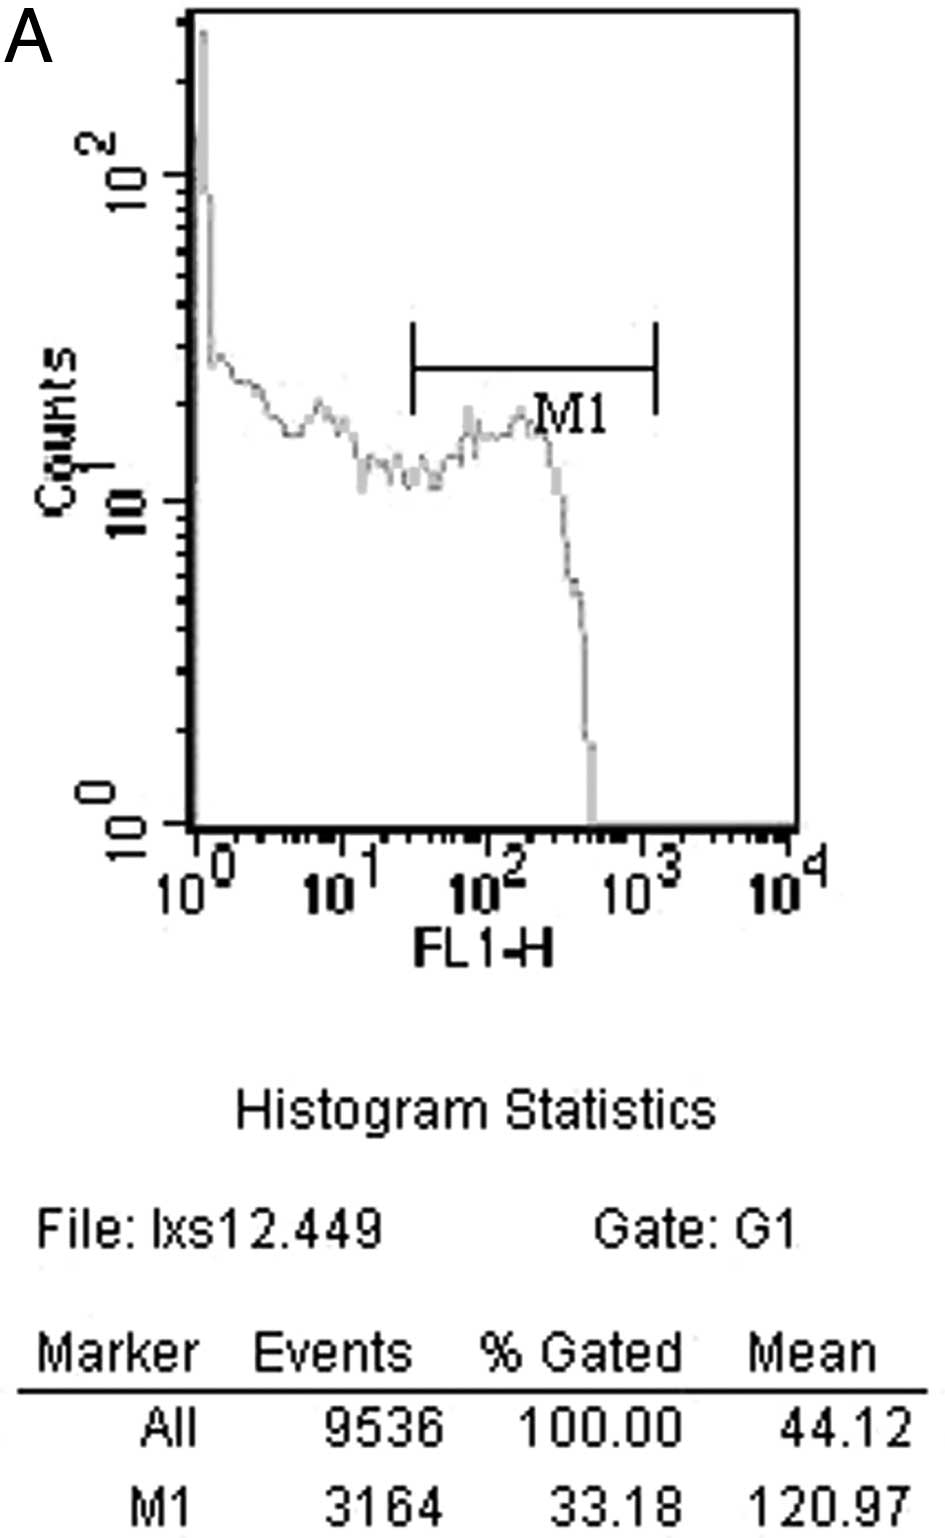
cytometry in the CEN group is shown in Fig. 1A. The FN group is shown in Fig. 1B. The counts of CD3+ T
lymphocytes 14 days after surgery by flow cytometry in the CEN
group is shown in Fig. 2A. The FN
group is shown in Fig. 2B.
 | Table IComparison of T lymphocytes and
activated T lymphocytes 3 days after surgery in all the
experimental groups. |
Table I
Comparison of T lymphocytes and
activated T lymphocytes 3 days after surgery in all the
experimental groups.
| NC | AG | FN | CEN | F-value | P-value |
|---|
| CD3+
(%) | 70.22±3.24 | 69.55±2.34 | 70.79±3.62 | 70.25±2.35 | 0.44 | 0.82 |
| CD4+
(%) | 40.23±1.85 | 38.89±2.93 | 40.47±2.40 | 40.15±2.42 | 1.03 | 0.41 |
| CD8+
(%) | 20.31±3.54 | 21.61±1.92 | 22.03±1.78 | 21.75±2.33 | 0.66 | 0.66 |
| CD25+
(%) | 3.19±0.87 | 3.46±0.85 | 3.22±0.98 | 3.34±0.77 | 0.22 | 0.95 |
| Table IVComparison of T lymphocytes and
activated T lymphocytes 28 days after surgery in all the
experimental groups. |
Table IV
Comparison of T lymphocytes and
activated T lymphocytes 28 days after surgery in all the
experimental groups.
| NC | AG | FN | CEN | F-value | P-value |
|---|
| CD3+
(%) | 63.12±3.25 | 63.56±3.42 | 69.31±1.91a–c | 64.06±2.09 | 10.64 | <0.01 |
| CD4+
(%) | 33.42±3.11 | 33.73±2.90 | 40.92±3.22d–f | 33.95±3.26 | 11.44 | <0.01 |
| CD8+
(%) | 15.27±1.92 | 14.05±2.14 | 16.44±1.28 | 15.53±2.14 | 8.92 | <0.01 |
| CD25+
(%) | 3.83±1.32 | 3.87±1.15 | 8.30±0.98g–i | 5.00±1.47 | 23.83 | <0.01 |
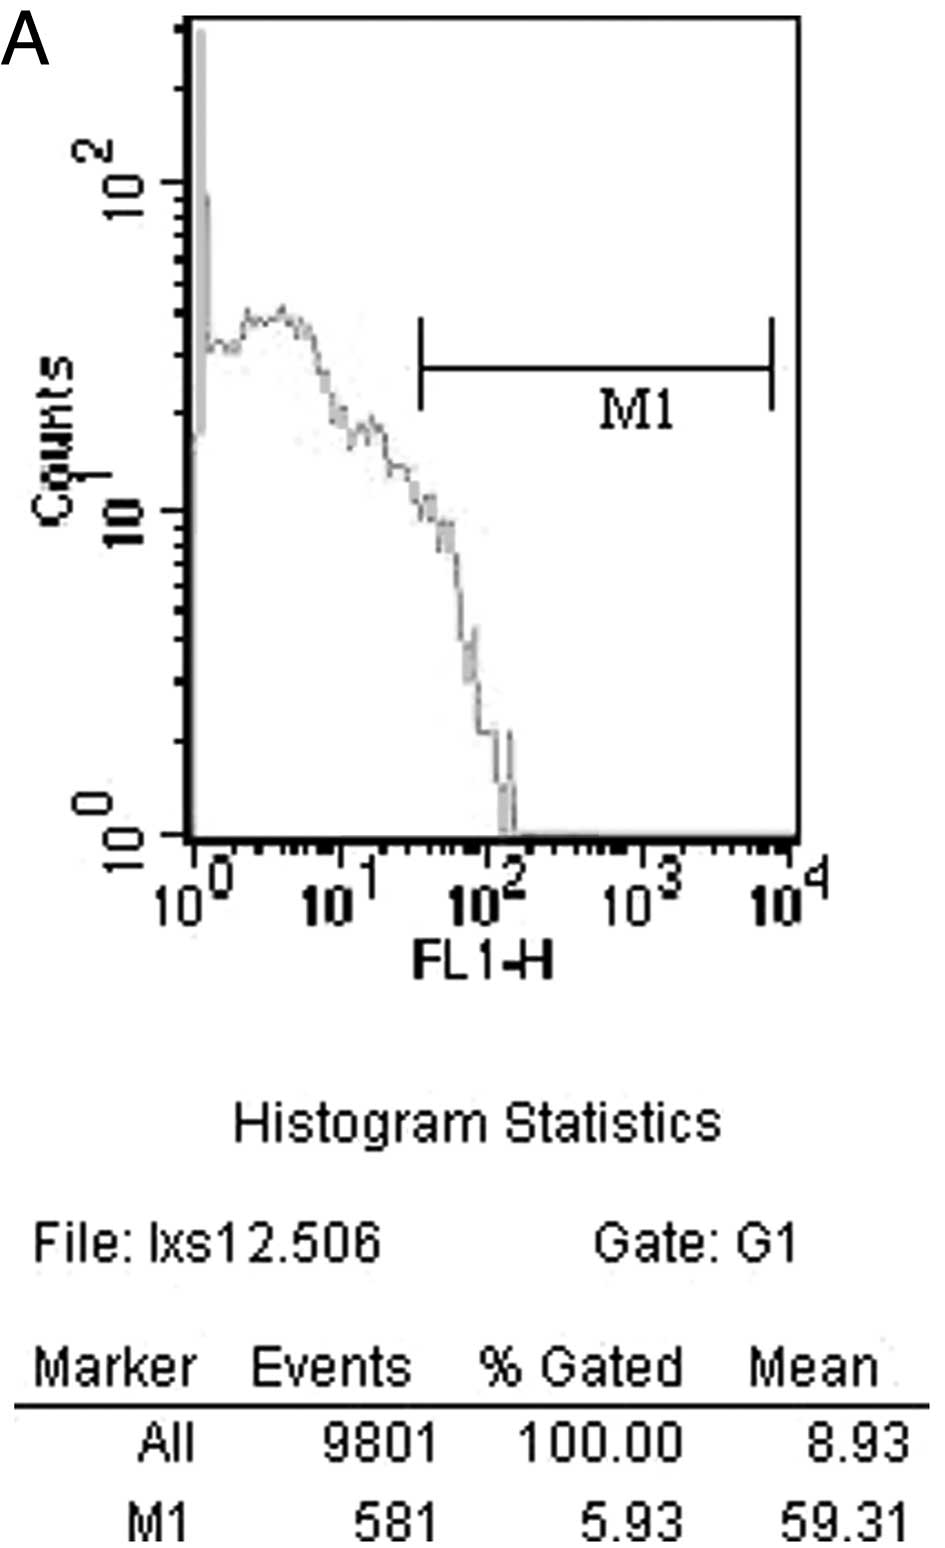
Intracellular cytokines
The intracellular cytokine expression levels
detected by flow cytometry at various time points are shown in
Tables V–VIII. The counts of cells expressing
IFN-γ 14 days after surgery by flow cytometry in the CEN group is
shown in Fig. 3A. The FN group is
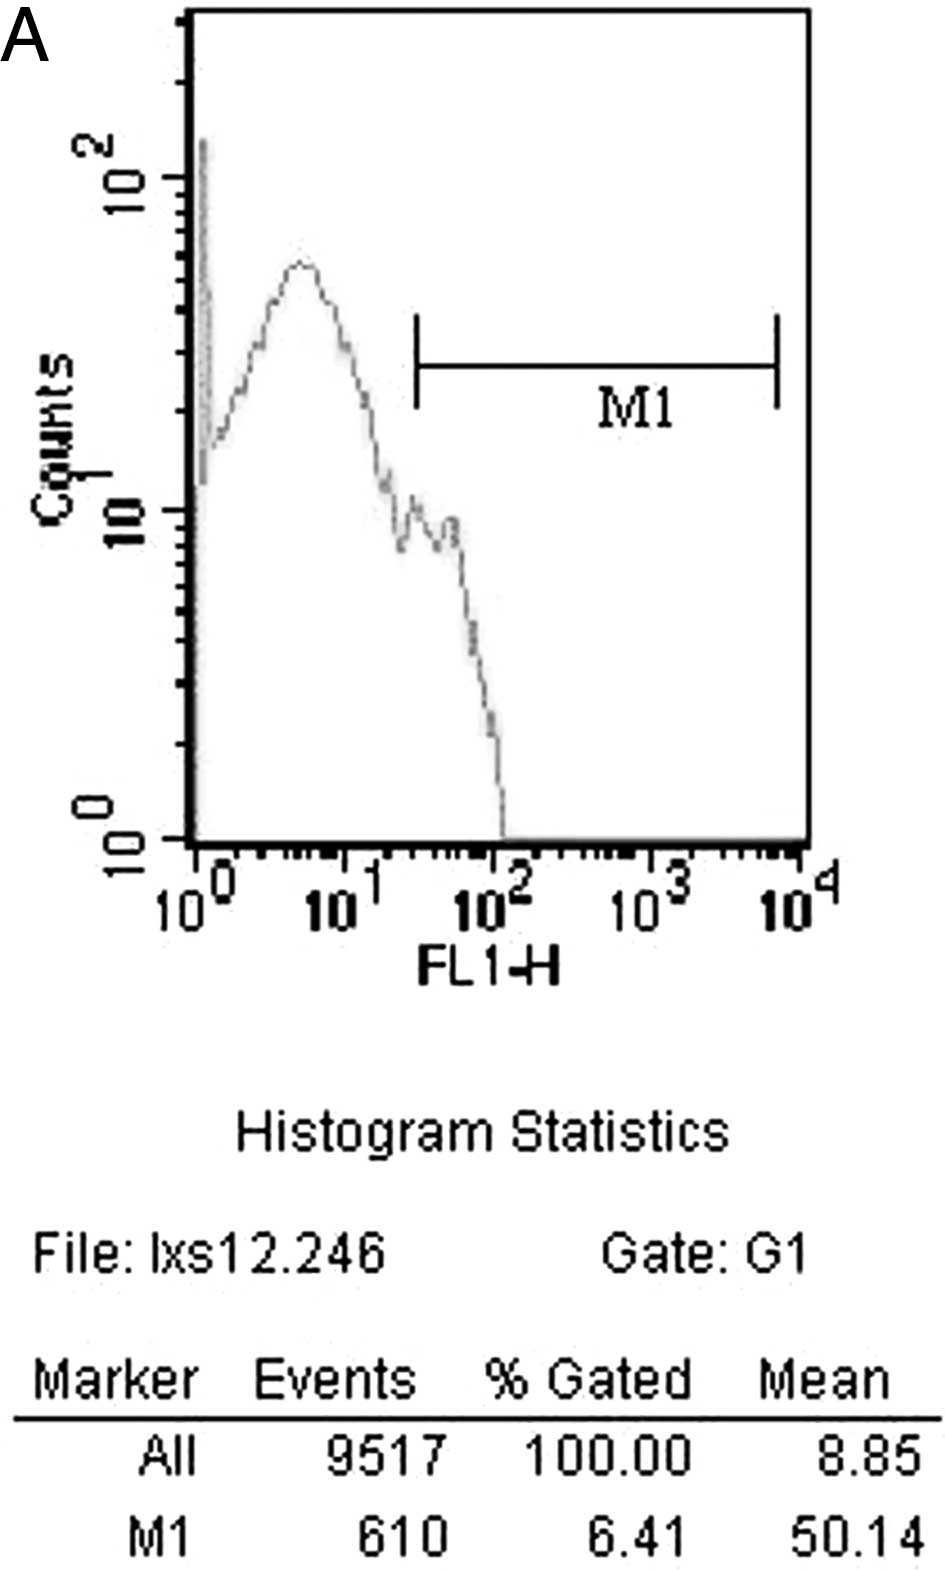
shown in Fig. 3B. The counts of
cells expressing IL-2 14 days after surgery by flow cytometry in
the CEN group is shown in Fig. 4A.
FN group is shown in Fig. 4B.
| Table VComparison of intracellular cytokine
expression in all experimental groups 3 days after surgery. |
Table V
Comparison of intracellular cytokine
expression in all experimental groups 3 days after surgery.
| NC | AG | FN | CEN | F-value | P-value |
|---|
| IL-2 (%) | 10.08±2.59 | 9.88±1.82 | 10.62±2.40 | 12.00±2.03 | 0.93 | 0.47 |
| IFN-γ (%) | 15.61±2.96 | 16.70±2.29 | 16.03±1.86 | 16.45±2.83 | 0.33 | 0.89 |
| TNF-α (%) | 9.89±1.61 | 10.86±2.59 | 11.74±2.56 | 10.89±1.95 | 0.75 | 0.59 |
| Table VIIIComparison of intracellular cytokine
expression in all experimental groups 28 days after surgery. |
Table VIII
Comparison of intracellular cytokine
expression in all experimental groups 28 days after surgery.
| NC | AG | FN | CEN | F-value | P-value |
|---|
| IL-2 (%) | 12.45±2.49 | 11.96±1.55 | 16.69±2.60a–c | 12.71±1.40 | 10.82 | <0.01 |
| IFN-γ (%) | 14.98±1.48 | 14.61±0.94 | 17.91±1.70d–f | 14.04±1.59 | 12.44 | <0.01 |
| TNF-α (%) | 11.50±1.46 | 12.29±2.44 | 10.96±1.44 | 11.62±1.58 | 1.14 | 0.36 |
Discussion
Changes and cell types in lymphocyte subsets in the
body as well as cytokine levels reflect the immune status of
transplant rejection and are sensitive indicators. In the body, MHC
II antigens on the surface of most nucleated cells have been
identified as CD8+. The MHC II antigen expressed in B
lymphocytes, monocytes, macrophages, dendritic cells and vascular
endothelial and ductal epithelial cells, which are T lymphocyte
antigen-presenting cells have been identified as CD4+ T
cells. All mature T cell surfaces express the CD3+
antigen. The ability of T cells to recognize foreign antigens
depends mainly on the T cell receptor, CD25+ (soluble
interleukin-2 receptor α chain), the activated T cell antigen,
which is a sensitive indicator for transplant rejection (18).
Acute rejection generally occurs within one week to
six months after transplantation. The main form of immune response
in allogeneic nerve transplants is cell-mediated immunity. Through
direct or indirect activation of helper T cells, foreign antigens
secrete cytokine IL-2 to activate CTL. IFN-γ activates monocytes,
whereas IL-1, IL-2 and IL-4 activate B cells into plasma cells to
produce specific antibodies and then attack the target cells,
tissues and organs (4), which
causes vascular endothelial cell damage. A series of intracellular
cytokines (such as IL-2 and IFN-γ) released by helper T cells may
reflect the immune status and transplant rejection (19). Sander et al established a
detection method for intracellular cytokines at the single-cell
level using paraformaldehyde saponin penetration after the use of
indirect immunofluorescence (20).
In this experiment, CD3+, CD4+
and CD8+ T cells in the chemically extracted peripheral
nerve transplant cells (CEN group) showed no significant change by
flow cytometry at 3–14 days and at 28 days after transplantation;
similar to the sham operated group, the CD3+,
CD4+ and CD8+ expression rate in the
autologous nerve transplant (AG) group tended to decrease. In
contrast, CD25+ expression at each time point from 3 to
28 days increased slightly. However, the CD3+,
CD4+, CD8+ and CD25+ expression at
all time points showed no significant difference compared with the
sham operated group and the autologous nerve transplanted (AG)
group. In the fresh nerve transplanted (FN) group, the T cell
expression rates of CD3+, CD4+ and
CD8+ at 3–14 days were significantly higher, which
peaked at day 7 and decreased at 28 days.
The number of CD25+ T cells increased at
all time points from 3 to 28 days and reached a peak at day 14. In
the fresh nerve transplanted (FN) group, except for the
CD8+ T cells, the rate during the period of 14–28 days
was statistically significant (P<0.05) and the difference in the
remaining indicators compared with the sham operation group and the
autologous nerve transplanted (AG) group were statistically
significant (P<0.01). Differences in the CD25+ T cell
detection rate were statistically significant (P<0.01) between
the fresh nerve transplanted (FN) group and the other three groups
from 14 to 28 days. After the allogeneic peripheral nerves were
treated by chemical extraction, the number of cells positive for
IL-2, IFN-γ and TNF-α in the sham operation group and the
autologous nerve transplanted (AG) group tended to increase, as
shown by flow cytometry during the period of 3–14 days; a high
level was reached within 7 days and eventually decreased at 28
days. In the fresh nerve transplanted (FN) group at 14 days, the
IL-2 and IFN-γ expression rates were significantly higher
(P<0.05; P<0.01) than those of the sham operation group and
the autologous nerve transplanted (AG) group. At day 28, the IL-2
and IFN-γ expression rates were significantly higher in the FN
group (P<0.05; P<0.01) than those of the sham operation
group, the nerve autograft (AG) group and the chemical acellular
nerve allograft (CEN) group.
In conclusion, fresh peripheral nerve allograft
rejection after transplantation follows an acute course. Chemical
nerve extraction effectively removes the histocompatibility complex
cells and myelin in the major nerve trunk, thereby reducing its
immunogenicity and minimizing the risk of rejection. The use of
chemicals to treat the cells significantly reduces antigenicity.
Immunogenicity after the chemical treatment of the allogeneic nerve
cells is equal to or close to that of autologous nerves and
significantly lower than that of fresh nerve allografts. These
findings confirm the feasibility and safety of the chemical
extraction of peripheral nerve cells for clinical application.
References
|
1
|
AJ AguayoK MizunoGM BraySchwann cell
transplantation: evidence for a primary sheath cell disorder
causing hypomyelination in quaking miceJ Neuropath Exp
Neurol36595197710.1097/00005072-197705000-00031
|
|
2
|
AJ AguayoGM BrayJ KasarjianDifferences in
myelination of mouse axons by transplanted human and mouse Schwann
cellsNeurology283561978
|
|
3
|
AJ AguayoGM BraySC PerkinsAxon-Schwann
cell relationships in neuropathies of mutant miceAnn NY Acad
Sci317512531197910.1111/j.1749-6632.1979.tb37386.x289329
|
|
4
|
PJ EvansR MidhaSE MackinnonThe peripheral
nerve allograft: a comprehensive review of regeneration and
neuroimmunologyProg
Neurobiol43187233199410.1016/0301-0082(94)90001-97816927
|
|
5
|
ME EsiriMC ReadingMacrophages, lymphocytes
and major histocompatibility complex class II antigens in adult
human sensory and sympathetic
gangliaNeurology2318719319892754017
|
|
6
|
E ScarpiniRP LisakS BerettaQuantitative
assessment of class II molecules in normal and pathological
nervesBrain113659675199010.1093/brain/113.3.6592163718
|
|
7
|
T TrumbleJ StanislawImmunology of
peripheral nerves and response to traumaJ Orthop
Res9367373199110.1002/jor.11000903082010840
|
|
8
|
K BergsteinsdottirA KingstonKR IessenRat
Schwann cells can be induced to express major histocompatibility
complex class II molecules in vivoJ
Neurocytol21382390199210.1007/BF011917061607881
|
|
9
|
YL ColsonBH MarkusA ZeeviRJ
DuquesnoyIncreased lymphocyte adherence to human arterial
endothelial cell monolayers in the context of allorecognitionJ
Immunol1442975298419901691225
|
|
10
|
P HayryR RenkonenD LeszczynskiLocal events
in graft rejectionTransplant Proc213716372019892669283
|
|
11
|
ML RoseC PageC HengstenbergMH
YacoubIdentification of antigen presenting cells in normal and
transplanted human heart: importance of endothelial cellsHuman
Immunol28179185199010.1016/0198-8859(90)90017-J1972151
|
|
12
|
JP TurunenJ HalttunenP HäyryR
RenkonenLymphocytes bind to capillary endothelium during heart
allograft rejectionTransplant Proc2212619902309281
|
|
13
|
LT YuWF HickeyWS SilversD LaRossaAM
RostamiExpression of class II antigens on peripheral nerve
allograftsAnn NY Acad
Sci540472474198810.1111/j.1749-6632.1988.tb27139.x3207279
|
|
14
|
F LassnerE SchallerG SteinhoffCellular
mechanisms of rejection and regeneration in peripheral nerve
allograftsTransplantation48386392198910.1097/00007890-198909000-000062781604
|
|
15
|
JS PoberRS CotranThe role of endothelial
cells in
inflammationTransplantation50537544199010.1097/00007890-199010000-00001
|
|
16
|
M SondellG LundborgM KanjeRegeneration of
the rat sciatic nerve into allografts acellular through chemical
extractionBrain
Res7954454199810.1016/S0006-8993(98)00251-09622591
|
|
17
|
AJ AguayoSC PerkinsGM BrayPersistence of
abnormal myelination 4 months after transplantation of Schwann
cells from trembler to normal mouse nervesNeurology273771977
|
|
18
|
MC HorowitzGE FriedlaendImmunologic
aspects of bone transplantationOrthop Clin North
Am1822719872951639
|
|
19
|
T JungU SchauerC HeusserC NeumannC
RiegerDetection of intracellular cytokines by flow cytometryJ
Immunol Methods159197207199310.1016/0022-1759(93)90158-48445253
|
|
20
|
B SanderJ AnderssonU AnderssonAssessment
of cytokines by immunofluorescence and the paraformal
dehyde-saponin procedureImmunol
Rev1196593199110.1111/j.1600-065X.1991.tb00578.x2045123
|