Introduction
Insulin resistance has a fundamental role in the
development of obesity and type 2 diabetes mellitus (1,2).
Increased plasma levels of free fatty acids (FFA) are observed in
these conditions, and fat accumulation in skeletal muscle is
strongly associated with insulin resistance and a predisposition to
develop type 2 diabetes mellitus (3,4).
It has been reported that insulin responsiveness is
impaired in human and animal models submitted to lipid infusion or
a high-fat diet (5,6) and in isolated skeletal muscle cells
treated with FFA (2). Type 2
diabetic patients and their diabetes-prone first-degree relatives
are characterized by high levels of intramyocellular lipids (IMCL)
and muscular insulin resistance (7). On the contrary, endurance-trained
athletes, who are among the most insulin-sensitive subjects, are
additionally characterized by high IMCL levels (7,8),
indicating that high IMCL levels do not necessarily lead to insulin
resistance. Schrauwen et al (7) have previously hypothesized that the
increase in IMCL levels following endurance training served to
match the training-induced increase in oxidative capacity and
reliance on fat as a substrate during exercise, whereas the
increase in IMCL under obesogenic/diabetogenic conditions was due
to a surplus of fat availability (high plasma FFA levels, high fat
diets) and was not matched by an improved oxidative capacity. Under
the latter conditions, incomplete fat oxidation secondary to the
overload of the tricarboxylic acid cycle by β-oxidation of FFA
leads to the production of the intermediates of IMCL metabolism,
including fatty acyl-CoA, diacylglycerol and ceramides, which
accumulate and impede cellular insulin signaling (9). This indicates that mitochondrial
dysfunction, due to an inability to accommodate the increased fat
supply, may be an important event in the pathogenesis of
FFA-induced insulin resistance.
However, the cellular mechanisms of the FFA-induced
mitochondrial dysfunction and insulin resistance of skeletal muscle
cells remain largely unknown. MicroRNAs (MiRs) represent a class of
small, non-coding RNAs widely expressed in all multicellular
organisms that regulate gene expression post-transcriptionally
(10). Regulatory functions have
been described for miRs in all tissues directly targeted by
insulin, including brain, skeletal muscle, adipose and liver
tissues (11,12). Recent studies have shown that
miR-106b is highly expressed in the skeletal muscle of diabetes
patients (13) and of mice with
insulin resistance induced by a 12-week high fat diet (14). In a previous study, miR-106b was
discovered to induce mitochondrial dysfunction and insulin
resistance in C2C12 myotubes by targeting mitofusin-2 (Mfn-2);
silencing miR-106b improved the tumor necrosis factor
(TNF)-α-induced insulin resistance and mitochondrial dysfunction in
skeletal muscle (15). In
addition, it was determined that miR-106b expression levels were
upregulated by palmitic acid (PA) in dose-dependent manner. In the
current study, the role of miR-106b in the mitochondrial function
and insulin sensitivity of skeletal myocytes was investigated under
PA treatment by silencing miR-106b in C2C12 myotubes.
Materials and methods
Antibodies
Primary mouse antibodies to Mfn2 and glucose
transporter 4 (GLUT4) were purchased from Abcam (Cambridge, MA,
USA). The primary rabbit polyclonal peroxisome proliferative
activated receptor γ coactivator (PGC)-1α antibody and
estrogen-related receptor (ERR)-α antibody were obtained from Santa
Cruz Biotechnology (Santa Cruz, CA, USA). Peroxidase-conjugated
AffiniPure goat anti-rabbit secondary antibodies were purchased
from Zhongshan Gold Bridge Biotechnology (Beijing, China).
Generation of stable cell lines with
miR-106b loss of function
The generation of stable cell lines with miR-106b
loss of function was performed as previously described (15). The miR-106b inhibitor (sponge) and
a scrambled control sequence were synthesized and inserted into a
LV2-pGLV lentiviral vector (GenePharma, Shanghai, China). The
resulting recombinant LV2-pGLV-miR-106b inhibitor sponge plasmid
and LV2-pGLV-control plasmid were confirmed by restriction
endonuclease analysis and DNA sequencing. Human Embryonic Kidney
(HEK)-293 cells (American Type Culture Collection, Manassas, VA,
USA) were cotransfected with LV2-pGLV-miR-106b (or
LV2-pGLV-control) and pLP1, pLP2 and pLP/VSVG packaging plasmids
(Invitrogen Life Technologies, Carlsbad, CA, USA). The supernatant
containing the lentiviral particles was harvested to determine the
virus titer and used to infect murine C2C12 myoblasts (American
Type Culture Collection, Manassas, VA, USA). The infected cells
were selected with puromycin (Sigma-Aldrich, St. Louis, MO, USA) to
obtain a stable cell line.
Cell culture and treatment
Mouse C2C12 myoblasts and HEK293 cells were
maintained at 37°C in Dulbecco’s modified Eagle’s medium (DMEM)
containing 10% fetal bovine serum (Wisent, St. Bruno, Quebec,
Canada). C2C12 cells were infected with the indicated lentivirus.
At 72 h post-infection, cells were visualized under a fluorescence
microscope (Olympus Corp., Tokyo, Japan) to observe the infection
efficiency and then selected in DMEM containing 2.5 μg/ml puromycin
for two weeks to obtain a stable cell line with miR-106b loss of
function. When the C2C12 cells reached confluence, the medium was
changed to differentiation medium containing DMEM and 2% horse
serum (Gibco-BRL, Carlsbad, CA, USA), which was changed every other
day. After five additional days, the differentiated C2C12 cells had
fused into myotubes. In our previous study, miR-106b expression
level was not altered during C2C12 myoblasts differentiation, and
the silencing of miR-106b did not affect C2C12 myoblast
differentiation (15). To induce
insulin resistance, C2C12 myotubes were serum starved for 4 h and
then transferred to DMEM containing 2% bovine serum albumin (BSA)
with or without PA (Sigma-Aldrich, St. Louis, MO, USA). No effect
of FFA on cell viability was observed under 100 μM or 200 μM PA
treatment for 24 h or 48 h.
2-Deoxyglucose uptake assay
2-Deoxy-D-[3H] glucose (CIC, Beijing, China)
uptake was assayed as previously described (16). Following 4 h of serum starvation in
DMEM, C2C12 myotubes were rinsed twice with
4-(2-hydroxyethyl)-1-piperazineethanesulfonic acid (HEPES)-buffered
saline (20 mM HEPES, 140 mM NaCl, 5 mM KCl, 2.5 mM
MgSO4, 1 mM CaCl2, pH 7.4) and stimulated
with 100 nM insulin (Peptide Institute, Osaka, Japan) for 30 min at
37°C. Glucose uptake was determined by the addition of 10 μM
2-deoxyglucose containing 0.2 μCi [3H]-2-deoxyglucose in
HEPES-buffered saline for 10 min. Ice-cold phosphate-buffered
saline (PBS; 8% glucose) was used to terminate the uptake of
[3H]-2-deoxyglucose, and the cells were immediately
washed three times with ice-cold PBS. Subsequently, the cells were
lysed with 0.25 N NaOH and the cell lysates were transferred to
scintillation vials (Beckman Coulter, Brea, CA, USA) in order to
measure the radioactivity using a liquid scintillation counter
(Beckman Ls6500; Beckman Coulter).
Adenosine triphosphate (ATP)
production
The ATP content of cells was measured with a
luciferase-based luminescence assay kit (Biyuntian, Nantong,
China). The cells were homogenized in an ice-cold ATP-releasing
buffer (Biyuntian). Using an ATP standard, ATP concentrations were
then determined with a VERITASTM microplate luminometer (Turner
Biosystems, Sunnyvale, CA, USA) and normalized to protein
concentrations.
Determination of intracellular reactive
oxygen species (ROS) generation
Intracellular ROS generation was assayed as
described previously (15). Cells
were washed twice with DMEM and then incubated in pre-warmed
dihydroethidium (5 μmol/l). After 30 min, the cells were washed
twice with DMEM, and fluorescence was immediately measured with a
plate reader using fluorescence assisted cell sorting (FACS,
excitation at 488 nm, emission at 525 nm; BD Biosciences, San Jose,
CA, USA). For flow cytometry, the cells were trypsinized and
centrifuged at 300 rpm at 4°C for 5 min, and then resuspended in
KRP-HEPES buffer (pH 7.4, 0.5% BSA). The cells were analyzed with a
FACScan flow cytometer using the CellQuest software (BD
Biosciences, San Jose, CA, USA). The fluorescence intensity
represented intracellular ROS levels.
Electron micrograph morphometry
The myocytes were collected following
trypsinization, dissected and fixed in a solution of 2.5%
glutaraldehyde, 1.25% paraformaldehyde and 0.03% picric acid in 0.1
M sodium cacodylate buffer (pH 7.4). The cells were washed in 0.1 M
cacodylate buffer, postfixed with 1% osmium tetroxide and 1.5%
potassium ferrocyanide for 1 h, washed in water and stained with 1%
aqueous uranyl acetate for 30 min, followed by dehydration in a
graded ethanol series (5 min in 75% ethanol, 5 min in 90% ethanol
and 5 min in 100% ethanol. The samples were subsequently embedded
in TAAB Epon (Marivac Canada Inc, St. Laurent, Canada). Ultrathin
sections (approximately 60 nm thick) were cut on a Reichert
Ultracut-S Microtome (Leica, Vienna, Austria), placed onto copper
grids and stained with uranyl acetate and lead citrate. The section
slides were observed and photographed (magnification, ×30,000)
under a JEOL 1200EX microscope (JEOL, Tokyo, Japan).
Quantitative polymerase chain reaction
(qPCR) detection of nuclear and mitochondrial DNA (mtDNA)
Relative amounts of nuclear DNA and mtDNA were
determined by qPCR. Briefly, DNA was isolated using a DNA
extraction kit (Baitaike, Beijing, China) and quantified by
spectrophotometry at 260 nm. Two primer sets were used for qPCR
analysis. A 110-bp mtDNA fragment within the cytochrome b
gene (CYTB) was used for quantification of mtDNA. A 291-bp region
of the nuclear gene for 28S ribosomal RNA (Rn28s1) was used to
normalize the results. qPCR was performed with an Applied
Biosystems 7500 Sequence Detection System (Applied Biosystems Life
Technologies, Foster City, CA, USA). The ratio of mtDNA to nuclear
DNA reflects the concentration of mitochondria per cell. The
sequences of primers and probes used (Shenggong, Shanghai, China)
are shown in Table I.
 | Table IOligonucleotide sequences for primer
sets used in quantitative polymerase chain reaction. |
Table I
Oligonucleotide sequences for primer
sets used in quantitative polymerase chain reaction.
| Gene | Sequence (5′-3′) |
|---|
| Rn28s1 |
| Forward: |
GGGCGGCCAAGCGTTCATAG |
| Reverse: |
AGGCGTTCAGTCATAATCCCACAG |
| Probe: |
TGGTAGCTTCGCCCCATTGGCTCCT |
| CYTB |
| Forward: |
TTTTATCTGCATCTGAGTTTAATCCTGT |
| Reverse: |
CCACTTCATCTTACCATTTATTATCGC |
| Probe: |
AGCAATCGTTCACCTCCTCTTCCTCCAC |
| PGC-1α |
| Forward: |
TCTGAAAGGGCCAAACAGAG |
| Reverse: |
GTAAATCACACGGCGCTCTT |
| Probe: | Roche probe
#34 |
| Mfn2 |
| Forward: |
CAGAGCAGAGCCAAACTGCT |
| Reverse: |
AACATGTTGAGTTCGCTGTCC |
| Probe: | Roche probe
#20 |
| ERR-α |
| Forward: |
ACCTCTGGCAGTAGCTGGAG |
| Reverse: |
AGCAGATGCGACACCAGAG |
| Probe: | Roche probe
#45 |
| GAPDH |
| Forward: |
AGCTTGTCATCAACGGGAAG |
| Reverse: |
TTTGATGTTAGTGGGGTCTCG |
| Probe: | Roche probe #9 |
Reverse transcription (RT)-qPCR
MiRs and total RNA from myotubes were extracted
using a miRNeasy Mini Kit (Qiagen, Valencia, CA, USA) and
TRIzol® reagent (Invitrogen Life Technologies). MiR-106b
cDNA was generated with a reverse transcription primer provided
with the TaqMan MicroRNA Reverse Transcription kit (Applied
Biosystems Life Technologies), and first strand of cDNA was
generated with random primers using a reverse transcription kit
from Roche (Basel, Switzerland). Quantitative analysis was
performed with an Applied Biosystems 7500 RT-PCR system using the
following conditions: initial denaturation for 10 min at 95°C,
followed by 40 cycles of 15 sec denaturation at 95°C, 30 sec
annealing at the optimal primer temperature 56°C and 36 sec
extension at 72°C. Each sample was assayed in duplicate. In
addition. negative controls (no template or selected untranscribed
RNA) were run to ensure the absence of contamination. Analysis was
performed using the 2−ΔΔCt method with U6 or GAPDH as
the reference gene. Specific primers for each gene were designed to
amplify a single product (Table
I).
Immunoblotting
Cells were washed with ice-cold PBS and lysed with
radioimmunoprecipitation assay lysis buffer (Beyotime Institute of
Biotechnology, Nantong, China) for 20 min on ice. Plasma membrane
proteins were extracted using the Eukaryotic Membrane Protein
Extraction Reagent (Pierce, Rockford, IL, USA). Protein levels were
quantified using the bicinchonic acid (BCA) protein assay kit
(Pierce Biotechnology, Inc., Rockford, IL, USA) in accordance with
the manufacturer’s instructions. Following separation by 10% sodium
dodecyl sulfate-polyacrylamide gel electrophoresis (SDS-PAGE),
proteins were transferred to nitrocellulose membranes (EMD
Millipore, Billerica, MA, USA). Membranes were blocked with 5% BSA
in tris buffered saline with Tween 20 (50 mM Tris, pH 7.5, 150 mM
NaCl, 0.05% Tween 20) and then incubated at 4°C overnight with one
of the primary antibodies, followed by incubation in the presence
of the secondary antibodies. The signals were detected using an
enhanced chemiluminescence kit (Amersham, Piscataway, NJ, USA).
Statistical analysis
Data are expressed as the mean ± standard deviation
of at least three independent experiments. Comparisons were made
using the analysis of variance for three parametric groups.
Student’s t-test was used for two parametric groups. P<0.05 was
considered to indicate a statistically significant difference.
Results
miR-106b expression is increased under PA
treatment and miR-106b loss of function improves insulin
sensitivity
Hyperlipidemia is hallmark of obesity and the
insulin-resistant state. The present study sought to determine the
expression pattern of miR-106b in cultured myotubes following PA
exposure. PA was revealed to rapidly induced miR-106b expression in
a dose-dependent manner (Fig. 1A).
Treatment with 200 μM PA did not alter glucose uptake from the
basal level, however, it did significantly reduce
insulin-stimulated glucose uptake by 60% (P<0.05). Although no
change in insulin sensitivity was observed at a concentration of
100 μM, PA significantly increased miR-106b expression (P<0.05),
and this effect was more prominent at the concentration of 200 μM
(Fig. 1A and B). It has been
confirmed that insulin-stimulated glucose uptake in skeletal muscle
cells is dependent on the translocation of the insulin-responsive
GLUT4 from intracellular storage compartments to the plasma
membrane. PA treatment at 200 μM for 24 h significantly reduced
insulin-stimulated GLUT4 transportation to the plasma membrane in
C2C12 myotubes compared with that in the untreated myotubes
(P<0.05) (Fig. 1C). Silencing
miR-106b significantly increased 2-deoxyglucose uptake and GLUT4
transportation under PA treatment (Fig. 1B and C) compared with that of the
controls (P<0.05). A previous study confirmed that miR-106b
targeted Mfn2 by luciferase assay, and that miR-106b downregulated
Mfn2 at the translational level in C2C12 myotubes (15). In the current study, it was
revealed that PA reduced the expression levels of Mfn2 mRNA and
protein in C2C12 myotubes, which was significantly attenuated by
miR-106b loss of function (Fig. 1D and
E) (P<0.05 at 100 μM and P<0.01 at 200 μM). These results
indicated that upregulation of miR-106b, which preceded a reduce in
insulin sensitivity, contributed to PA-induced insulin resistance,
while inhibition of miR-106b increased Mfn2 expression and improved
insulin sensitivity under PA treatment.
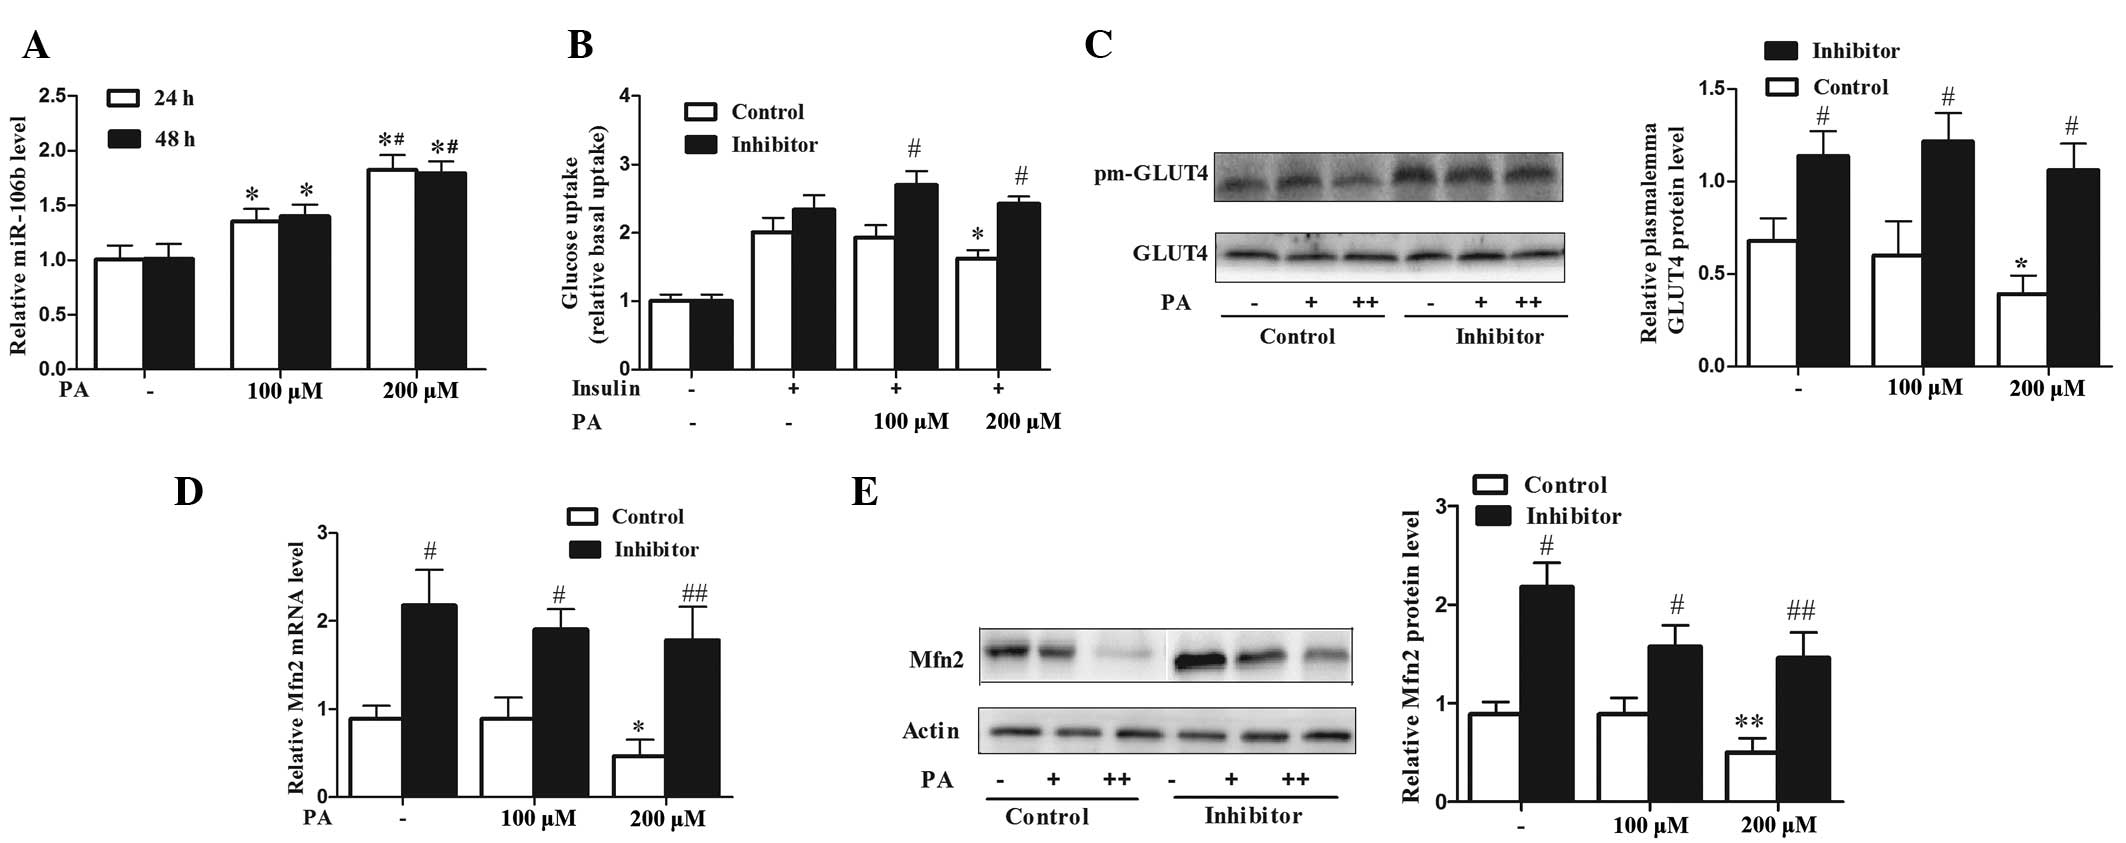 | Figure 1miR-106b expression is increased under
PA treatment and negatively correlates with insulin sensitivity and
Mfn2 expression. (A) PA upregulated the expression level of
miR-106b in a dose-dependent manner in C2C12 myotubes. Values
represent the mean ± SD from three independent experiments (n=3).
(B) Silencing of miR-106b improved insulin sensitivity under PA
treatment as assessed by the 2-deoxyglucose uptake assay. Values
represent the mean ± SD from three independent experiments (n=6).
(C) Silencing of miR-106b increased plasma membrane GLUT4 protein
level under PA treatment. Values represent the mean ± SD from three
independent experiments (n=3). (D and E) Silencing of miR-106b
increased Mfn2 expression under PA-induced insulin resistance (D,
Mfn2 mRNA; E, Mfn2 protein). Values represent the mean ± SD from
three independent experiments (n=3). *P<0.05 vs.
without PA treatment, **P<0.01 vs. without PA
treatment, #P<0.05 vs. control,
##P<0.01 vs. control. miR, microRNA; PA, palmitic
acid; SD, standard deviation; Mfn-2, mitofusin-2; GLUT4, glucose
transporter type 4. |
miR-106b loss of function improves
mitochondrial morphology and functions under PA-induced insulin
resistance
In the above mentioned experiments, miR-106b was
upregulated in parallel with the downregulation of Mfn2 by PA
treatment, and the silencing of miR-106b mitigated PA-induced
insulin resistance. Therefore, the current study explored whether
this function was dependent on improvement of mitochondrial
function. PA resulted in clear destruction of the mitochondrial
ultrastructure, with the mitochondria swollen, hollow and with
absent cristae (Fig. 2Ac and d).
The mitochondria were condensed (smaller and higher density) and
more fragmented compared with those without PA treatment. (Fig. 2Aa and b). MiR-106b loss of function
partly improved mitochondrial morphological lesions impaired by PA
(Fig. 2Ac and d). In addition, PA
reduced production of intracellular ATP (P<0.05 at 100uM and
P<0.01 at 200uM) and mtDNA (P<0.05 at 100 μM and P<0.01 at
200 μM) levels (Fig. 2B and C).
Furthermore, miR-106b loss of function increased ATP production
(P<0.05) and mtDNA levels (P<0.05 at 100 μM and P<0.01 at
200 μM) impaired by PA treatment (Fig.
2B and C). These data suggest that silencing of miR-106b
improved C2C12 myotubes insulin sensitivity via protection of
mitochondrial morphology and mitochondrial function.
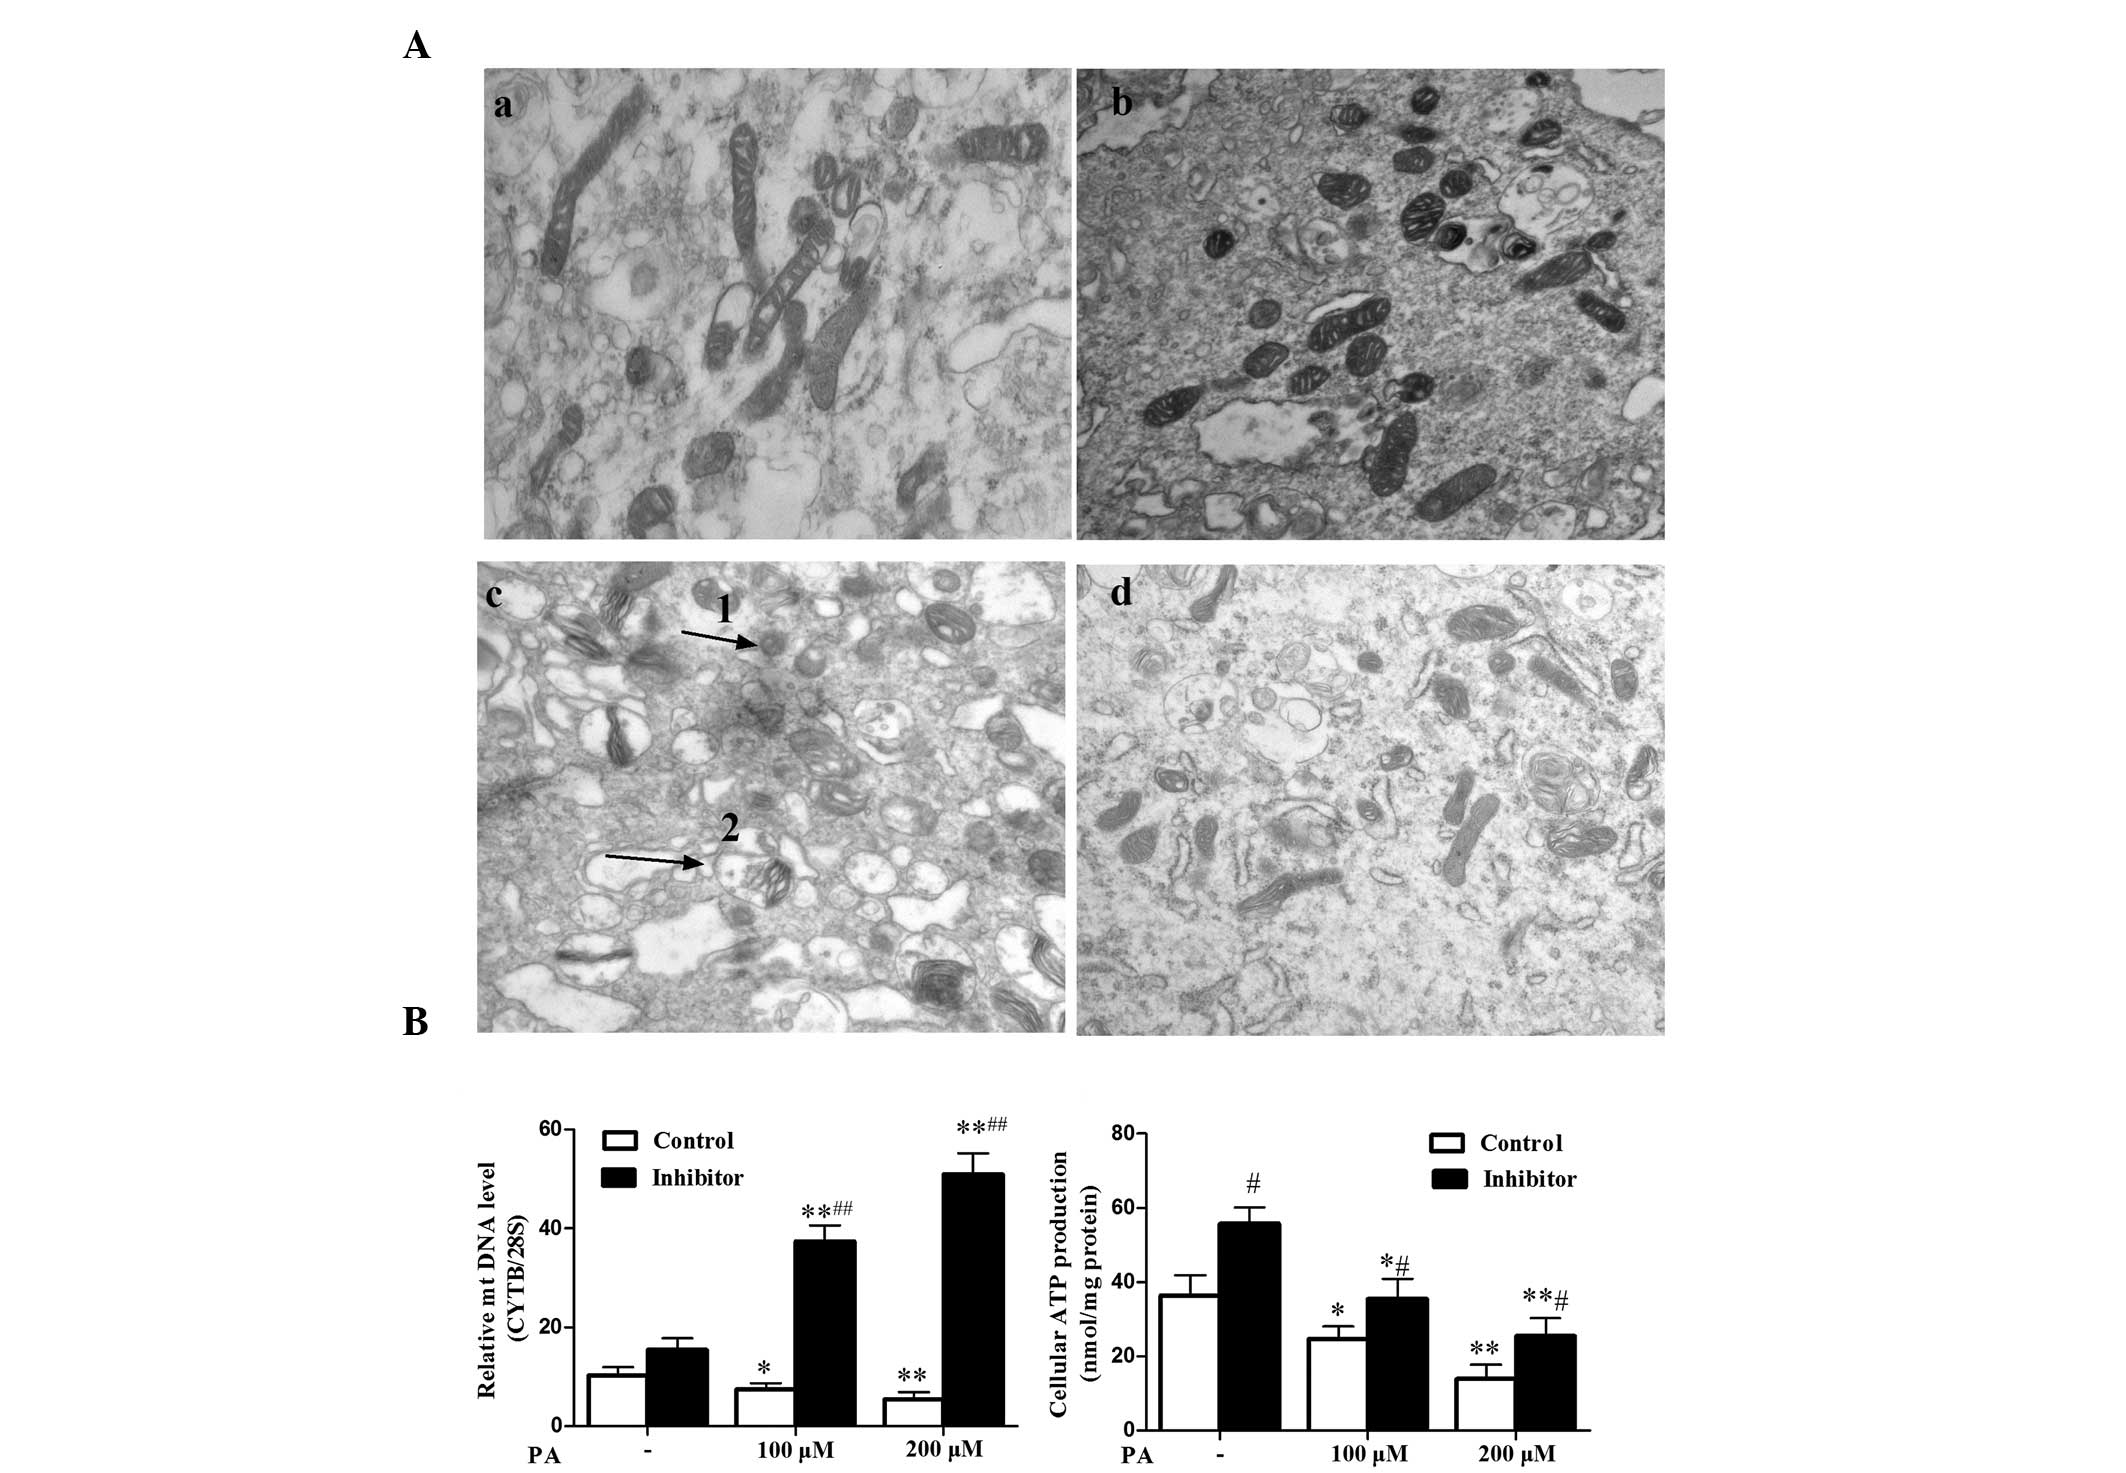 | Figure 2miR-106b loss of function improves
mitochondrial morphology and mitochondrial function. (A) Changes in
mitochondria morphological features of C2C12 myotubes following
treatment with 200 μM PA for 48 h. Ultra-structural analysis of
mitochondria was performed by transmission electron microscopy
(magnification, ×30,000). (Aa) Control without PA treatment, (Ab)
miR-106b inhibitor sponge without PA treatment, (Ac) control with
100 μM PA treatment, (Ad) miR-106b inhibitor sponge with 100 μM PA
treatment). Arrow 1 indicates mitochondrial pyknosis, arrow 2
indicates mitochondrial vacuolar degeneration. (B) MiR-106b
silencing increased relative mtDNA copy number, particularly under
PA treatment. Values represent the mean ± SD of three independent
experiments (n=6). (C) MiR-106b silencing increased cellular ATP
production under PA treatment. Values represent the mean ± SD from
six independent experiments (n=6). *P<0.05 vs.
without PA treatment, **P<0.01 vs. without PA
treatment, #P<0.05 vs. control.##P<0.01
vs. control. miR, microRNA; PA, palmitic acid; SD, standard
deviation; mtDNA, mitochondrial DNA. |
miR-106b loss of function attenuates
intracellular ROS level and improves upregulated PGC-1α and ERR-α
expression under PA-induced insulin resistance
It has been established that ROS and oxidative
stress are causal factors of skeletal muscle mitochondrial
dysfunction and insulin resistance (7,17).
The present study explored whether miR-106b protection from
PA-induced mitochondrial dysfunction was associated with reduced
ROS level. The results demonstrated that miR-106b silencing
alleviated the ROS level (P<0.01), which was increased by PA
treatment (P<0.05 at 100 μM and P<0.01 at 200 μM) (Fig. 3A). PGC-1α coactivated by ERR-α,
participates in the stimulation of Mfn2 expression under a variety
of conditions characterized by enhanced energy expenditure
(18,19). Therefore, the present study
analyzed whether miR-106b loss of function could affect the
PGC-1α/ERR-α axis. Treatment with 200 μM PA led to a reduction in
the expression levels of PGC-1α mRNA and protein (Fig. 3B and D; P<0.05). PA also
downregulated ERR-α mRNA (P<0.05 at 100 μM and P<0.01 at 200
μM) and protein expression levels (P<0.05) (Fig. 3C and D). MiR-106b silencing
upregulated PGC-1α at the mRNA (P<0.01) and protein (P<0.05
at 100 μM and P<0.01 at 200 μM) levels under PA treatment, and
upregulated the expression levels of ERR-α mRNA (P<0.01) and
protein (P<0.05) without PA treatment (Fig. 3B–D). These data suggest that
inhibition of miR-106b improves mitochondrial function by reducing
the levels of ROS and upregulating PGC-1α and ERR-α expression.
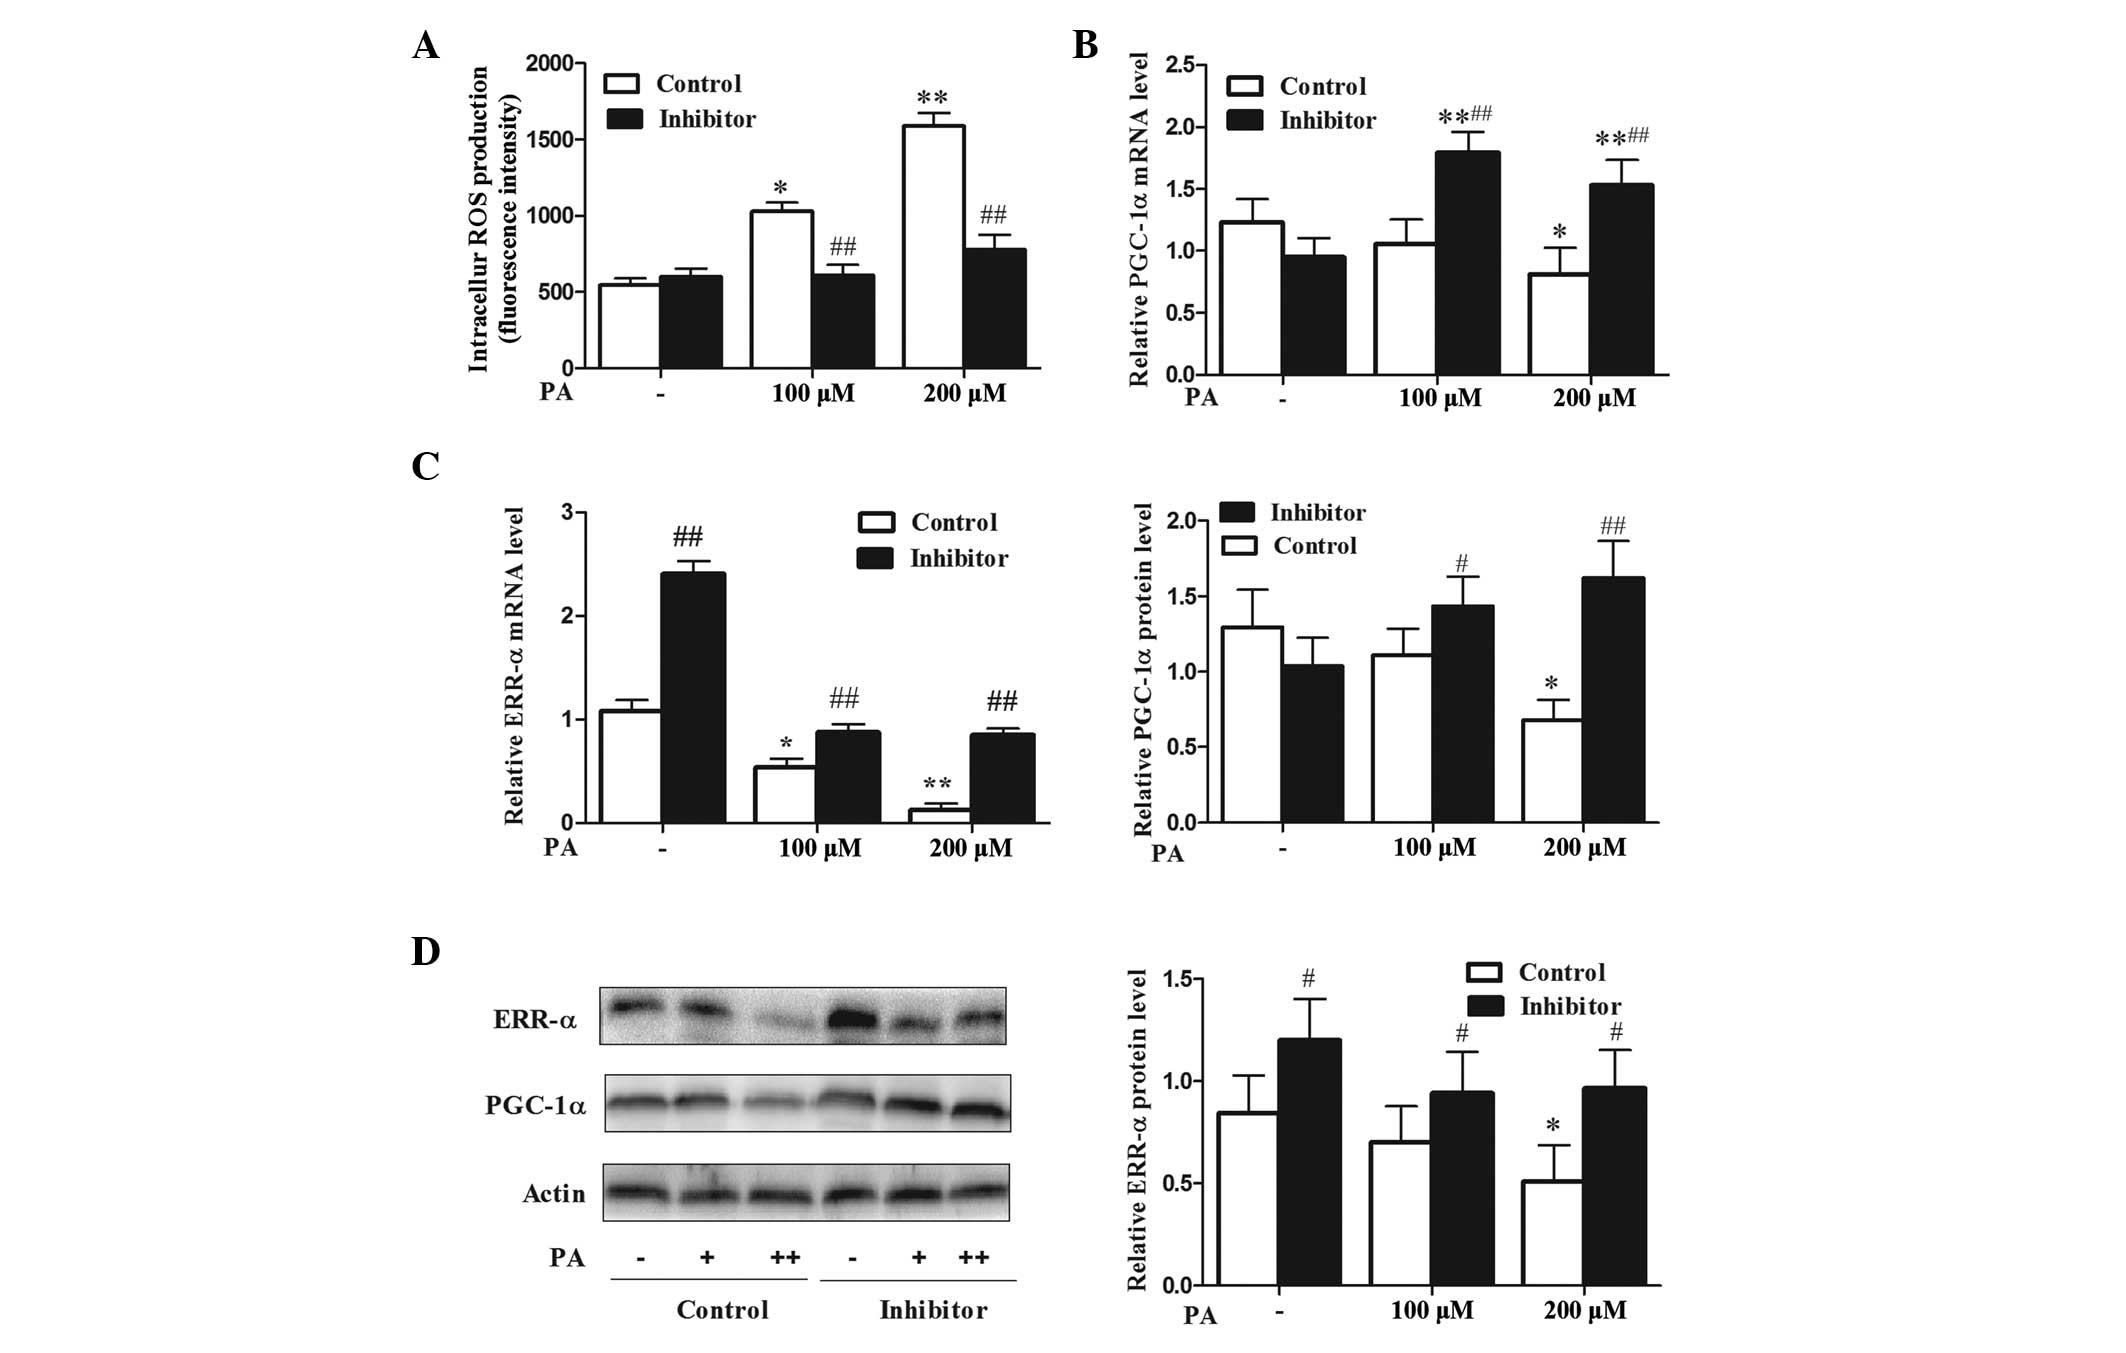 | Figure 3miR-106b loss of function attenuates
intracellular ROS levels and improves upregulated PGC-1α and ERR-α
expression under PA-induced insulin resistance. (A) miR-106b loss
of function attenuates intracellular ROS levels under PA treatment.
Values represent the mean ± SD from three independent experiments
(n=6). (B and C) PGC-1α/ERR-α mRNA expression. Values represent the
mean ± SD from three independent experiments (n=3). (D)
PGC-1α/ERR-α protein expression. Values represent the mean ± SD
from three independent experiments (n=3) #P<0.05 vs.
control, *P<0.05 vs. without PA treatment,
##P<0.01 vs. control,.**P<0.01 vs.
without PA treatment. miR, microRNA; ROS, reactive oxygen species;
SD, standard deviation; PA, palmitic acid; PGC-1α, peroxisome
proliferative activated receptor, γ, coactivator 1 α; ERR-α,
estrogen-related receptor-α. |
Discussion
Skeletal muscle is the predominant site of glucose
uptake and metabolism. It has been debated whether skeletal muscle
mitochondrial dysfunction is a consequence or the cause of muscular
fat accumulation. Schrauwen et al (7) reviewed these studies, which have used
high-fat diets to manipulate the IMCL content and assess the impact
on mitochondrial function, and came to the conclusion that rodents
have the capacity to (initially) adapt mitochondrial function to a
high fat intake, and that mitochondrial dysfunction only occurs as
high fat diets are continued for a longer period. It was suggested
that mitochondrial dysfunction may be a consequence of muscular fat
accumulation, and that it develops when the protective mechanisms
can no longer cope with high levels of muscular fatty acids,
leading to lipotoxicity (7). It
should be noted that lipid-induced mitochondrial dysfunction may
lead to progressive deterioration of muscular oxidative capacity
and the accumulation of lipid intermediates in skeletal muscle
tissue.
It has been established that lipotoxicity, the
deleterious effects of accumulating fatty acids in skeletal muscle
cells, may lie at the basis of mitochondrial dysfunction; in
addition to producing energy, mitochondria are the major source of
reactive oxygen species (17).
Fatty acids accumulating in the vicinity of the mitochondria are
vulnerable to ROS-induced lipid peroxidation. Notably, increased
lipid peroxidation has been reported in insulin-resistant skeletal
muscle, and the mitochondrial uncoupling protein-3, which has been
suggested to prevent lipid-induced mitochondrial damage by lowering
ROS production, is reduced in subjects with an impaired glucose
tolerance and in type 2 diabetic patients (20,21).
Subsequently, these lipid peroxides may have lipotoxic effects on
mtDNA, RNA and the proteins of the mitochondrial machinery, leading
to mitochondrial dysfunction (7).
Mitochondrial dynamics are associated with mitochondrial
dysfunction and insulin resistance in skeletal muscle. It has been
reported that PA shifts the balance toward fission in muscle cells
by upregulating mitochondrion-associated dynamin-related protein 1
(Drp1) and fission 1 (Fis1), and inducing mitochondrial dysfunction
and insulin resistance (22).
However, there may be another mechanism of FFA-induced sketetal
muscle mitochondrial dysfunction and insulin resisitance.
In a previous study, miR-106b was discovered to
induce mitochondrial dysfunction and insulin resistance in C2C12
myotubes by targeting mitofusin-2 (15). Mfn2 protein is a dynamin-related
protein with GTPase activity anchored in the external mitochondrial
membrane, and it mediates mitochondrial fusion (23). Mfn2 is abundantly expressed in
skeletal muscle tissue, and it participates in the maintenance of
the mitochondrial morphology and regulates the mitochondrial
metabolism (19). Previous studies
have shown that individuals with obesity and type 2 diabetes have
reduced Mfn2 expression levels that positively correlate with
insulin sensitivity (24,25), and that Mfn2 knockdown in muscle
cells impairs insulin signaling and results in mitochondrial
dysfunction (26). Hence, we
hypothesize that this protein has an important role in the etiology
of mitochondrial dysfunction and insulin resistance in skeletal
muscle.
In the current study, it was revealed that miR-106b
expression levels were increased by PA treatment, and it was
demonstrated that PA exposure blocked the insulin-stimulated
glucose uptake and GLUT4 transportation of myocytes, effects that
were reduced by miR-106b loss of function. Furthermore, the
PA-treated cells exhibited reduced levels of ATP production and
mtDNA, which suggests that they have reduced mitochondrial
oxidative activity and biogenesis. These findings were in concord
with those of Gao et al (27). It has been reported that Mfn2
ablation reduced mitochondrial membrane potential (26) and mtDNA levels (28), and enhanced the production of
hydrogen peroxide (26) in
myocytes. Similarly, the current study demonstrated that
accompanied by Mfn2 upregulation, miR-106b loss of function altered
mtDNA and ROS abandance in an adverse pattern under PA treatment.
It has been shown that the ATP levels in Mfn2-silenced muscle cells
are not altered (26), and
overexpression of Mfn-2 in healthy muscle does not influence
mitochondrial bioenergetics in mature mammalian skeletal muscle
(29). However, the present study
showed that miR-106b loss of function attenuated the reduced
intracellular ATP levels in myotubes treated by PA. Concomitantly
with mitochondrial dysfunction, PA induced high levels of
intracellular ROS, and downregulated Mfn2 and ERR-α/PGC-1α
expression at the mRNA and protein levels. Jheng et al
(22) revealed that excess PA
induced mitochondrial fragmentation by increasing
mitochondrion-associated Drp1 and Fis1, without alteration of Mfn2
and PGC-1α in differentiated C2C12 muscle cells. In addition,
fragmented, discontinuous mitochondria were observed in C2C12
myotubes treated with PA, resulting in a low fusion-to-fission
ratio. This discrepancy in Mfn2 and PGC-1α expression in C2C12
treated with PA may result from the treatment time, in the former
study PA treatment was administered for 24 h, but in the present
study treatment was administered for 48 h. The results of the
current study demonstrated that miR-106b loss of function improves
mitochondrial morphology and function, accompanied by the
upregulation of Mfn2.
ERR-α transcription factor is a key regulator of
Mfn2 transcription that recruits PGC-1β and PGC-1α, which are
potent, positive regulators of Mfn2 expression in muscle cells
(18,19). The skeletal muscle of type 2
diabetic patients shows reduced expression of PGC-1α, and Mfn2, and
under conditions of enhanced energy expenditure, PGC-1α is induced
to stimulate mitochondrial biogenesis, Mfn2 expression and
mitochondrial function (18,19,30).
These regulatory pathways are defined by PGC-1α/ERR-α/Mfn2 and
permit the activation of mitochondrial metabolism in response to
energy needs. PA induced skeletal muscle insulin resistance and
downregulated the expression levels of Mfn2/ERR-α/PGC-1α at the
mRNA and protein levels. The PGC-1α/ERR-α/Mfn2 signaling pathways
participated in regulation of skeletal muscle mitochondrial
function and insulin sensitivity. It is likely that other
regulatory pathways, in addition to those mentioned, link PGC-1α
and Mfn2. The results revealed that C2C12 myotubes transduced with
the miR-106b sponge lentivirus and exposed to PA underwent a
greater induction of PGC-1α/ERR-α expression accompanied by
enhanced Mfn2 expression. The same pattern of PGC-1α/ERR-α and Mfn2
was observed in C2C12 myotubes transduced with the miR-106b sponge
lentivirus and exposed to TNF-α (15). Coincidentally, heterozygous Mfn2
knock-out mice previously subjected to cold for 48 h showed a
2-fold greater induction of PGC-1α expression in skeletal muscle
compared to wild-type mice, and this increase was accompanied by
enhanced Mfn2 expression (18).
These results suggest that an Mfn2-induced homeostatic process
regulates PGC-1α/ERR-α.
In conclusion, this study found that miR-106b loss
of function improved mitochondrial function and insulin resistance,
accompanied by an increase in the Mfn2 expression level following
PA treatment, which may be associated with reduced ROS and
upregulation of the ERR-α/PGC-1α/Mfn2 axis. These results suggest
that miR-106b may represent a potential therapeutic target for the
treatment of insulin resistance and type 2 diabetes. However,
whether the effect of miR-106b under PA induced skeletal muscle
insulin resistance is Mfn2-dependent requires further study.
Acknowledgements
This study was supported by grants from the National
Natural Science Foundation of China (nos. 81100592 and
81270800).
References
|
1
|
Petersen KF and Shulman GI: Etiology of
insulin resistance. Am J Med. 119:S10–16. 2006. View Article : Google Scholar : PubMed/NCBI
|
|
2
|
Hirabara SM, Silveira LR, Abdulkader F,
Carvalho CR, Procopio J and Curi R: Time-dependent effects of fatty
acids on skeletal muscle metabolism. J Cell Physiol. 210:7–15.
2007. View Article : Google Scholar
|
|
3
|
McGarry JD: Banting lecture 2001:
dysregulation of fatty acid metabolism in the etiology of type 2
diabetes. Diabetes. 51:7–18. 2002. View Article : Google Scholar : PubMed/NCBI
|
|
4
|
Silveira LR, Fiamoncini J, Hirabara SM, et
al: Updating the effects of fatty acids on skeletal muscle. J Cell
Physiol. 217:1–12. 2008. View Article : Google Scholar : PubMed/NCBI
|
|
5
|
Brehm A, Krssak M, Schmid AI, Nowotny P,
Waldhausl W and Roden M: Increased lipid availability impairs
insulin-stimulated ATP synthesis in human skeletal muscle.
Diabetes. 55:136–140. 2006. View Article : Google Scholar
|
|
6
|
Chanseaume E, Malpuech-Brugére C, Patrac
V, et al: Diets high in sugar, fat, and energy induce muscle
type-specific adaptations in mitochondrial functions in rats. J
Nutr. 136:2194–2200. 2006.PubMed/NCBI
|
|
7
|
Schrauwen P, Schrauwen-Hinderling V, Hoeks
J and Hesselink MK: Mitochondrial dysfunction and lipotoxicity.
Biochim Biophys Acta. 1801:266–271. 2010. View Article : Google Scholar
|
|
8
|
Schrauwen-Hinderling VB, Hesselink MK,
Schrauwen P and Kooi ME: Intramyocellular lipid content in human
skeletal muscle. Obesity (Silver Spring). 14:357–367. 2006.
View Article : Google Scholar
|
|
9
|
Koves TR, Ussher JR, Noland RC, et al:
Mitochondrial overload and incomplete fatty acid oxidation
contribute to skeletal muscle insulin resistance. Cell Metab.
7:45–56. 2008. View Article : Google Scholar : PubMed/NCBI
|
|
10
|
Guo H, Ingolia NT, Weissman JS and Bartel
DP: Mammalian microRNAs predominantly act to decrease target mRNA
levels. Nature. 466:835–840. 2010. View Article : Google Scholar : PubMed/NCBI
|
|
11
|
Ferland-McCollough D, Ozanne SE, Siddle K,
Willis AE and Bushell M: The involvement of microRNAs in Type 2
diabetes. Biochemical Society Transactions. 38:1565–1570. 2010.
View Article : Google Scholar
|
|
12
|
Poy MN, Spranger M and Stoffel M:
microRNAs and the regulation of glucose and lipid metabolism.
Diabetes Obes Metab. 9(Suppl 2): 67–73. 2007. View Article : Google Scholar : PubMed/NCBI
|
|
13
|
Gallagher IJ, Scheele C, Keller P, et al:
Integration of microRNA changes in vivo identifies novel molecular
features of muscle insulin resistance in type 2 diabetes. Genome
Med. 2:92010. View
Article : Google Scholar : PubMed/NCBI
|
|
14
|
Chen GQ, Lian WJ, Wang GM, Wang S, Yang YQ
and Zhao ZW: Altered microRNA expression in skeletal muscle results
from high-fat diet-induced insulin resistance in mice. Mol Med
Report. 5:1362–1368. 2012.
|
|
15
|
Zhang Y, Yang L, Gao YF, et al:
MicroRNA-106b induces mitochondrial dysfunction and insulin
resistance in C2C12 myotubes by targeting mitofusin-2. Mol Cell
Endocrinol. 381:230–240. 2013. View Article : Google Scholar : PubMed/NCBI
|
|
16
|
Shi CM, Wang YM, Zhang CM, et al:
Knockdown of NYGGF4 (PID1) rescues insulin resistance and
mitochondrial dysfunction induced by FCCP in 3T3-L1 adipocytes.
Mitochondrion. 12:600–606. 2012. View Article : Google Scholar : PubMed/NCBI
|
|
17
|
Houstis N, Rosen ED and Lander ES:
Reactive oxygen species have a causal role in multiple forms of
insulin resistance. Nature. 440:944–948. 2006. View Article : Google Scholar : PubMed/NCBI
|
|
18
|
Soriano FX, Liesa M, Bach D, Chan DC,
Palacin M and Zorzano A: Evidence for a mitochondrial regulatory
pathway defined by peroxisome proliferator-activated receptor-gamma
coactivator-1 alpha, estrogen-related receptor-alpha, and
mitofusin-2. Diabetes. 55:1783–1791. 2006. View Article : Google Scholar : PubMed/NCBI
|
|
19
|
Zorzano A: Regulation of mitofusin-2
expression in skeletal muscle. Appl Physiol Nutr Metab. 34:433–439.
2009. View
Article : Google Scholar : PubMed/NCBI
|
|
20
|
Russell AP, Gastaldi G, Bobbioni-Harsch E,
et al: Lipid peroxidation in skeletal muscle of obese as compared
to endurance-trained humans: a case of good vs. bad lipids? FEBS
Lett. 551:104–106. 2003. View Article : Google Scholar : PubMed/NCBI
|
|
21
|
Schrauwen P, Mensink M, Schaart G, et al:
Reduced skeletal muscle uncoupling protein-3 content in prediabetic
subjects and type 2 diabetic patients: restoration by rosiglitazone
treatment. J Clin Endocrinol Metab. 91:1520–1525. 2006. View Article : Google Scholar
|
|
22
|
Jheng HF, Tsai PJ, Guo SM, et al:
Mitochondrial fission contributes to mitochondrial dysfunction and
insulin resistance in skeletal muscle. Mol Cell Biol. 32:309–319.
2012. View Article : Google Scholar :
|
|
23
|
Liesa M, Palacín M and Zorzano A:
Mitochondrial dynamics in mammalian health and disease. Physiol
Rev. 89:799–845. 2009. View Article : Google Scholar : PubMed/NCBI
|
|
24
|
Bach D, Naon D, Pich S, et al: Expression
of Mfn2, the Charcot-Marie-Tooth neuropathy type 2A gene, in human
skeletal muscle: effects of type 2 diabetes, obesity, weight loss,
and the regulatory role of tumor necrosis factor alpha and
interleukin-6. Diabetes. 54:2685–2693. 2005. View Article : Google Scholar : PubMed/NCBI
|
|
25
|
Mingrone G, Manco M, Calvani M, Castagneto
M, Naon D and Zorzano A: Could the low level of expression of the
gene encoding skeletal muscle mitofusin-2 account for the metabolic
inflexibility of obesity? Diabetologia. 48:2108–2114. 2005.
View Article : Google Scholar : PubMed/NCBI
|
|
26
|
Sebastian D, Hernandez-Alvarez MI, Segales
J, et al: Mitofusin-2 (Mfn2) links mitochondrial and endoplasmic
reticulum function with insulin signaling and is essential for
normal glucose homeostasis. Proc Natl Acad Sci USA. 109:5523–5528.
2012. View Article : Google Scholar
|
|
27
|
Gao X, Zhao XL, Zhu YH, et al:
Tetramethylpyrazine protects palmitate-induced oxidative damage and
mitochondrial dysfunction in C2C12 myotubes. Life Sci. 88:803–809.
2011. View Article : Google Scholar : PubMed/NCBI
|
|
28
|
Vielhaber S, Debska-Vielhaber G, Peeva V,
et al: Mitofusin-2 mutations affect mitochondrial function by
mitochondrial DNA depletion. Acta Neuropathol. 125:245–256. 2013.
View Article : Google Scholar
|
|
29
|
Lally JS, Herbst EA, Matravadia S, et al:
Over-expressing mitofusin-2 in healthy mature mammalian skeletal
muscle does not alter mitochondrial bioenergetics. PLoS One.
8:e556602013. View Article : Google Scholar : PubMed/NCBI
|
|
30
|
Zorzano A, Hernández-Alvarez MI, Palacin M
and Mingrone G: Alterations in the mitochondrial regulatory
pathways constituted by the nuclear co-factors PGC-1alpha or
PGC-1beta and mitofusin 2 in skeletal muscle in type 2 diabetes.
Biochim Biophys Acta. 1797:1028–1033. 2010. View Article : Google Scholar : PubMed/NCBI
|


