Introduction
Pancreatic cancer (PC; OMIM 260350) is a highly
lethal disease, with an incidence rate that is constantly
increasing (1). The 5-year
survival rate of PC is <5% (2),
and almost all patients with primary PC develop metastases.
Previous studies have indicated that PC has a
complex genomic landscape with frequent copy number variations
(CNVs) or copy number polymorphisms (CNPs) (3). Biankin et al (4) defined 16 significantly mutated genes
[e.g., Kirsten rat sarcoma viral oncogene homolog (KRAS),
tumor protein p53 (TP53), SMAD family member 4
(SMAD4) and transforming growth factor β receptor 2
(TGFBR2)] that were reaffirmed known mutations associated
with PC. The commonly mutated genes, such as KRAS (74–100%),
cyclin-dependent kinase inhibitor 2A (up to 98%), TP53
(43–76%), erb-b2 receptor tyrosine kinase 2 (ERBB2; ~65%)
and fragile histidine triad (~70%) have been found in PC (5–9).
Among these genes, KRAS and ERBB2 are
proto-oncogenes, whereas the other genes are tumor suppressors
(3). The progression of PC is
correlated with the activation of oncogenes and the inactivation of
tumor suppressor genes, as well as the deregulation of a number of
signaling pathways, among which the epidermal growth factor
receptor (EGFR), v-akt murine thymoma viral oncogene homolog
1 (v-AKT1) and nuclear factor of κ light polypeptide gene
enhancer in B-cells 1 (NFκB1) pathways appear to be most
relevant (10).
AKT1 is a central regulator of cell growth.
AKT1 has been shown to inhibit apoptosis and promote cell
survival, thus contributing to the pathogenesis of cancer (11,12).
Pei et al (13) showed that
FK506-binding protein 51 (FKBP51) acted as a scaffolding
protein for Akt and that it promoted the activation of Akt. The
expression of FKBP51 was downregulated in PC tissues.
Decreased FKBP51 expression resulted in the
hyper-phosphorylation of Akt, and then decreased the level of cell
death in the PC tissues. Thus, Pei et al demonstrated
FKBP51 to be a negative regulator of the Akt pathway
(13). Pei et al also
released the mRNA expression microarray dataset, GSE16515,
consisting of 36 pancreatic tumor and 16 normal tissue samples.
Numerous studies have since been performed using this dataset
(14–16). For example, using the GSE16515
dataset, Yang et al (14)
screened the differentially-expressed genes (DEGs), such as TGF α
(TGFA) and EGF, between PC tumor tissues and normal
tissues, and selected the important single nucleotide polymorphisms
(SNPs) of A/G and C/T in the DEGs. However, none of the studies
based on the GSE16515 dataset performed an analysis of CNVs in the
DEGs.
Using the GSE16515 dataset downloaded from Gene
Expression Omnibus (GEO), the DEGs between PC tumor tissues and
normal tissues were screened in the present study. Next, clustering
analysis and construction of a protein-protein interaction (PPI)
network of DEGs was performed. The underlying functions of these
DEGs were investigated by functional and pathway enrichment
analyses. Finally, the CNVs of these DEGs were also analyzed. This
will be beneficial for developing therapeutic strategies for
patients with PC.
Materials and methods
mRNA microarray data
The mRNA expression microarray data from the
GSE16515 dataset (6) was
downloaded from GEO (http://www.ncbi.nlm.nih.gov/geo/), based on the
platform of GPL570 [HG-U133_Plus_2] Affymetrix Human Genome U133
Plus 2.0 Array (Affymetrix, Santa Clara, CA, USA). GSE16515 was
composed of 52 samples (from 34 males and 18 females). In total, 32
samples consisted of tumor and normal expression data, whereas 20
samples consisted of only tumor data. These samples were obtained
during clinically indicated surgical procedures and consent was
obtained for experimental purposes. The raw data and the probe
annotation files were downloaded for further analysis. The
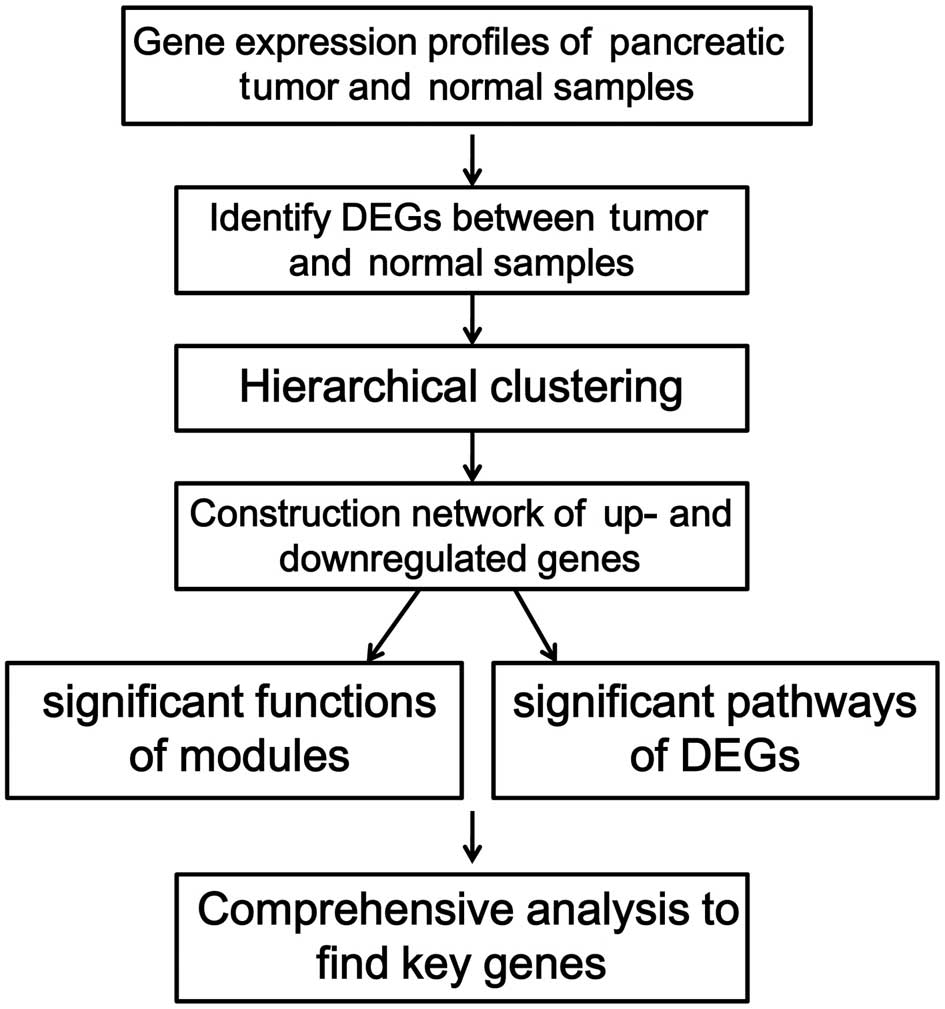
microarray data of the GSE16515 dataset was analyzed following the
procedures presented in Fig.
1.
Data preprocessing and DEG
identification
The Robust Multiarray Average in Affy package of R
(http://www.biocon-ductor.org/packages/release/bioc/html/affy.html),
provided by Bioconductor project (17), was applied to process the raw
micro-array data. The processing included background correction,
quantile normalization and probe summarization of expression
values. The gene expression matrices were obtained for further
analysis. Afterwards, the Linear Models for Microarray Data package
was used to identify the gene signatures between the tumor and
normal tissues, with significant differences indicated using a
P-value of <0.05. Next, the Bonferroni correction (18) was applied to adjust the raw P-value
for the false discovery rate (FDR) and to calculate the fold change
(FC). In the present study, the cut-off criteria for the
statistically significant DEGs were |log2FC| >1 and FDR
<0.05.
Clustering analysis of DEGs
Based on the Euclidean distance between the
expression profile of each DEG filtered from the samples,
hierarchical clustering can be used to build a hierarchy of
clusters of DEGs (19). The
heatmap figure of the DEGs was drawn with the R package pheatmap
(http://cran.r-project.org/web/packages/pheatmap/index.html)
function. DEGs with the same signatures were clustered together,
indicating the specificity of the DEGs.
Identification of PPIs of DEGs
Identification of protein complexes and functional
modules from PPI networks is crucial to predict protein functions
and to understand the principles of cellular organization (20). The Search Tool for the Retrieval of
Interacting Genes (STRING; http://string-db.org/) database provides uniquely
comprehensive coverage and ease of access for the prediction of
interaction information (21). To
better understand the interactions of the DEGs, the PPI network of
their encoding products was predicted using the STRING database,
with the reliability threshold of >0.9. Cytoscape software
(http://cytoscape.org/), a standard tool for the
integrated analysis and visualization of biological networks, was
used to visualize the PPI network (22).
Functional enrichment analysis of
DEGs
Gene Ontology (GO; http://www.geneontology.org/) analysis is an
functional study method for large-scale transcriptomic or genomic
data (23). In order to
investigate the biofunctions of DEGs in tumor progression, the
Database for Annotation, Visualization and Integrated Discovery
(http://david.abcc.Ncifcrf.gov/), a
high-throughput and integrated data-mining environment (24), was used to identify the enriched GO
biological processes that the DEGs were associated with
(FDR<0.05).
Pathway analysis of DEGs
The Kyoto Encyclopedia of Genes and Genomes (KEGG;
http://www.genome.jp/kegg/pathway.html) pathway
database provides information on how molecules or genes function
(25). Pathway analysis of all the
DEGs was performed using the KEGG database. The KEGG maps of
biological functions associated with DEGs were obtained
(P<0.05).
CNV analysis of DEGs
The Database of Genomic Variants (DGV; http://dgv.tcag.ca/) (26) was used to identify the CNVs in the
DEGs, including deletions, insertions, duplications, complex
multi-site variants and SNPs.
Results
Data processing and identification of
DEGs
After the normalization, the DEGs between the tumor
and normal tissues of the 52 samples were identified, with the
cut-off criteria of |log2FC| >1 and FDR <0.05. A total of
1,765 DEGs were identified between the PC and normal tissues, of
which 1,312 were upregulated and 453 were downregulated.
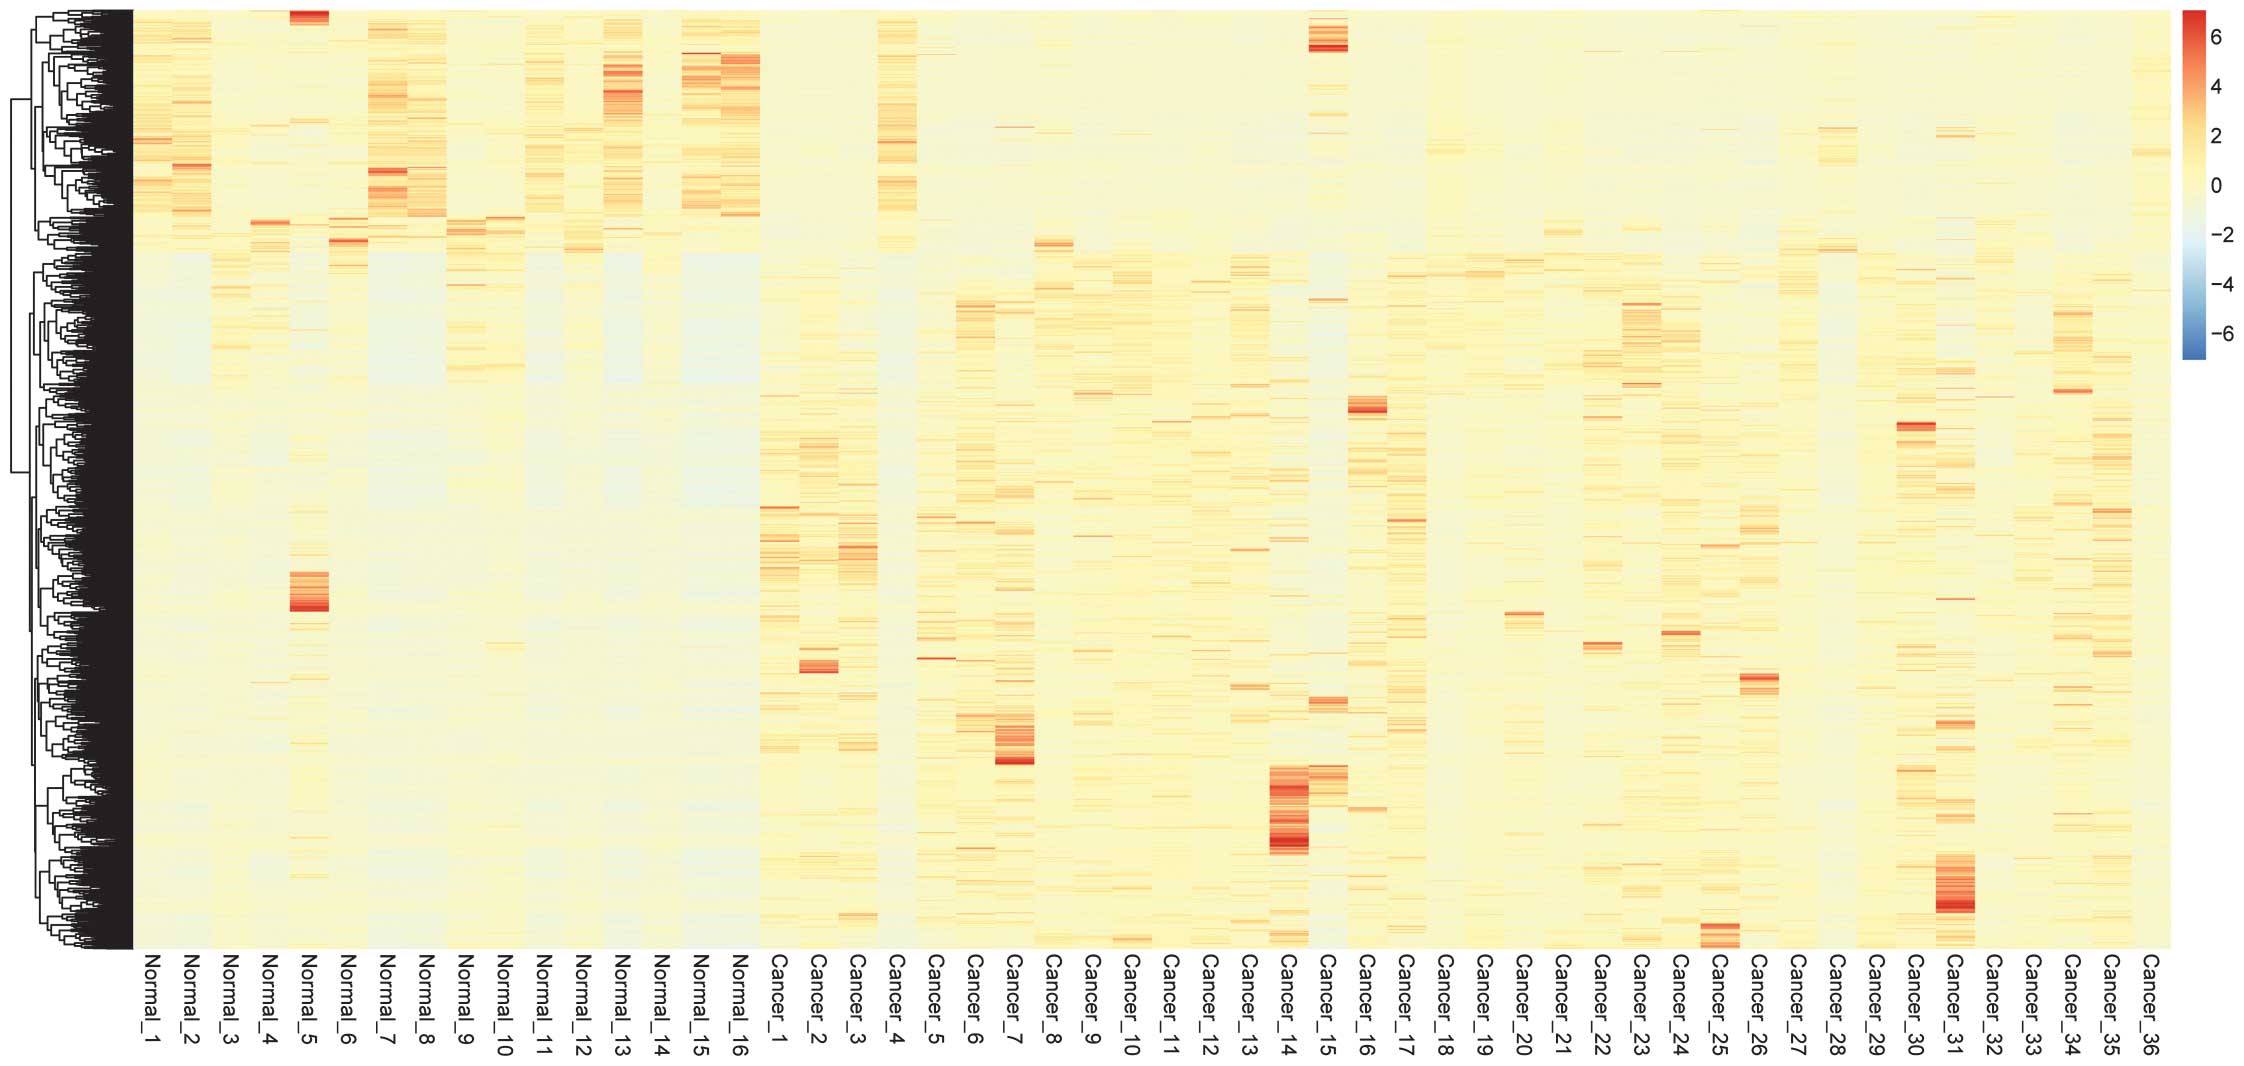
Hierarchical clustering of DEGs
Hierarchical clustering of the 1,765 DEGs is
presented in Fig. 2. The LogFC
values of the DEGs ranged from 6-fold downregulated and 6-fold
upregulated. The majority of the DEGs were upregulated in the PC
tumors compared with the normal tissues. The tumor samples and the
normal control samples could easily be distinguished from the
characteristics of the DEGs.
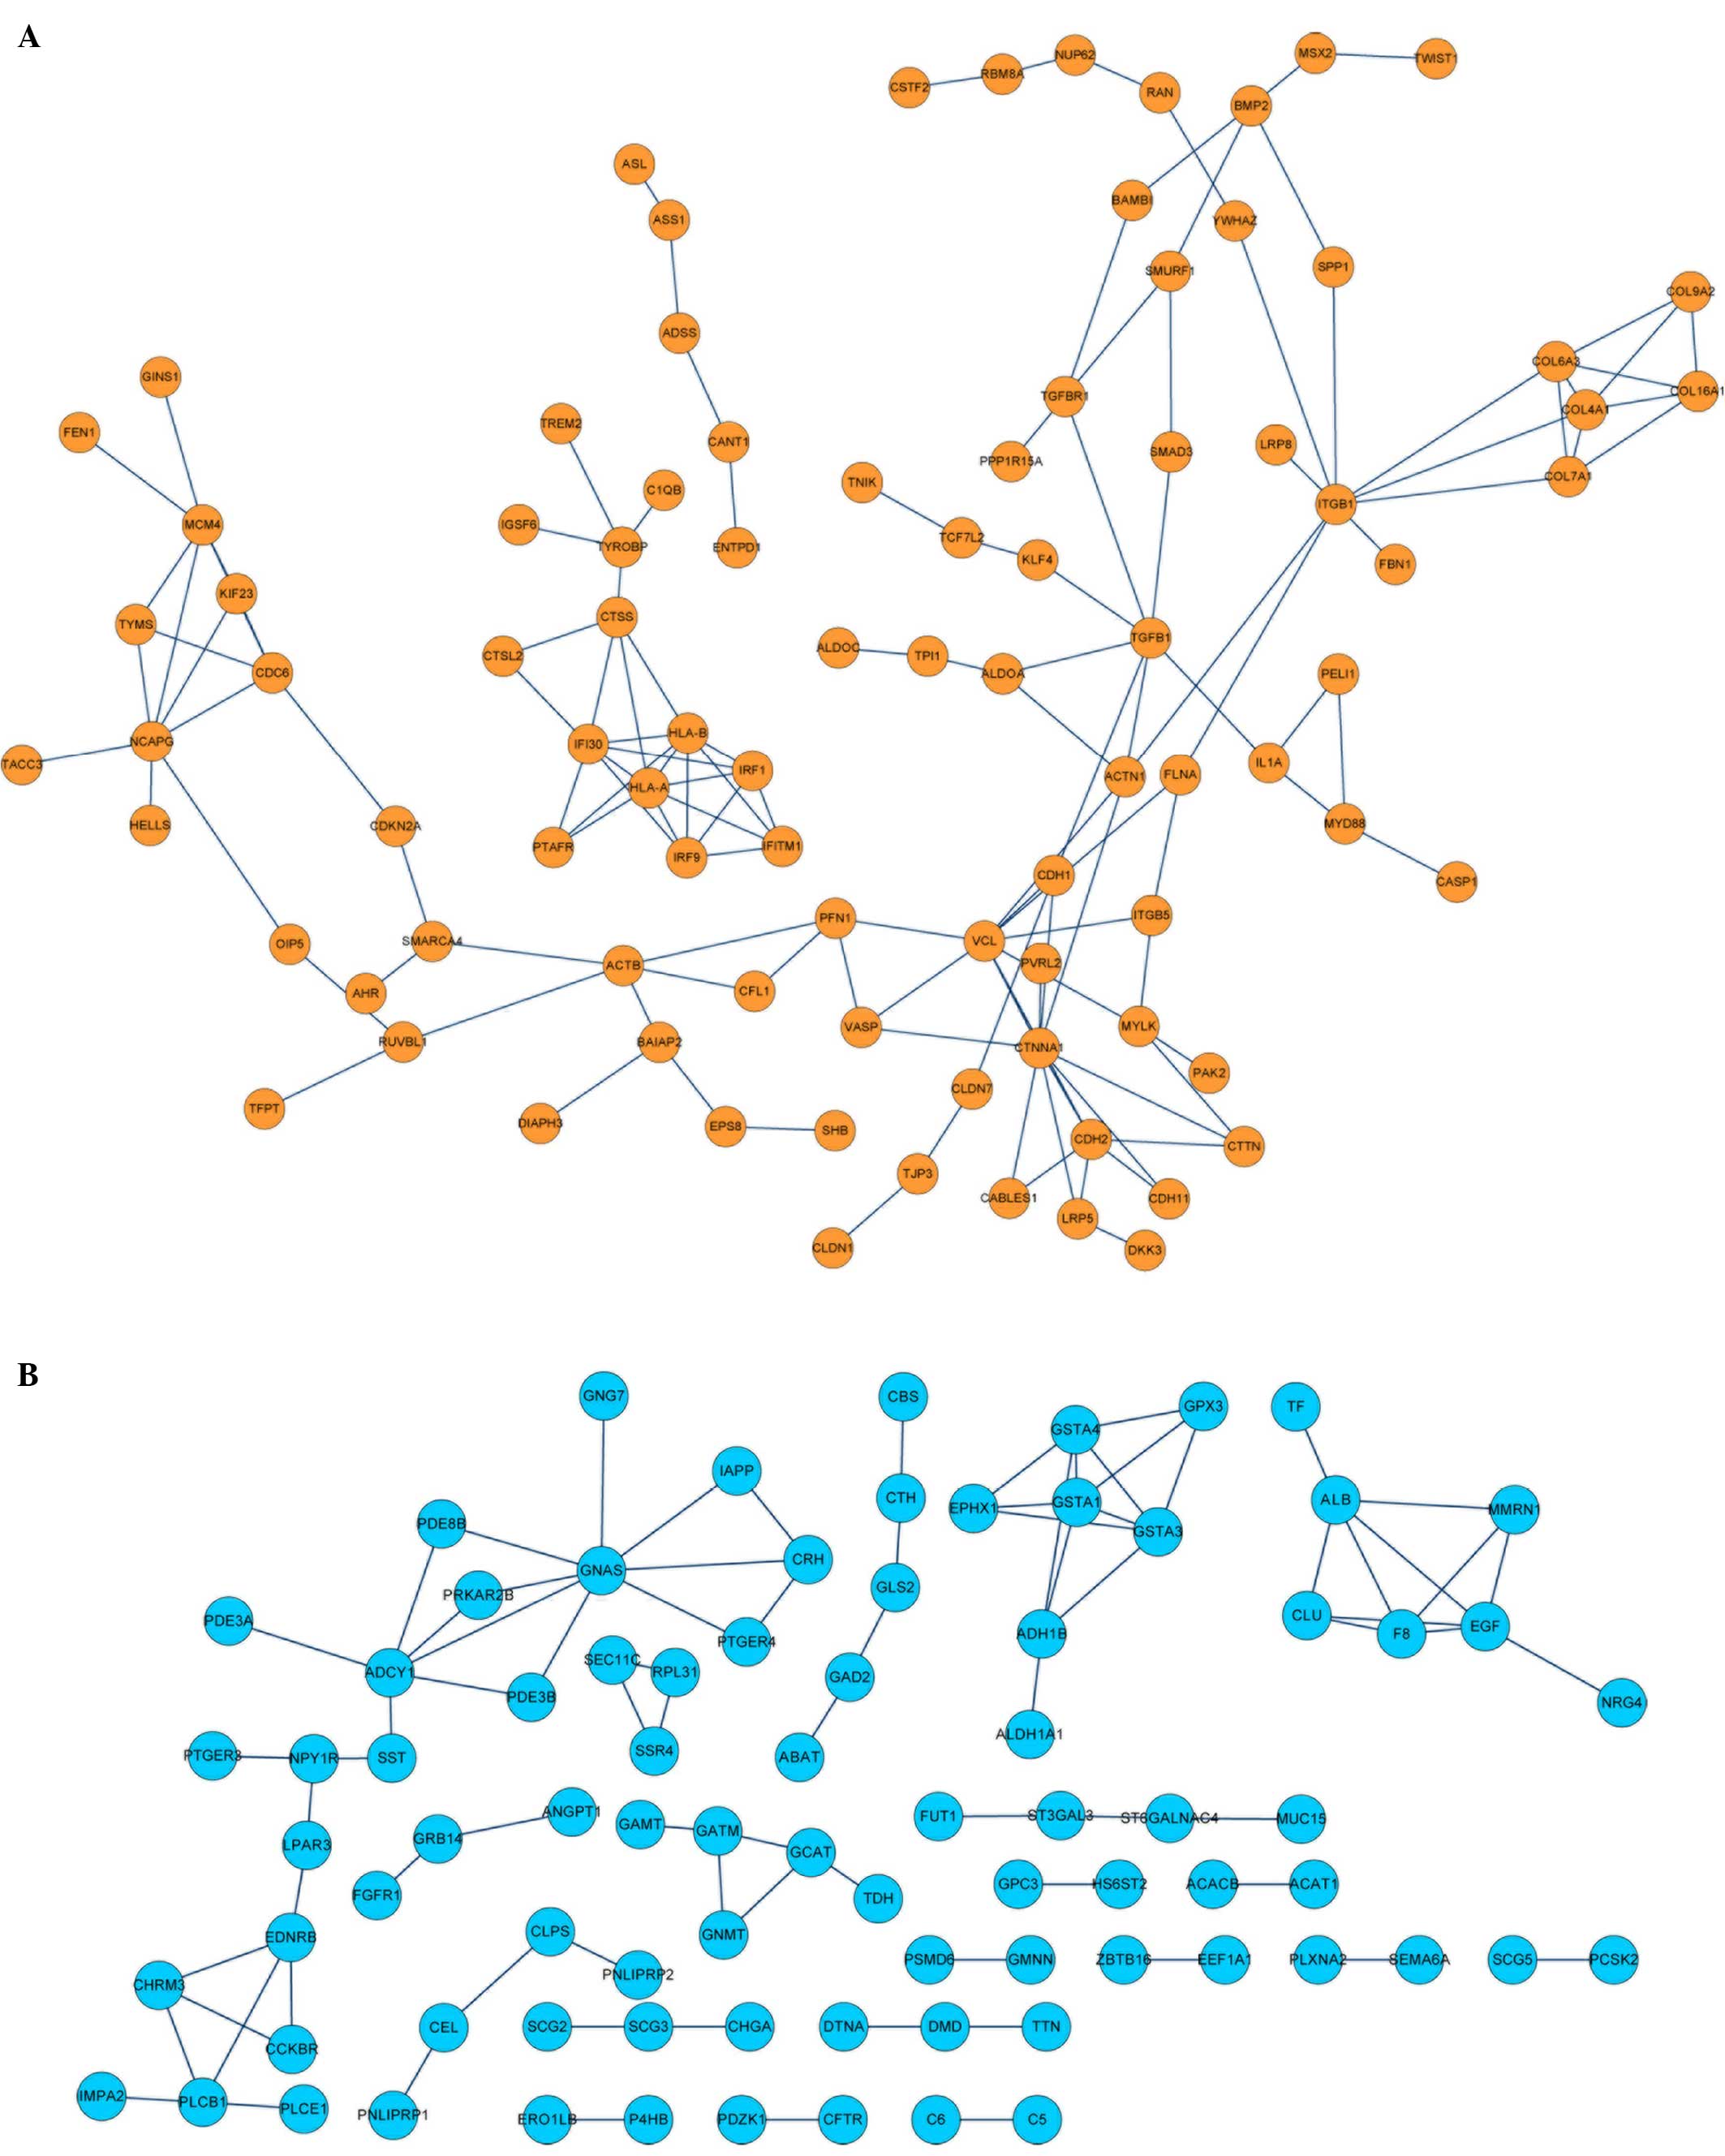
PPIs analysis of DEGs
To identify the PPIs and predict protein functions,
PPI network analysis was performed using the STRING database
(threshold >0.9). The resulting PPI network of upregulated DEGs
connected to 92 nodes (proteins) through 171 PPIs, whereas the PPI
network of the downregulated DEGs connected to 82 nodes through 83
PPIs (Fig 3).
Functional enrichment analysis of
DEGs
To obtain the enriched GO biological processes of
the DEGs in the PPI networks, GO functional enrichment analysis was
performed for the up- and downregulated DEGs, respectively (FDR
<0.05). The upregulated DEGs (including TGFB1 and
TGFBR1) were associated with significant biological
processes, such as the regulation of nucleocytoplasmic transport,
protein localization and intracellular transport (Table I), whereas the downregulated DEGs
(e.g., EGF) were correlated with the biological processes of
the positive regulation of catalytic activity, the response to
organic substances and the response to hormone stimuli (Table I).
 | Table IEnriched GO biological processes of
the DEGs in the protein-protein interaction networks. |
Table I
Enriched GO biological processes of
the DEGs in the protein-protein interaction networks.
| Term and
function | Count | Genes | P-value | FDR |
|---|
| Upregulated
DEGs |
| GO:0046822 -
Regulation of nucleocytoplasmic transport | 7 | CDKN2A, TGFBR1,
SMAD3, CDH1, TACC3, FLNA, TGFB1 |
1.72×10⁻⁶ | 0.002848 |
| GO:0032880 -
Regulation of protein localization | 9 | TGFBR1, SMAD3,
CDH1, CDH2, CASP1, TACC3, FLNA, TGFB1, IL1A |
2.60×10⁻⁶ | 0.004308 |
| GO:0051222 -
Positive regulation of protein transport | 7 | TGFBR1, SMAD3,
CDH1, CASP1, FLNA, TGFB1, IL1A |
4.05×10⁻⁶ | 0.006710 |
| GO:0032386 -
Regulation of intracellular transport | 7 | CDKN2A, TGFBR1,
SMAD3, CDH1, TACC3, FLNA, TGFB1 |
5.69×10⁻⁶ | 0.009436 |
| Downregulated
DEGs |
| GO:0043085 -
Positive regulation of catalytic activity | 13 | ADCY1, PTGER3,
CCKBR, C6, C5, LPAR3, EDNRB, PRKAR2B, PLCE1, CLPS, GNAS, EGF,
PSMD6 |
1.72×10⁻⁵ | 0.027131 |
| GO:0010033 -
Response to organic substances | 15 | TF, ADCY1,
PNLIPRP1, GATM, PDE3B, EPHX1, CFTR, PDE3A, NPY1R, PRKAR2B, ABAT,
ANGPT1, GNAS, SST, GNG7 |
2.20×10⁻⁵ | 0.034801 |
| GO:0009725 -
Response to hormone stimuli | 11 | PRKAR2B,
PNLIPRP1, ADCY1, GATM, PDE3B, GNAS, ANGPT1, CFTR, NPY1R, SST,
GNG7 |
2.29×10⁻⁵ | 0.036206 |
| GO:0006575 -
Cellular amino acid derivative metabolic processes | 8 | GSTA1, P4HB,
CTH, GATM, GPX3, ABAT, GAMT, GNMT |
2.78×10⁻⁵ | 0.043955 |
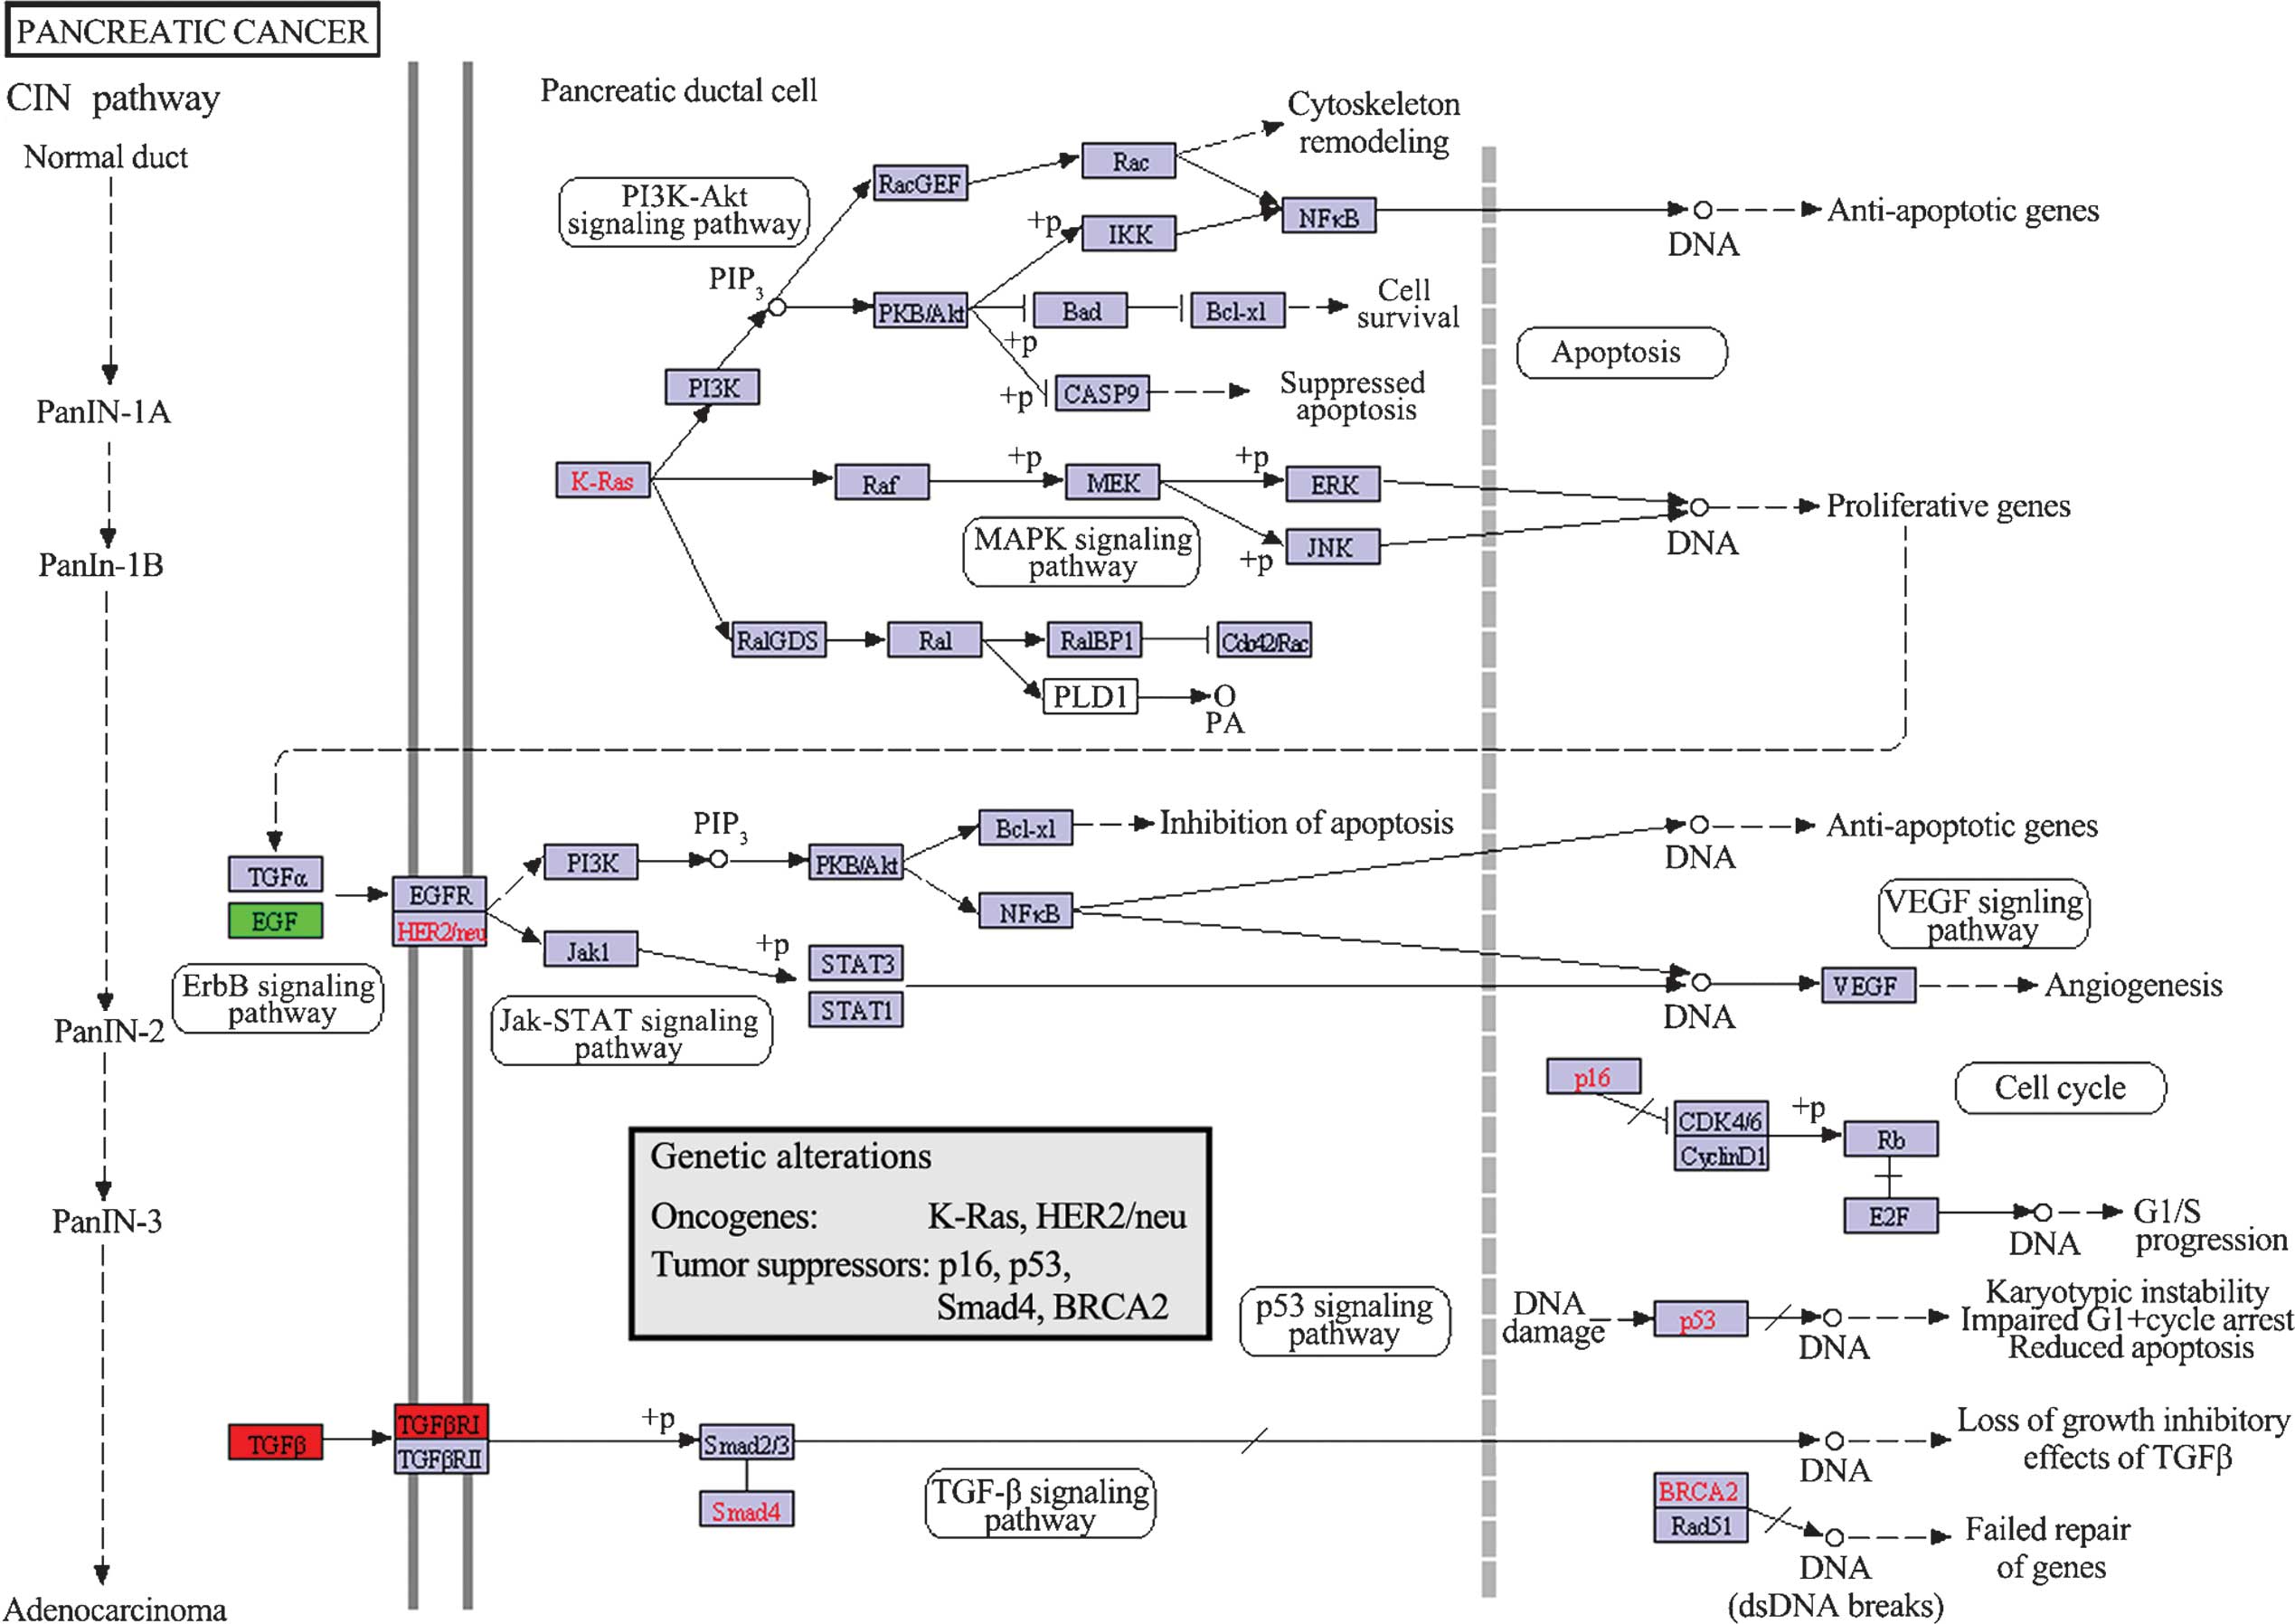
Pathway analysis of DEGs
The KEGG maps of biological functions associated
with DEGs in the PPI networks were obtained (P<0.05). The
results showed that only the pancreatic cancer pathway was
associated with DEGs in the PPI networks, including upregulated
TGFB1 and TGFBR1, and downregulated EGF
(Fig. 4).
CNV analysis of DEGs
The CNVs of the TGFB1, TGFBR1 and
EGF genes were further identified using the DGV. The
identification of CNVs of DEGs included deletions, insertions,
duplications and complex multi-site variants. Finally, 2, 3 and 5
CNVs, were identified in the TGFB1, TGFBR1 and
EGF genes, respectively (Table
II) (27–34). In total, 1 of the CNVs of
TGFB1 was insertin; all 3 of the CNVs of TGFBR1 were
insertins; and 1 of the 5 CNVs of EGF was insertin.
| Table IICopy number variations in
TGFB1, TGFBR1 and EGF genes. |
Table II
Copy number variations in
TGFB1, TGFBR1 and EGF genes.
| First author,
year | Gene | Variant ID | Subtype | (Ref.) |
|---|
| Xu et al,
2011 | TGFB1 | nsv911769 | Loss | (27) |
| Shaikh et
al, 2009 | | nsv521311 | Insertion | (28) |
| Xu et al,
2011 | TGFBR1 | nsv893619 | Insertion | (27) |
| | nsv893618 | Insertion | |
| Wong et al,
2007 | | nsv831666 | Insertion | (29) |
| Abecasis et
al, 2012 | EGF | esv2672203 | Deletion | (30) |
| McKernan et
al, 2009 | | esv2618042 | Insertion | (31) |
| Conrad et
al, 2010 | | esv22936 | Loss | (32) |
| Mills et al,
2006 | | nsv290769 | Loss | (33) |
| Kim et al,
2009 | | nsv820232 | Loss | (34) |
Discussion
The early stages of PC are usually asymptomatic, and
the majority of patients with PC are diagnosed at an advanced
stage. The pathogenesis of PC is involved in a number of biological
processes. Advanced studies of genetic factors have greatly
improved our understanding of the pathogenesis of PC, which is
associated with gene mutations, continuous changes to nuclei, loss
of polarity and changes in cellular architecture (35).
In the present study, the DEGs between PC tumor
tissues and normal tissues were systematically investigated. A
total of 1,765 DEGs, including 1,312 upregulated and 453
down-regulated DEGs, were identified. The majority of DEGs were
upregulated in the tumor tissues. The upregulated DEGs (including
SMAD3, TGFB1 and TGFBR1) were associated with
the regulation of nucleocytoplasmic and intracellular transport,
and protein localization, whereas the downregulated DEGs (e.g.,
EGF) were associated with regulation of catalytic activity,
and the responses to organic substances and hormone stimuli. All 4
of these DEGs were connected to the pancreatic cancer pathway. In
addition, TGFB1, TGFBR1 and EGF exhibited 2, 3
and 5 CNVs, respectively. These results proposed an important role
for these DEGs in PC development.
CNVs or CNPs, such as deletions, insertions,
duplications and complex multi-site variants, have been found in
all humans and in other mammals (36). CNVs can be simple in structures
like tandem duplication, or may be complex in the genome, such as
in gains or losses of homologous sequences at multiple sites
(37). Yang et al (14) screened the DEGs between PC tissues
and normal tissues using the GSE16515 dataset, and selected the
important SNPs of A/G and C/T in DEGs such as TGFA and
EGF. In the present study, 5 CNVs of EGF were
identified, including 3 losses, 1 deletion and 1 insertion. These
results demonstrate that the CNVs of EGF may be significant
in the pathogenesis of PC.
EGFR is required for KRAS-induced PC
(38). Accordingly, the
overexpression of EGFR and TGFA has been reported as
an important molecular abnormality in human PCs (39). EGF and TGFA are
essential molecules for the VEGF signaling pathway (Fig. 4). The inhibition of the vascular
endothelial growth factor (VEGF) signaling pathway is beneficial
for the suppression of tumor metastasis and invasion, such as
required in PC (40). In the
present study, it was found that the expression of EGF was
downregulated in the PC tissues. Taken together, these results
suggest the significant role of EGF in PC and indicate that
EGF may be a novel target for the therapy of PC.
TGFB1 and TGFBR1 were overexpressed in
the PC tumors in the present study. The two genes are elements of
the TGFB signaling pathway, which is a potent inhibitor of cell
growth (41). There is growing
evidence that members of the TGFB family are frequently
mutated in cancer. CNVs, DNA segments that are ≥1 kb and present at
variable copy number in comparison with a reference genome, affect
the expression of genes, the variation and adaptation of
phenotypes, and the pathogenesis of diseases, such as human
immunodeficiency virus-1 infection, by disrupting genes and
altering gene dosage in microdeletion or microduplication disorders
(42,43). The present study identified 3
insertion CNVs in TGFBR1, and 1 insertion CNV and 1 loss CNV
in TGFB1. Moreover, 3 of the CNVs in TGFBR1 and
TGFB1 were located at the same segment as in a previous
study (27). These indicate the
vital roles of TGFBR1 and TGFB1 in PC development.
The genes may be potential therapeutic targets for the treatment of
PC.
In summary, 1,765 DEGs, including 1,312 upregulated
(e.g., TGFB1 and TGFBR1) and 453 downregulated (e.g.,
EGF) DEGS, were identified in the PC tissues compared with
the normal tissues in the present study. The upregulated DEGs were
associated with the regulation of nucleocytoplasmic and
intracellular transport, whereas the downregulated DEGs were
associated with the regulation of catalytic activity, and the
response to organic substances and hormone stimuli. A pancreatic
cancer pathway was connected to the DEGs of TGFB1,
TGFBR1 and EGF. In addition, TGFB1,
TGFBR1 and EGF exhibited 2, 3 and 5 CNVs,
respectively. These results suggested the significance of the DEGs
in PC. TGFB1, TGFBR1 and EGF may be potential
therapeutic targets for the treatment of PC. However, further
clinical trials are required to validate these conclusions and
hypotheses.
References
|
1
|
Lowenfels AB and Maisonneuve P:
Epidemiology and risk factors for pancreatic cancer. Best Pract Res
Clin Gastroenterol. 20:197–209. 2006. View Article : Google Scholar : PubMed/NCBI
|
|
2
|
Thomas JK, Kim MS, Balakrishnan L,
Nanjappa V, Raju R, Marimuthu A, Radhakrishnan A, Muthusamy B, Khan
AA, Sakamuri S, et al: Pancreatic Cancer Database: An integrative
resource for pancreatic cancer. Cancer Biol Ther. 15:963–967. 2014.
View Article : Google Scholar : PubMed/NCBI
|
|
3
|
Strimpakos A, Saif MW and Syrigos KN:
Pancreatic cancer: From molecular pathogenesis to targeted therapy.
Cancer Metastasis Rev. 27:495–522. 2008. View Article : Google Scholar : PubMed/NCBI
|
|
4
|
Biankin AV, Waddell N, Kassahn KS, Gingras
MC, Muthuswamy LB, Johns AL, Miller DK, Wilson PJ, Patch AM, Wu J,
et al: Pancreatic cancer genomes reveal aberrations in axon
guidance pathway genes. Nature. 491:399–405. 2012. View Article : Google Scholar : PubMed/NCBI
|
|
5
|
Hingorani SR, Petricoin EF, Maitra A,
Rajapakse V, King C, Jacobetz MA, Ross S, Conrads TP, Veenstra TD,
Hitt BA, et al: Preinvasive and invasive ductal pancreatic cancer
and its early detection in the mouse. Cancer Cell. 4:437–450. 2003.
View Article : Google Scholar
|
|
6
|
Goldstein AM, Fraser MC, Struewing JP,
Hussussian CJ, Ranade K, Zametkin DP, Fontaine LS, Organic SM,
Dracopoli NC and Clark WH Jr: Increased risk of pancreatic cancer
in melanoma-prone kindreds with p16INK4 mutations. N Engl J Med.
333:970–974. 1995. View Article : Google Scholar : PubMed/NCBI
|
|
7
|
Pellegata NS, Sessa F, Renault B, Bonato
M, Leone BE, Solcia E and Ranzani GN: K-ras and p53 gene mutations
in pancreatic cancer: Ductal and nonductal tumors progress through
different genetic lesions. Cancer Res. 54:1556–1560.
1994.PubMed/NCBI
|
|
8
|
Grau AM, Zhang L, Wang W, Ruan S, Evans
DB, Abbruzzese JL, Zhang W and Chiao PJ: Induction of p21waf1
expression and growth inhibition by transforming growth factor beta
involve the tumor suppressor gene DPC4 in human pancreatic
adenocarcinoma cells. Cancer Res. 57:3929–3934. 1997.PubMed/NCBI
|
|
9
|
Sorio C, Baron A, Orlandini S, Zamboni G,
Pederzoli P, Huebner K and Scarpa A: The FHIT gene is expressed in
pancreatic ductular cells and is altered in pancreatic cancers.
Cancer Res. 59:1308–1314. 1999.PubMed/NCBI
|
|
10
|
Sarkar FH, Banerjee S and Li Y: Pancreatic
cancer: Pathogenesis, prevention and treatment. Toxicol Appl
Pharmacol. 224:326–336. 2007. View Article : Google Scholar
|
|
11
|
Luo J, Manning BD and Cantley LC:
Targeting the PI3K-Akt pathway in human cancer: Rationale and
promise. Cancer Cell. 4:257–262. 2003. View Article : Google Scholar : PubMed/NCBI
|
|
12
|
Manning BD and Cantley LC: AKT/PKB
signaling: Navigating downstream. Cell. 129:1261–1274. 2007.
View Article : Google Scholar : PubMed/NCBI
|
|
13
|
Pei H, Li L, Fridley BL, Jenkins GD,
Kalari KR, Lingle W, Petersen G, Lou Z and Wang L: FKBP51 affects
cancer cell response to chemotherapy by negatively regulating Akt.
Cancer Cell. 16:259–266. 2009. View Article : Google Scholar : PubMed/NCBI
|
|
14
|
Yang D, Zhu Z, Wang W, Shen P, Wei Z, Wang
C and Cai Q: Expression profiles analysis of pancreatic cancer. Eur
Rev Med Pharmacol Sci. 17:311–317. 2013.PubMed/NCBI
|
|
15
|
Zhao LL, Zhang T, Zhuang LW, Yan BZ, Wang
RF and Liu BR: Uncovering the pathogenesis and identifying novel
targets of pancreatic cancer using bioinformatics approach. Mol
Biol Rep. 41:4697–4704. 2014. View Article : Google Scholar : PubMed/NCBI
|
|
16
|
Söderquist F, Hellström PM and Cunningham
JL: Human gastroenteropancreatic expression of melatonin and its
receptors MT1 and MT2. PLoS One. 10:e01201952015. View Article : Google Scholar : PubMed/NCBI
|
|
17
|
Irizarry RA, Hobbs B, Collin F,
Beazer-Barclay YD, Antonellis KJ, Scherf U and Speed TP:
Exploration, normalization and summaries of high density
oligonucleotide array probe level data. Biostatistics. 4:249–264.
2003. View Article : Google Scholar : PubMed/NCBI
|
|
18
|
Benjamini Y and Hochberg Y: Controlling
the false discovery rate: a practical and powerful approach to
multiple testing. J R Stat Soc B. 57:289–300. 1995.
|
|
19
|
Deza MM and Deza E: Encyclopedia of
distances. Springer; Heidelberg: 2009, View Article : Google Scholar
|
|
20
|
Li M, Wu X, Wang J and Pan Y: Towards the
identification of protein complexes and functional modules by
integrating PPI network and gene expression data. BMC
Bioinformatics. 13:1092012. View Article : Google Scholar : PubMed/NCBI
|
|
21
|
Szklarczyk D, Franceschini A, Kuhn M,
Simonovic M, Roth A, Minguez P, Doerks T, Stark M, Muller J, Bork
P, et al: The STRING database in 2011: Functional interaction
networks of proteins, globally integrated and scored. Nucleic Acids
Res. 39(Database issue): D561–D568. 2011. View Article : Google Scholar :
|
|
22
|
Shannon P, Markiel A, Ozier O, Baliga NS,
Wang JT, Ramage D, Amin N, Schwikowski B and Ideker T: Cytoscape: A
software environment for integrated models of biomolecular
interaction networks. Genome Res. 13:2498–2504. 2003. View Article : Google Scholar : PubMed/NCBI
|
|
23
|
Hulsegge I, Kommadath A and Smits MA:
Globaltest and GOEAST: Two different approaches for Gene Ontology
analysis. BMC Proc. 3(Suppl 4): S102009. View Article : Google Scholar : PubMed/NCBI
|
|
24
|
Huang da W, Sherman BT and Lempicki RA:
Systematic and integrative analysis of large gene lists using DAVID
bioinformatics resources. Nat Protoc. 4:44–57. 2009. View Article : Google Scholar : PubMed/NCBI
|
|
25
|
Kanehisa M and Goto S: KEGG: Kyoto
encyclopedia of genes and genomes. Nucleic Acids Res. 28:27–30.
2000. View Article : Google Scholar
|
|
26
|
MacDonald JR, Ziman R, Yuen RK, Feuk L and
Scherer SW: The Database of Genomic Variants: A curated collection
of structural variation in the human genome. Nucleic Acids Res.
42(Database issue): D986–D992. 2014. View Article : Google Scholar :
|
|
27
|
Xu H, Poh WT, Sim X, Ong RT, Suo C, Tay
WT, Khor CC, Seielstad M, Liu J, Aung T, et al: SgD-CNV, a database
for common and rare copy number variants in three Asian
populations. Hum Mutat. 32:1341–1349. 2011. View Article : Google Scholar : PubMed/NCBI
|
|
28
|
Shaikh TH, Gai X, Perin JC, Glessner JT,
Xie H, Murphy K, O'Hara R, Casalunovo T, Conlin LK, D'Arcy M, et
al: High-resolution mapping and analysis of copy number variations
in the human genome: a data resource for clinical and research
applications. Genome Res. 19:1682–1690. 2009. View Article : Google Scholar : PubMed/NCBI
|
|
29
|
Wong KK, deLeeuw RJ, Dosanjh NS, Kimm LR,
Cheng Z, Horsman DE, MacAulay C, Ng RT, Brown CJ, Eichler EE and
Lam WL: A comprehensive analysis of common copy-number variations
in the human genome. Am J Hum Genet. 80:91–104. 2007. View Article : Google Scholar :
|
|
30
|
Abecasis GR, Auton A, Brooks LD, Durbin
RM, Garrison EP, Kang HM, Korbel JO, Marchini JL, McCarthy S,
McVean GA and Abecasis GR: 1000 Genomes Project Consortium: An
integrated map of genetic variation from 1,092 human genomes.
Nature. 491:56–65. 2012. View Article : Google Scholar : PubMed/NCBI
|
|
31
|
McKernan KJ, Peckham HE, Costa GL,
McLaughlin SF, Fu Y, Tsung EF, Clouser CR, Duncan C, Ichikawa JK,
Lee CC, et al: Sequence and structural variation in a human genome
uncovered by short-read, massively parallel ligation sequencing
using two-base encoding. Genome Res. 19:1527–1541. 2009. View Article : Google Scholar : PubMed/NCBI
|
|
32
|
Conrad DF, Pinto D, Redon R, Feuk L,
Gokcumen O, Zhang Y, Aerts J, Andrews TD, Barnes C, Campbell P, et
al: Origins and functional impact of copy number variation in the
human genome. Nature. 464:704–712. 2010. View Article : Google Scholar
|
|
33
|
Mills RE, Luttig CT, Larkins CE, Beauchamp
A, Tsui C, Pittard WS and Devine SE: An initial map of insertion
and deletion (INDEL) variation in the human genome. Genome Res.
16:1182–1190. 2006. View Article : Google Scholar : PubMed/NCBI
|
|
34
|
Kim JI, Ju YS, Park H, Kim S, Lee S, Yi
JH, Mudge J, Miller NA, Hong D, Bell CJ, et al: A highly annotated
whole-genome sequence of a Korean individual. Nature.
460:1011–1015. 2009.PubMed/NCBI
|
|
35
|
Hruban RH, Adsay NV, Albores-Saavedra J,
Compton C, Garrett ES, Goodman SN, Kern SE, Klimstra DS, Klöppel G,
Longnecker DS, et al: v Am J Surg Pathol. 25:579–586. 2001.
View Article : Google Scholar
|
|
36
|
Feuk L, Carson AR and Scherer SW:
Structural variation in the human genome. Nat Rev Genet. 7:85–97.
2006. View Article : Google Scholar : PubMed/NCBI
|
|
37
|
Redon R, Ishikawa S, Fitch KR, Feuk L,
Perry GH, Andrews TD, Fiegler H, Shapero MH, Carson AR, Chen W, et
al: Global variation in copy number in the human genome. Nature.
444:444–454. 2006. View Article : Google Scholar : PubMed/NCBI
|
|
38
|
Ardito CM, Grüner BM, Takeuchi KK,
Lubeseder-Martellato C, Teichmann N, Mazur PK, DelGiorno KE,
Carpenter ES, Halbrook CJ, Hall JC, et al: EGF receptor is required
for KRAS-induced pancreatic tumorigenesis. Cancer Cell. 22:304–317.
2012. View Article : Google Scholar : PubMed/NCBI
|
|
39
|
Barton CM, Hall PA, Hughes CM, Gullick WJ
and Lemoine NR: Transforming growth factor alpha and epidermal
growth factor in human pancreatic cancer. J Pathol. 163:111–116.
1991. View Article : Google Scholar : PubMed/NCBI
|
|
40
|
Sennino B, Ishiguro-Oonuma T, Wei Y,
Naylor RM, Williamson CW, Bhagwandin V, Tabruyn SP, You WK, Chapman
HA, Christensen JG, et al: Suppression of tumor invasion and
metastasis by concurrent inhibition of c-Met and VEGF signaling in
pancreatic neuroendocrine tumors. Cancer Discov. 2:270–287. 2012.
View Article : Google Scholar : PubMed/NCBI
|
|
41
|
Pasche B, Pennison MJ, Jimenez H and Wang
M: TGFBR1 and cancer susceptibility. Trans Am Clin Climatol Assoc.
125:300–312. 2014.PubMed/NCBI
|
|
42
|
McCarroll SA, Hadnott TN, Perry GH, Sabeti
PC, Zody MC, Barrett JC, Dallaire S, Gabriel SB, Lee C, Daly MJ, et
al: Common deletion polymorphisms in the human genome. Nat Genet.
38:86–92. 2006. View
Article : Google Scholar : PubMed/NCBI
|
|
43
|
Nguyen DQ, Webber C and Ponting CP: Bias
of selection on human copy-number variants. PLoS Genet. 2:e202006.
View Article : Google Scholar : PubMed/NCBI
|