Introduction
Uric acid (UA) is a metabolic product of purine. Due
to the antioxidation and radical scavenging of UA, it serves an
important role in the metabolic processes of humans. However,
abnormal levels of UA additionally serve an important role for the
occurrence and development of certain diseases, including gout,
hyperuricemia, renal failure, urinary calculi, hypertension,
coronary heart disease, leukemia, arthritis and Lesch-Nyhan
syndrome (1,2). Therefore, a simple, rapid and
accurate detection method of UA may have an important role in the
diagnosis, treatment, monitoring and prevention of the
aforementioned diseases.
At present, the common detection methods include
enzymology, spectrophotometry, high performance liquid
chromatography and electrochemical luminescence (3–5).
However, these methods have the disadvantages of low sensitivity,
complex detection process, a narrow linear range and high cost. In
recent years, due to the advantages of high sensitivity, fast
detection and low cost, electrochemical sensing methods have been
widely investigated. However, the majority of the electrochemical
sensors used for UA detection remain unable to avoid the
disadvantages of low sensitivity, narrow linear range and poor
specificity (7–9). Therefore, identifying an ideal
electrochemical sensor has become a popular research focus in
recent years.
In 2004, Novoselov et al (6) synthesized graphene for the first
time. Graphene is a novel carbon nanomaterial that has a
two-dimensional honeycomb crystal structure and is composed of an
sp2 hybrid monolayer of carbon atoms connected by
covalent bonds. This special structure has the advantages of a high
specific surface area, good electrical conductivity, excellent
mechanical strength and high electrocatalytic activity (10–12).
Graphene has additionally been identified to have a series of other
novel unique properties, including good bio-affinity, a perfect
quantum tunnel effect, and room-temperature ferromagneticity
(13–16). Thus, graphene has been widely used
in nano-electronics, energy storage, biochemical sensors and
numerous other fields in previous years (17,18).
However, due its hydrophobicity, strong van der Waals forces and
π-π conjugated bond interactions, the monolayer of graphene tends
to aggregate and may even be converted into graphite in aqueous
solution (19,20). This greatly limits the applications
of graphene in electrochemical biosensors.
Molybdenum disulfide (MoS2) is a member
of the transition metal dichacogenide family. MoS2 has a
similar crystal structure, physical properties and chemical
properties to graphene. The crystal structure of MoS2 is
similar to a ‘sandwich’ structure that is composed of ‘S-Mo-S’
units (21,22). The atoms are strongly connected by
‘S-Mo’ covalent bonds, and the triple layers are weakly connected
to each other by van der Waals forces, leading to relative sliding
between layers (23,24). Due to its specific surface area,
strong adsorption capacity, high catalytic activity and weak
interlayer-friction, MoS2 is widely used in the
manufacturing of battery electrode materials, catalysts,
electrochemical devices, hydrogen storage materials and solid
lubricants (25–28). Compared with graphene, the
MoS2 monolayer is not able to aggregate and has improved
chemical stability in aqueous solution. However, the conductivity
and structural strength of MoS2 are far inferior to that
of graphene, which additionally limits its application in the field
of electrochemical biosensors (29,30).
In the present study G-MoS2 composites
were synthesized via the hydrothermal method. Due to the
synergistic interaction between graphene and MoS2, the
G-MoS2 composites have a high catalytic efficiency and
electrical conductivity, in addition to avoiding the conversion of
graphene into graphite in aqueous solution. The electrochemical
behavior of glucose (Glu), ascorbic acid (AA), dopamine (DA), UA
and human serum UA at a G-MoS2-Nafion/glassy carbon
electrode (GCE) were investigated by cyclic voltammetry (CV),
linear sweep voltammetry (LSV) and amperometric i-t curve
(i-t).
Materials and methods
Equipment
The following equipment was used: electrochemical
workstation (CHI-760E; Shanghai Chenghua Machinery Co., Ltd.,
Shanghai, China); ultrasonic cleaner (KQ-300DA; Kunshan Ultrasonic
Instruments Co., Ltd., Kunshan, China); electronic balance (FA1004;
Shanghai Yueping Scientific Instrument Co., Ltd., Shanghai, China);
electric heating air blast drying oven (DHG-9023; Shanghai Suopu
Instrument Co., Ltd. Shanghai, China; http://suopuyiqi.goepe.com/); freeze drying oven
(DZF-6020; Shanghai Xinmiao Medical Equipment Manufacturing Co.,
Ltd., Hangzhou, China); field-emission scanning electron microscope
(SEM; Low Vacuum JSM-6510; JEOL, Ltd., Tokyo, Japan); elemental
distribution spectrometer (EDS; Hitachi/S-4800; Hitachi, Ltd.,
Tokyo, Japan); and X-ray diffractometer (XRD; Dmax/Ultima IV;
Rigaku Corporation, Tokyo, Japan).
Electrochemical analysis system
Electrochemical measurements were performed with the
three-electrode system (working electrode, reference electrode and
auxiliary electrode) electrochemical workstation. The
G-MoS2-Nafion/GCE was used as the working electrode. A
saturated calomel electrode (Ag/AgCl; CKCl=3 mol/l) and
a platinum wire were used as the reference and auxiliary
electrodes, respectively.
Reagents
Glu, AA, DA and UA were purchased from Aladdin
Biochemical Technology Ltd. (Shanghai, China). Graphite powder,
H2SO4 (98%), NaNO3, HCl (5%),
H2O2 (30wt%), KMnO4, ammonium
molybdatetetrahydrate
(H24Mo7N6O24·4H2O)
and thioacetamide (C2H5NS) were purchased
from the Chengdu Kelong Chemical Reagent Factory (Chengdu, China).
Nafion solution (5%) was purchased from Sigma-Aldrich; Merck KGaA
(Darmstadt, Germany). PBS (0.2 M; pH=7.4) was prepared with
Na2HPO4 and NaH2PO4.
Twice distilled water was used in all of the experiments. All
reagents and chemicals were of analytical grade.
Patients
The human serum samples used in the present study
were collected from human peripheral blood preserved by the
Laboratory Department of The Affiliated Hospital of North Sichuan
Medical College (Nanchong, China), between March 2017 and May 2017.
A total of 35 human serum samples were collected, including 23
males and 12 females. The age distribution was in the range of
20–60 years old. As the study did not involve direct clinical
studies in humans, the interests of the serum donors were not at
risk of harm. With the permission of the ethical review committee
of the Affiliated Hospital of North Sichuan Medical College, it was
necessary to inform the individuals of the primary contents of the
present study, and to ensure that the collected serum not be used
in other experiments. All patients involved in the present study
signed written consent agreements.
Synthesis of graphene oxide (GO)
GO was synthesized from graphite powder using the
modified Hummers method (31).
Graphite (5 g) was added to concentrated
H2SO4 (120 ml) under magnetic stirring at
room temperature, to which NaNO3 (2.5 g) was added. The
mixture was maintained at 0–5°C. Under vigorous agitation for 30
min, KMnO4 (15 g) was added slowly while the temperature
of the mixture solution was maintained at <20°C. The mixed
solution was incubated in a 30°C water bath for 12 h to form a
thick paste. Subsequently, 150 ml distilled water was slowly added,
stirred vigorously, and allowed to react for a further 12 h in a
98°C water bath. A volume of 50 ml H2O2 (30%)
was added to the solution, altering the color of the solution from
brown to yellow. The mixture was rinsed and centrifuged for 5 min
(2,900 × g, 25°C) with HCl (5%) and distilled water numerous times
(until pH 7.0 was reached) to remove the
SO42−, KMnO4 and other residual
substances. The sediment was filtered out and dried in a 60°C
vacuum drying oven for 12 h. The GO was obtained as a solid black
film.
Synthesis of G-MoS2
composites
G-MoS2 composites were prepared using the
hydrothermal process (32,33). GO (60 mg) was dispersed in 20 ml
distilled water by ultrasonication (60 kHz, 55°C) for 1 h.
H24Mo7N6O24·4H2O
(26.5 mg) and C2H5NS (60 mg) were added to
the GO aqueous dispersion by ultrasonication for 30 min (60 kHz,
55°C) to form a homogeneous solution. The solution mixture was
transferred to a 100-ml Teflon-lined stainless steel autoclave and
heated in an electric oven at 200°C for 24 h. The autoclave was
naturally cooled to room temperature, and the black solid was
obtained by filtration, rinsing and centrifugation (2,900 × g, 5
min, 25°C) three times. The solid was subsequently dried in a −20°C
freeze-drying oven, with the obtained black solid samples denoted
as G-MoS2.
Element verification of
G-MoS2 composites
In order to verify that the G-MoS2
composites were successfully prepared, the morphologies of
G-MoS2 composites were characterized by a Low Vacuum
JSM-6510 field-emission scanning electron microscope (SEM) with
platinum as the sputter coating (20 kV, 1.18×10⁻³ Pa,
25°C). Briefly, 10 mg G-MoS2 was dispersed in 10 ml
absolute ethyl alcohol by ultrasonication (60 kHz, 55°C) for 30
min. Subsequently, the sample was dripped onto a silicon wafer,
dried, sprayed with platinum and detected using the SEM. The
elemental compositions of G-MoS2 composites were
recorded on a Hitachi/S-4800 elemental distribution spectrometer
(30 kV, dead-time: 92%) and a Rigaku Dmax/Ultima IV diffractometer
with monochromatized Cu Kα radiation (Kα/λ=0.15418 nm). To verify
whether the G-MoS2 composites prepared in the present
study were consistent with the standard graphene and
MoS2, the graphene of the G-MoS2 composites
was compared with a previous study (34) and MoS2 of the
G-MoS2 composites was compared with the Powder
Diffraction File card of MoS2 [Joint Committee on Powder
Diffraction Standards (JCPDS) file no. 17-744].
Preparation of the modified
electrode
The GCE was sequentially polished with 1.0, 0.3 and
0.05 µm alumina slurry on velvet. The residual alumina slurry was
rinsed off with distilled water, and the GCE was placed in
anhydrous ethanol and distilled water with ultrasonication (60 kHz,
55°C) for 10 min. The cleaned GCE was dried with an infrared lamp.
The G-MoS2 composite (30 mg) and Nafion solution (10 µl)
were dispersed in 15 ml anhydrous ethanol with ultrasonication (60
kHz, 55°C) for 30 min to obtain a homogenous suspension. The
G-MoS2-Nafion-modified electrode was prepared by casting
5 µl suspension onto the pretreated GCE, followed by drying with an
infrared lamp.
Catalytic activity evaluation of the
modified electrode
Firstly, the prepared GCE was placed in PBS (20 ml;
pH=7.4) for 10 min and the CV curve of PBS was determined. The GCE
was subsequently rinsed five times with distilled water and the GCE
was modified with G-MoS2-Nafion. The
G-MoS2-Nafion/GCE was placed in PBS for 2 h and the CV
curve of PBS was determined. Finally, 20, 40, 60, 80 and 100 µl UA
(100 mM) were added to the PBS. The resulting concentrations were
100, 200, 300, 400 and 500 µM, and their corresponding CV curves
were determined.
Specificity evaluation of the modified
electrode
The PBS was detected with the
G-MoS2-Nafion/GCE and a control LSV curve was obtained.
Subsequently, 10 µl NaOH (1.0 M), Glu (2.0 M), AA (0.1 M), DA (0.1
M) and UA (0.1 M) were added to the PBS and the interference LSV
curve was obtained.
Subsequently, an LSV assay was conducted for the
human serum samples to confirm whether there may be an effect of
other human serum components (including Glu, AA and DA) when
detecting the UA in human serum with the
G-MoS2-Nafion/GCE. PBS was initially detected with the
G-MoS2-Nafion/GCE and a reference LSV curve was
obtained. Subsequently, 4 ml PBS was removed and 4 ml of human
serum was added to the PBS. The mixed solution of PBS (16 ml) and
human serum (4 ml) was subsequently detected with the
G-MoS2-Nafion/GCE and the experimental LSV curve was
obtained.
Quantitative detection of human serum
UA with G-MoS2-Nafion/GCE
Compared with the CV and LSV electrochemical
analysis methods, i-t may be used to measure the average current
values of different concentrations of UA more easily, stably and
accurately. Therefore, i-t was selected to detect the UA in
solution and in human serum. The G-MoS2-Nafion/GCE was
placed in PBS (20 ml) for 500 sec, and 10 µl different
concentrations of UA solution were added into the PBS every 50
sec.
Methodology of the comparison
analysis
The UA quantitative detection of the mixed serum was
performed using a uricase colorimetric assay. The
G-MoS2-Nafion/GCE was placed in PBS (16 ml) for 500 sec
prior to detection of the mixed serum samples and 4 ml mixed serum
was subsequently added to the PBS. The average current intensity of
the mixed serum was measured. The UA concentration values of mixed
serum were obtained by the conversion of the calibration curve and
the linear correlation was determined. The results from UA
determination using uricase colorimetric assay and
G-MoS2-Nafion/GCE were further analyzed.
Recovery and repeatability analysis of
G-MoS2-Nafion/GCE
Following measurement of the current values of the
mixed serum with G-MoS2-Nafion/GCE, a further 10 ml UA
solution (100 mM) was added to the PBS immediately. The average
current intensity was recorded and the total UA concentration
values were obtained using the calibration curve. The
MoS2-Nafion/GCE was used to detect the UA solution (200
µM) 11 times.
Statistical analysis
All data are presented as the means ± standard
deviation of three experiments. The data were analyzed using SPSS
13.0 (SPSS Inc., Chicago, IL, USA) or GraphPad Prism 5.0 (GraphPad
Software, Inc., La Jolla, CA, USA). The relationship between two
variables was analyzed using linear regression. Comparison of the
results obtained by uricase colorimetric assay and
G-MoS2-Nafion/GCE were performed using Student's t-test
and one-way analysis of variance with Dunnett's post hoc test.
P<0.05 was considered to indicate a statistically significant
difference.
The precision test results were verified using
Grubbs' test. According to Grubbs' test, when the test is repeated
11 times, P=0.01 or 0.05 as long as the significance level is not
greater than the critical value (Ga. n=2.484 or 2.234), indicating
that the corresponding result is not an outlier. In addition,
according to the Health Industry Standards of the People's Republic
of China (http://www.nhfpc.gov.cn/zhuz/s9492/201301/c8dd48222ab14387a6503667be78bec3.shtml),
the precision of uric acid detection is considered acceptable when
the coefficient of variation <4.5%.
Results
Preparation of a good electrode
modified complex
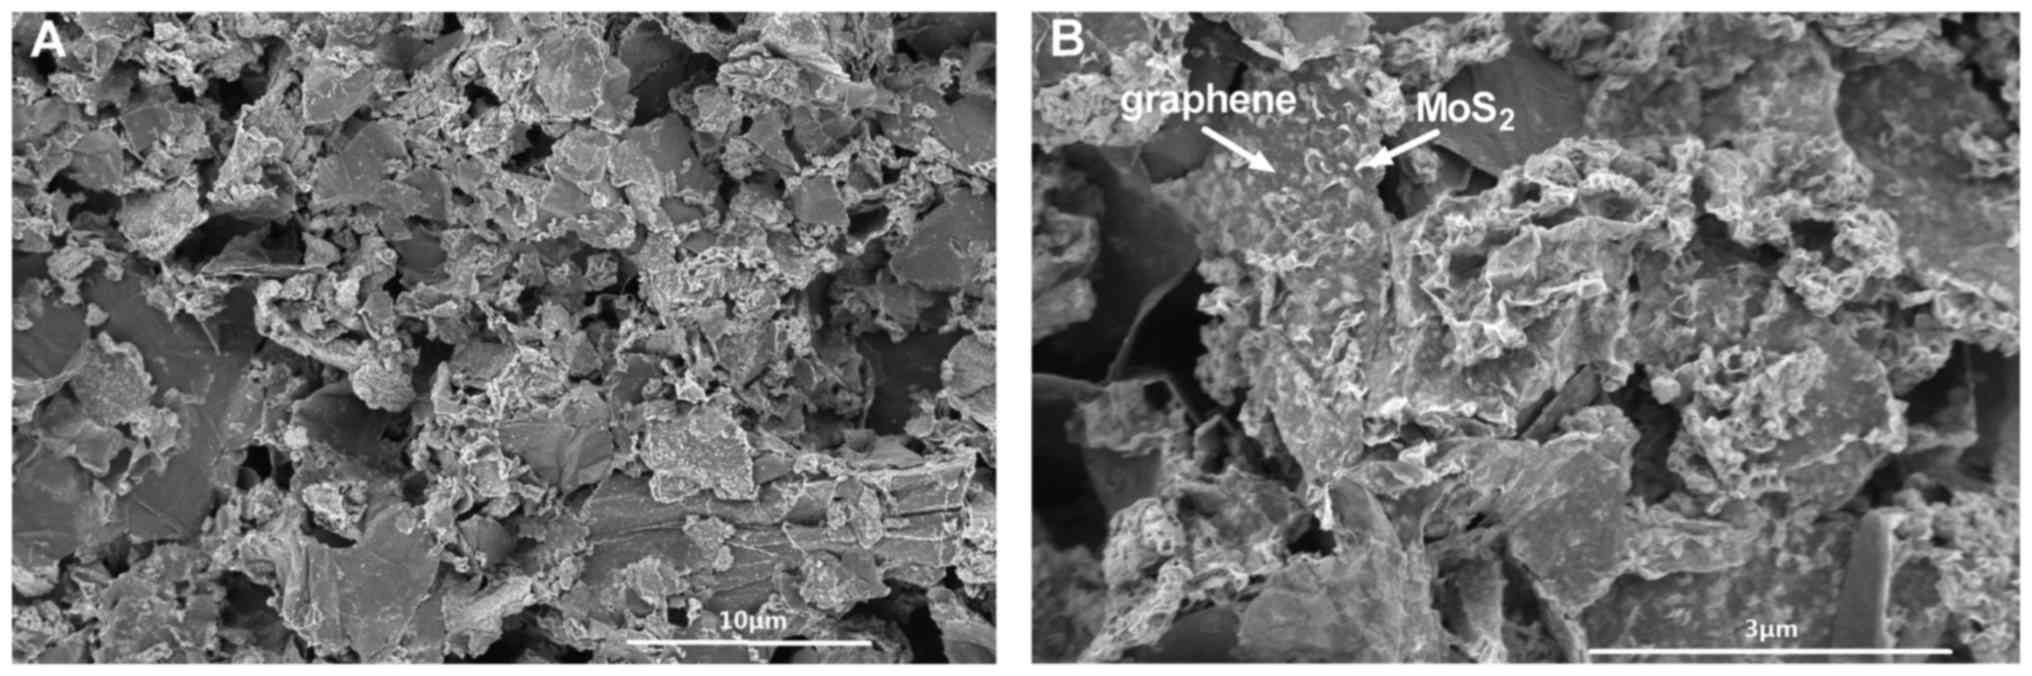
The morphology of G-MoS2 was
characterized by SEM (Fig. 1). The
MoS2 nanoparticles were densely loaded on the graphene
nanosheets, and the flexible graphene nanosheets with wrinkled
edges were randomly hybridized with MoS2 nanoparticles.
This structure facilitates a good connection and close contact
between the graphene and MoS2, thus increasing the
contact area with the analytes.
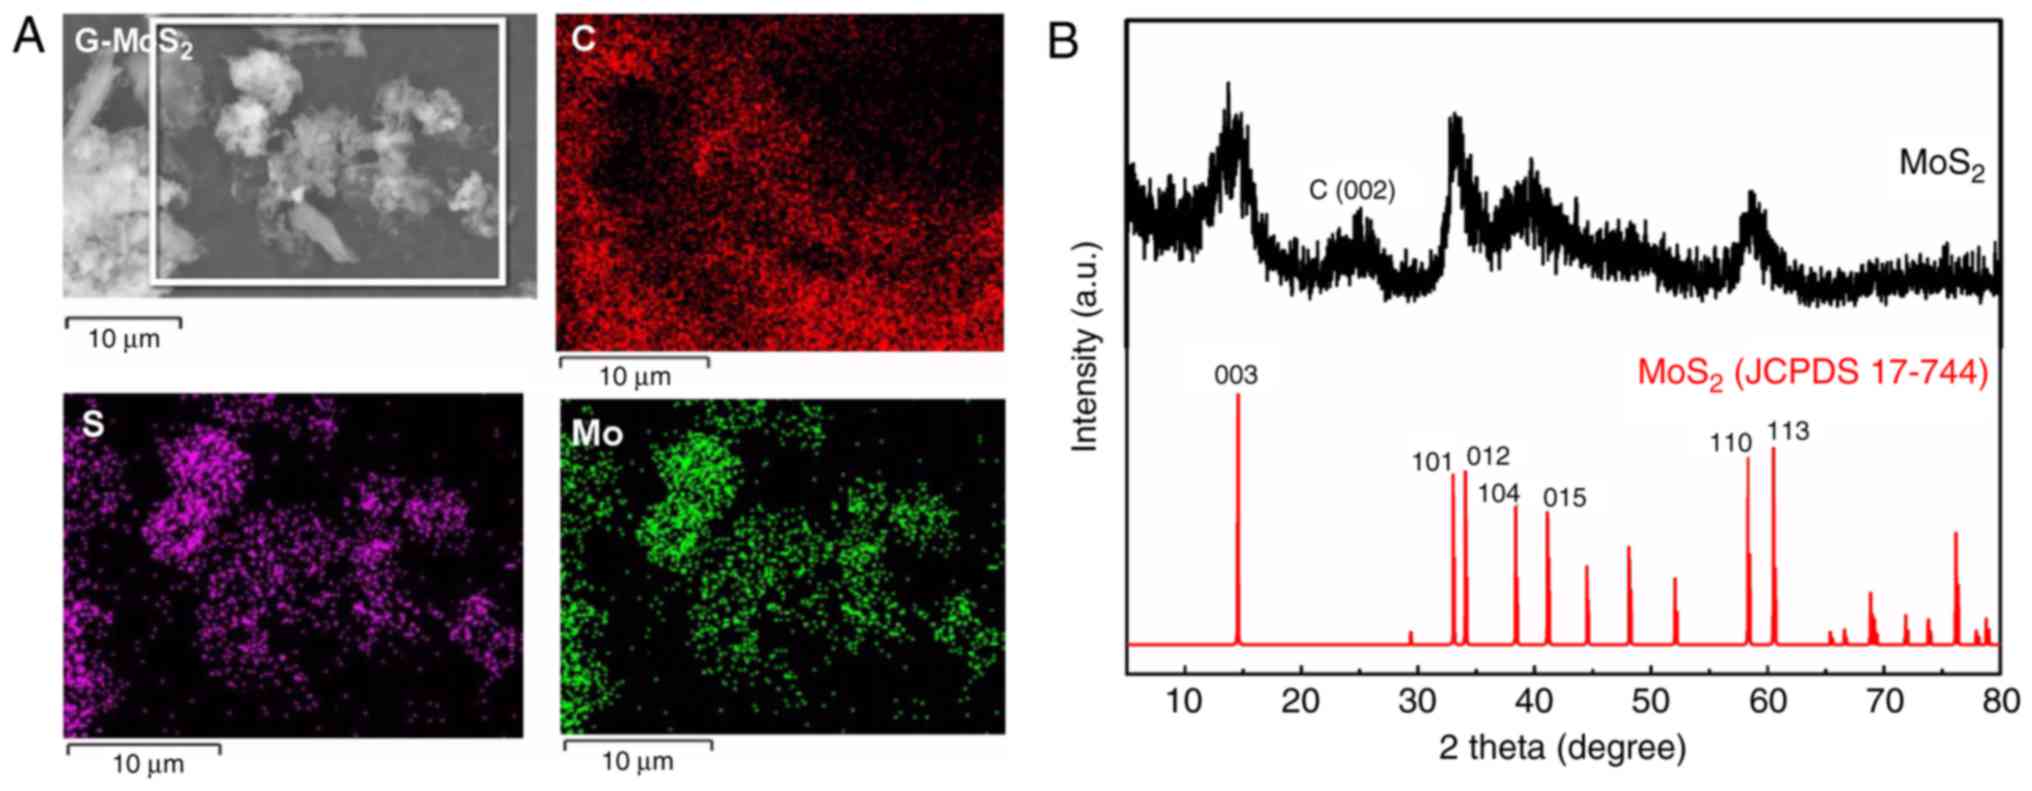
The elemental composition of G-MoS2 was
analyzed using an EDS (Fig. 2A).
The carbon elements of graphene were evenly distributed on the
graphene nanosheets. The molybdenum elements and sulfur elements of
MoS2 were distributed in the corresponding positions of
MoS2 nanoparticles, and the G-MoS2 composite
contained no other elements except carbon, molybdenum and sulfur.
This indicated that G-MoS2 composites were successfully
synthesized.
XRD testing was conducted to examine the crystalline
characteristics of G-MoS2 (Fig. 2B). The characteristic diffraction
peak of graphene may be identified at 25°, which corresponds to C
(002), and this is consistent with a previous study (34). The MoS2 demonstrated its
characteristic diffraction peaks when compared with the Powder
Diffraction File card of MoS2 (JCPDS file no. 17-744)
and no other miscellaneous peaks were observed. The diffraction
peaks of MoS2 at 14.5, 32.8, 34.2, 38.2, 41.1, 58.2 and
60.4°, were consistent with the (003), (101), (012), (104), (015),
(110) and (113) crystal planes of MoS2 (JCPDS file no.
17-744), respectively, indicating that the G-MoS2
composites synthesized in the present study contained a high purity
of graphene and MoS2.
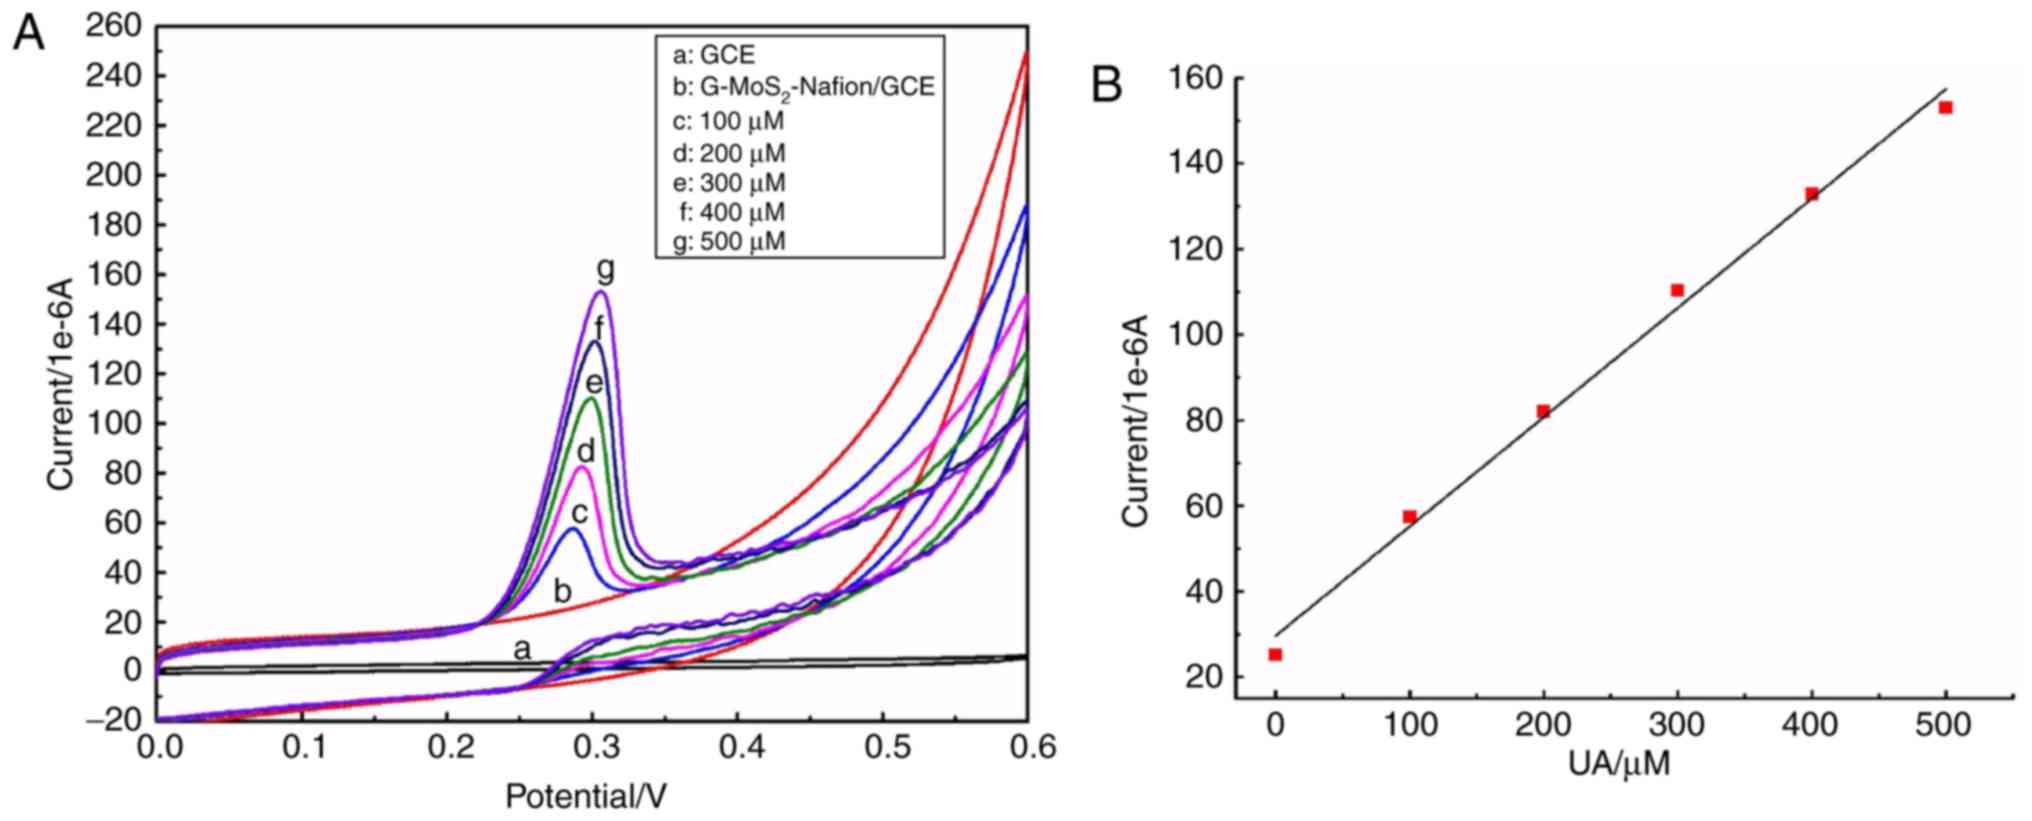
G-MoS2-Nafion/GCE has a
good electrochemical catalytic activity for UA
The electrochemical catalytic activity of the
G-MoS2-Nafion/GCE with the addition of different
concentrations of UA was assessed (Fig. 3A). No current intensity alteration
or any characteristic peak was observed in the CV curve ‘a’, which
was within the potential range of 0–0.6 V, suggesting that no
electrochemical reaction occurred on the GCE alone. An increased
current intensity was observed in the CV curve ‘b’; however, no
oxidation or reduction peak was observed, indicating that although
the conductivity of the G-MoS2-Nafion/GCE was enhanced
compared with the naked GCE, there was no electrochemical reaction
occurring on the G-MoS2-Nafion/GCE. When different
concentrations of UA were added into PBS, reduction peaks appeared
between 0.28 and 0.32 V, and the reduction current intensity
increased gradually as the concentration of UA increased in PBS. As
there were no marked oxidation peaks in the CV curves of ‘c-g’, it
suggested that electrochemical catalytic activity of UA occurring
on the G-MoS2-Nafion/GCE could be monitored.
When the UA concentration was fitted with the
corresponding current intensity, as demonstrated in Fig. 3B, the oxidation current intensity
increased with the enhancement of the UA concentration, exhibiting
a strong linear correlation (y=0.256×+29.63;
R2=0.9931).
AA, DA and other components did not
interfere with the electrochemical catalytic reaction between
G-MoS2 and UA
Fig. 4A
demonstrated that only electrochemical oxidation reactions of AA,
DA and UA occurred at the G-MoS2-Nafion/GCE, and the
corresponding potential values of their reduction peaks are −0.04,
0.16 and 0.29 V, which suggests that the reduction peaks of AA, DA
and UA were distinct from each other. The reduction peak current
intensities of DA and UA were markedly higher compared with AA.
Nafion may enhance the adhesion of G-MoS2 composites on
the GCE surface, extend the G-MoS2-Nafion/GCE service
life and have a shielding effect towards the anion. Therefore, the
Nafion may significantly reduce the electrochemical oxidation
reaction of AA that occurs on the G-MoS2-Nafion/GCE
(35).
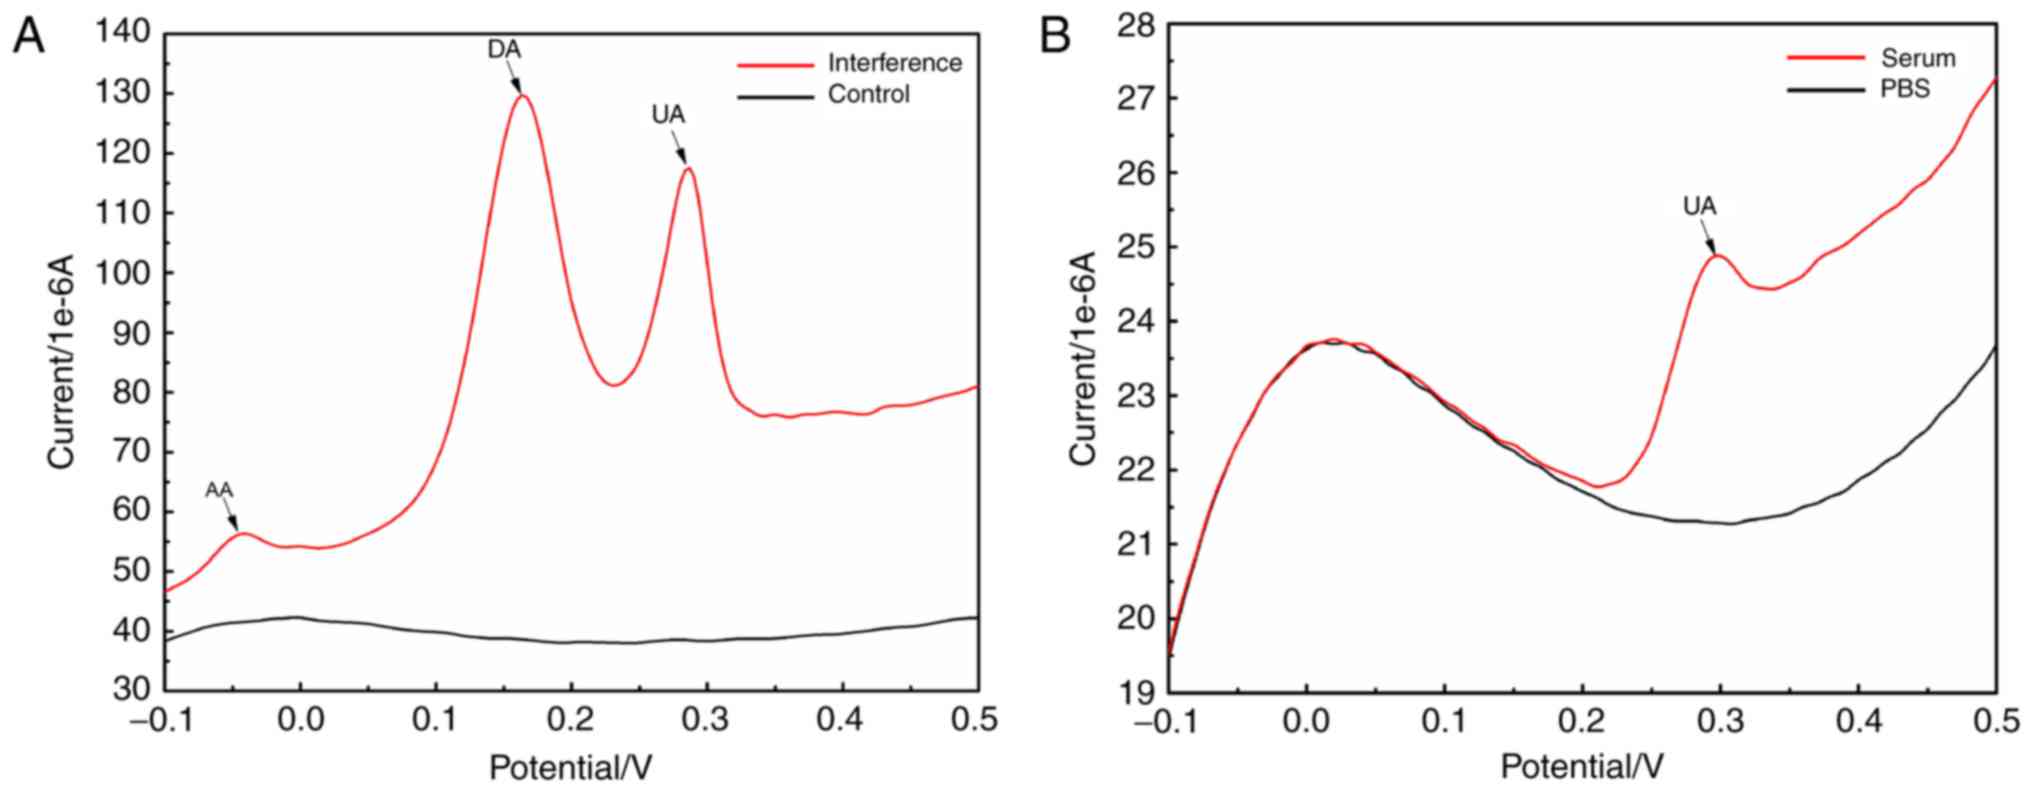 | Figure 4.Interference test of the
electrochemical catalytic reaction between G-MoS2 and
UA. (A) LSV electrochemical behavior of
G-MoS2-Nafion/GCE in PBS, which contains glucose, NaOH,
ascorbic acid, DA and UA (scan rate, 0.1 V/sec). (B) LSV
electrochemical behavior of PBS and human serum (scan rate, 0.1
V/sec). LSV, linear sweep voltammetry; G-MoS2,
graphene-molybdenum disulfide; GCE, glassy carbon electrode; DA,
dopamine; UA, uric acid. |
As shown in Fig.
4B, only the UA reduction peak (potential, 0.29 V) was
observed, and no other marked reduction peaks were observed at the
potential locations of AA (−0.04 V) or DA (0.16 V) compared with
the reference LSV curve. This indicates that the
G-MoS2-Nafion/GCE had a good selectivity for the
determination of UA in human serum.
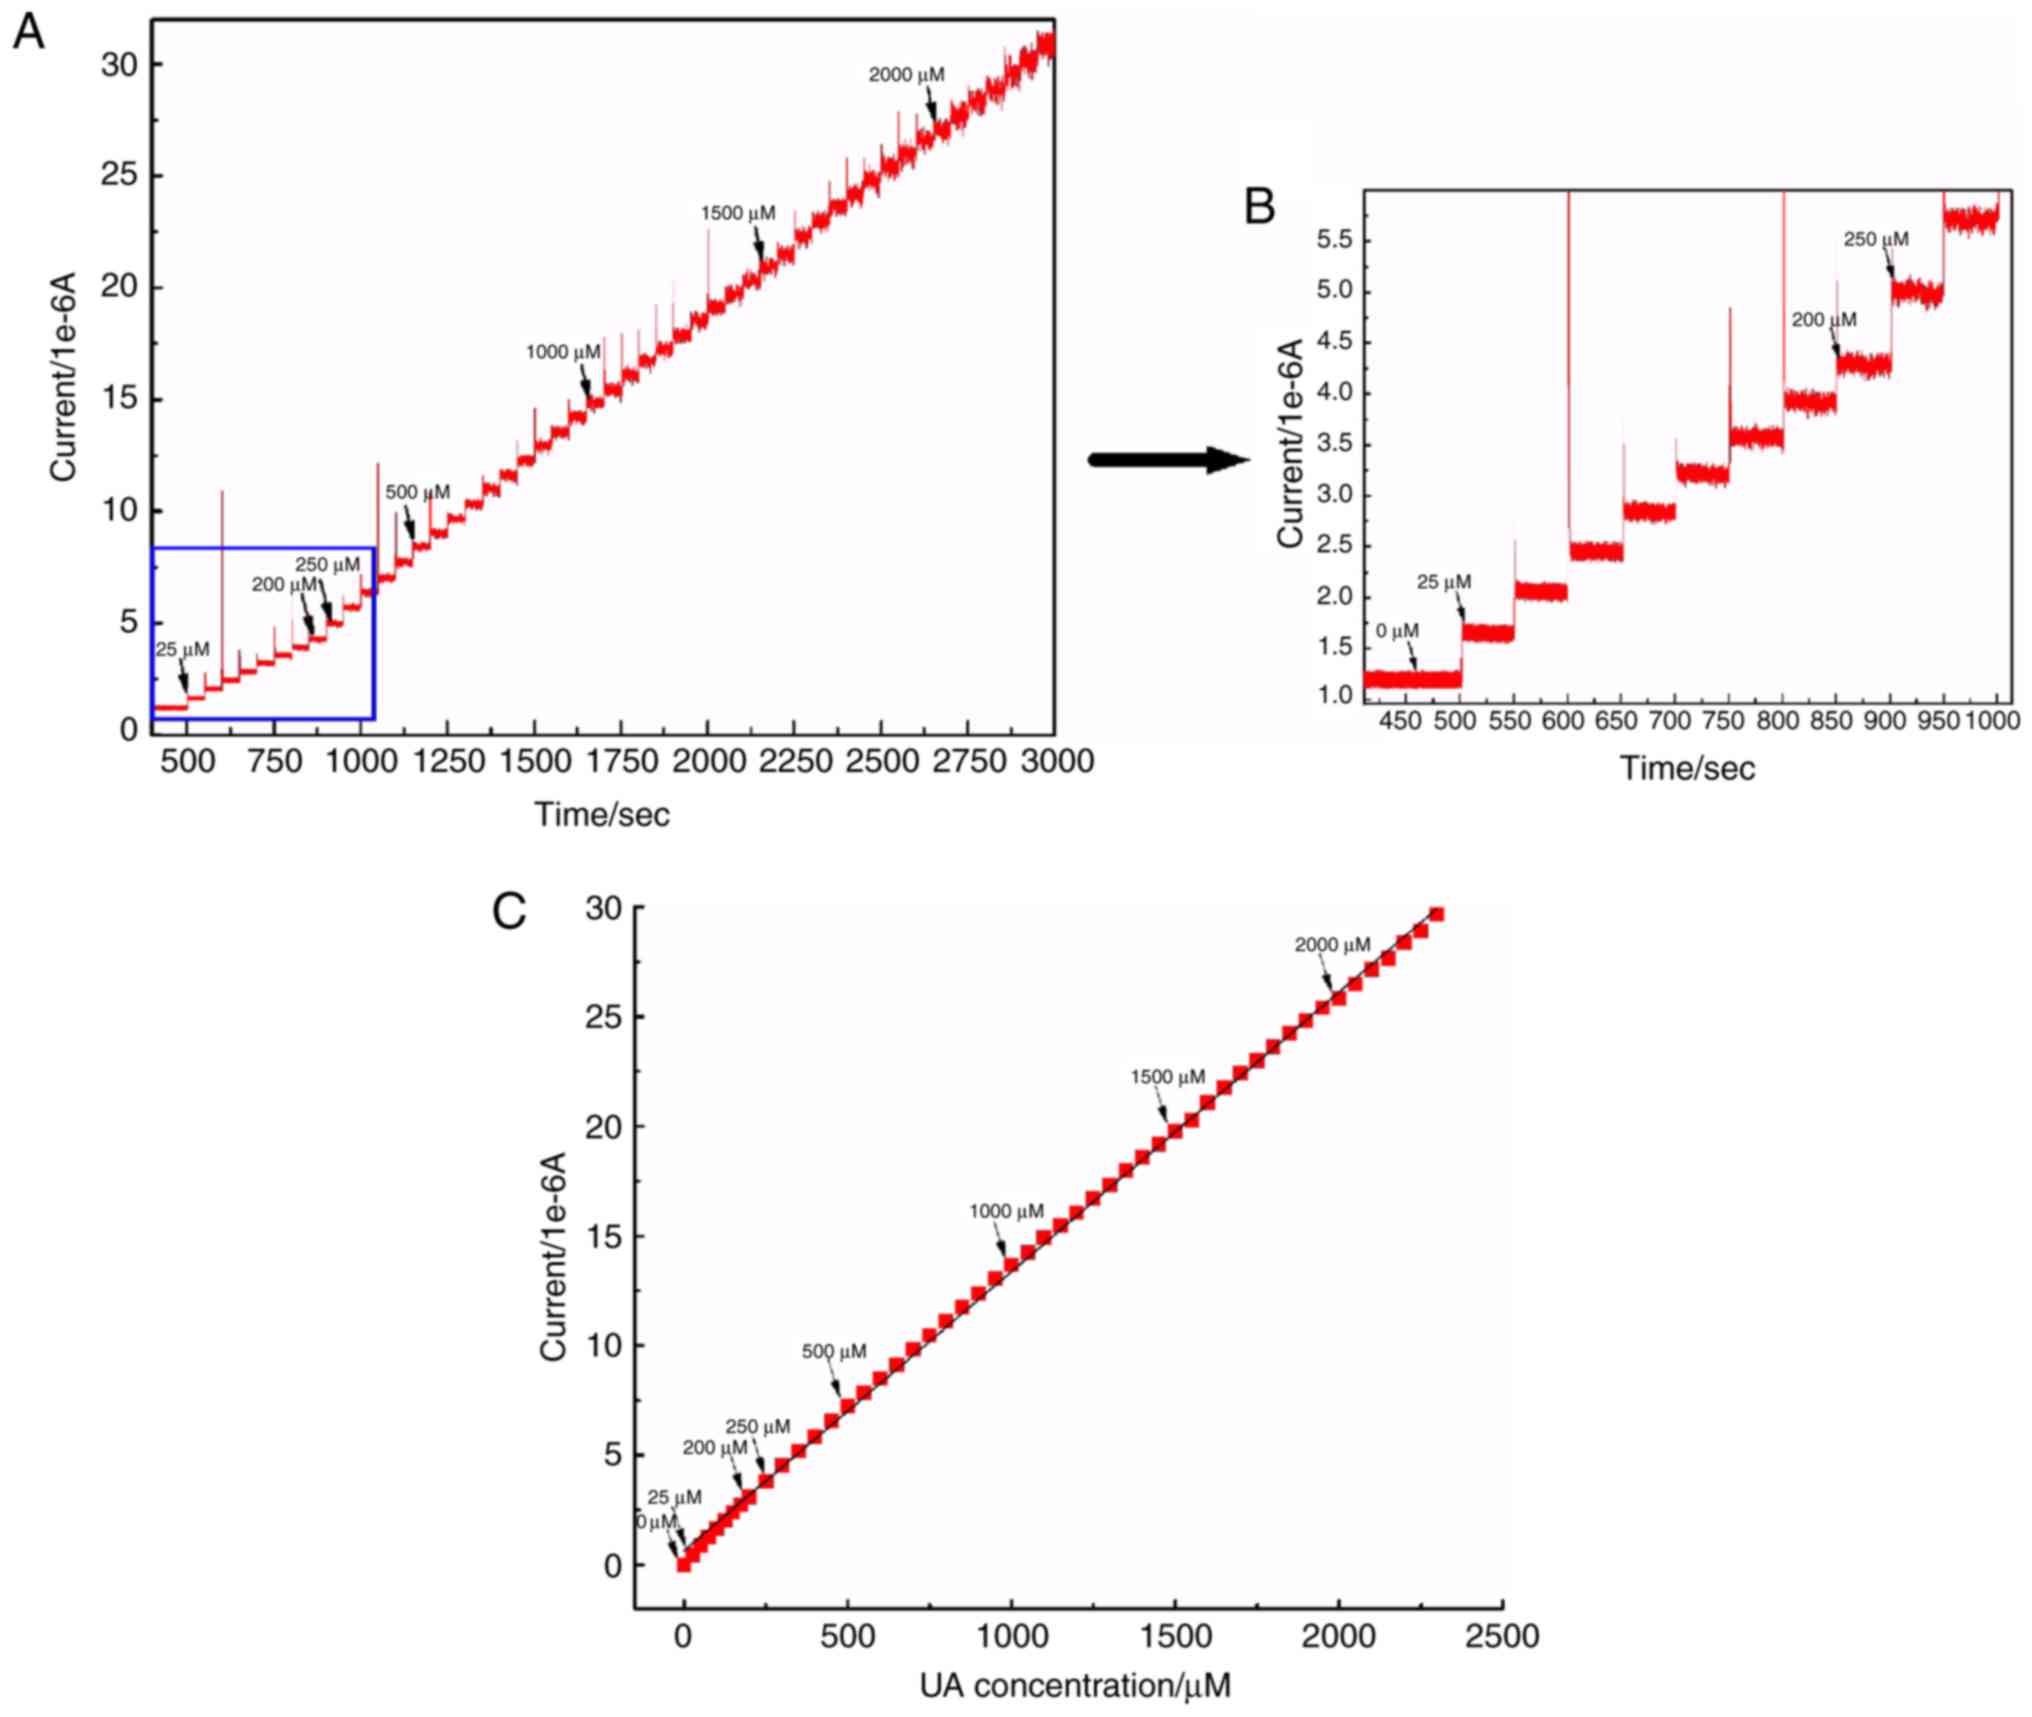
G-MoS2-Nafion/GCE has a
good performance for the determination of UA
The calibration i-t curve of UA is demonstrated in
Fig. 5A. With each addition of UA
(50 µM) an obvious and uniform current change was observed on the
i-t curve (Fig. 5B). The linear
correlation between different concentrations of UA and their
corresponding current values is demonstrated in Fig. 5C.
As indicated in Fig.
5 that the current values increased with an increase in the UA
concentration, and there was a linear correlation between them
(y=0.012×+0.645; R2=0.998). Furthermore, the minimum
detectable value was 13.91 µM (signal-to-noise ratio: S/N=3), and
the linear correlation between the concentration of UA and current
values was between 25 and 3,000 mM. This suggested that
G-MoS2-Nafion/GCE had a high sensitivity and wide linear
range for the determination of UA.
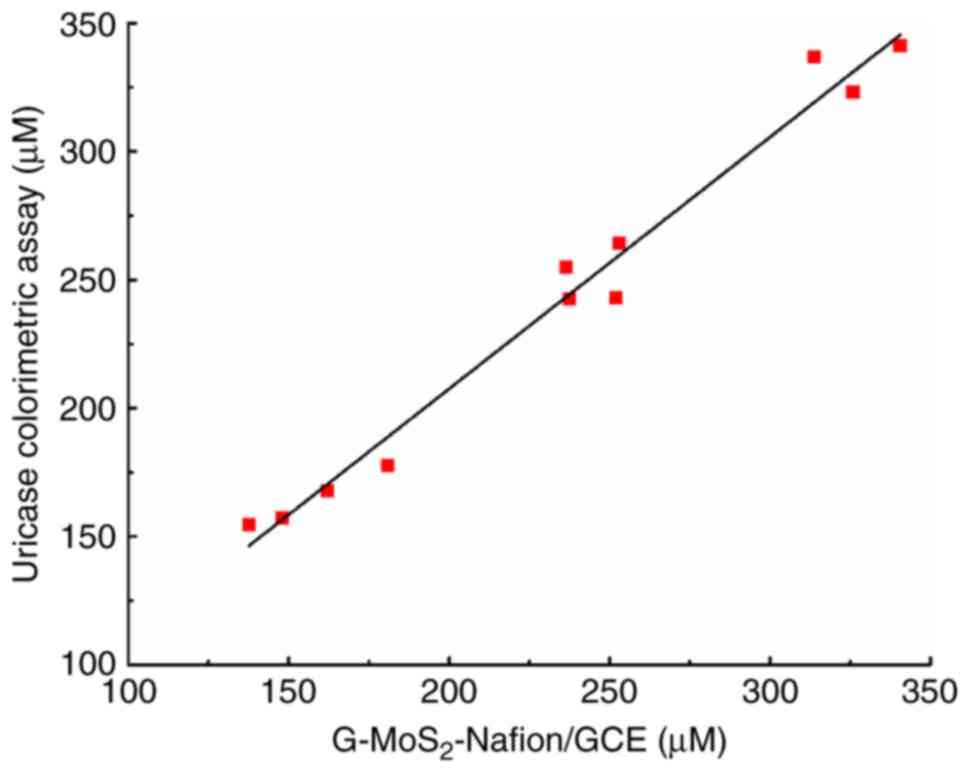
Serum UA determined by uricase
colorimetric assay and G-MoS2-Nafion/GCE have a high
degree of correlation
The UA concentration of the mixed serum was detected
by a uricase colorimetric assay and G-MoS2-Nafion/GCE
(Table I). The correlation between
the two methods is shown in Fig.
6, which demonstrated that there was a good linear correlation
between them (y=0.9802×+11.494; R2=0.978).
 | Table I.Concentration values of serum uric
acid detected by uricase colorimetric assay and
G-MoS2-Nafion/GCE (n=11). |
Table I.
Concentration values of serum uric
acid detected by uricase colorimetric assay and
G-MoS2-Nafion/GCE (n=11).
| Serum sample | Uricase
colorimetric assay, µM |
G-MoS2-Nafion/GCE, µM |
|---|
| 1 | 154.5 | 137.6 |
| 2 | 243.1 | 252.0 |
| 3 | 341.2 | 340.6 |
| 4 | 167.9 | 162.1 |
| 5 | 254.8 | 236.5 |
| 6 | 177.8 | 180.9 |
| 7 | 264.1 | 253.0 |
| 8 | 323.1 | 325.9 |
| 9 | 157.3 | 148.0 |
| 10 | 242.5 | 237.5 |
| 11 | 336.8 | 313.8 |
Detection of UA by
G-MoS2-Nafion/GCE is accurate and precise
In order to verify the accuracy and precision of
using the working electrode prepared in the present study to detect
human serum UA, recovery and repeatability analysis was conducted,
respectively. As shown in Table
II, with an average recovery rate of 95.28%,
G-MoS2-Nafion/GCE had a high accuracy for the detection
of UA. Therefore, as demonstrated in Table III, no outlier value existed in
the present study. Furthermore, the coefficient of variation was
2.04% (<4.5%), which suggested that the
G-MoS2-Nafion/GCE used in the present study also had an
acceptable precision for UA determination.
| Table II.Recovery rate of serum uric acid
measured by graphene-molybdenum disulfide-Nafion/glassy carbon
electrode (n=11). |
Table II.
Recovery rate of serum uric acid
measured by graphene-molybdenum disulfide-Nafion/glassy carbon
electrode (n=11).
| Serum sample | Basic found,
µM | Added, µM | Total found,
µM | Recovery
valuea, µM | Recovery
rateb, % |
|---|
| 1 | 137.6 | 200.0 | 324.2 | 186.6 | 93.3 |
| 2 | 252.0 | 200.0 | 448.0 | 196.0 | 98.0 |
| 3 | 340.6 | 200.0 | 536.6 | 196.0 | 98.0 |
| 4 | 162.1 | 200.0 | 345.5 | 183.4 | 91.7 |
| 5 | 236.5 | 200.0 | 427.1 | 190.6 | 95.3 |
| 6 | 180.9 | 200.0 | 371.1 | 190.2 | 95.1 |
| 7 | 253.0 | 200.0 | 443.0 | 190.0 | 95.0 |
| 8 | 325.9 | 200.0 | 518.9 | 193.0 | 96.5 |
| 9 | 148.0 | 200.0 | 334.8 | 186.8 | 93.4 |
| 10 | 237.5 | 200.0 | 428.5 | 191.0 | 95.5 |
| 11 | 313.8 | 200.0 | 506.4 | 192.6 | 96.3 |
| Average value | – | – | – | 190.56 | 95.28 |
| Table III.Precision analysis of UA detected by
graphene-molybdenum disulfide-Nafion/glassy carbon electrode
(n=11). |
Table III.
Precision analysis of UA detected by
graphene-molybdenum disulfide-Nafion/glassy carbon electrode
(n=11).
| Test no. | UA value, µM | Significance
level |
|---|
| 1 | 186.6 | 1.02 |
| 2 | 196.0 | 1.40 |
| 3 | 196.0 | 1.40 |
| 4 | 183.4 | 1.84 |
| 5 | 190.6 | 0.01 |
| 6 | 190.2 | 0.09 |
| 7 | 190.0 | 0.14 |
| 8 | 193.0 | 0.63 |
| 9 | 186.8 | 0.97 |
| 10 | 191.0 | 0.11 |
| 11 | 192.6 | 0.52 |
| Average value | 190.56 | – |
| SD | 3.89 | – |
| CV (100%) | 2.04 | – |
Discussion
At present, the primary methods of preparing GO
include the improved Hummers, Brodie and Staudenmaier methods
(36–38). The modified Hummers method, used in
the present study, is one of the most important methods of
preparing GO due to its advantages, including a simple and fast
reaction process, and a safer operation compared with other
methods. The GO synthesized using the improved Hummers method is
rich in oxygen-containing functional groups that contribute to the
complex structure of GO. This special structure is beneficial to
allow graphene to combine closely with other materials.
The primary methods used for G-MoS2
synthesis include three types of methods: Hydrothermal synthesis;
chemical vaporous deposition; and automatic liquid assembly
(39–41). The hydrothermal synthesis method,
which was used in the present study, is an effective method of
synthesizing a more compact structure of G-MoS2. This
method additionally has the advantages of mild reaction conditions,
simple operation, less environmental pollution and low cost, and
the morphology of the synthetic materials may be controlled easily.
The morphology, size and structure of the materials may be
controlled by altering the conditions of the reaction (42). Under conditions of high temperature
and high pressure, due to the effect of electrostatic attraction,
the molybdate is adsorbed onto the surface of GO and reacts with
sulfur to form MoS2. Simultaneously, the GO is
additionally reduced and transformed into graphene by removing its
oxygen-containing groups gradually, and the graphene continues to
react with MoS2 to form G-MoS2 composites
(43,44). In this reaction process, GO acts as
a template for the hydrothermal reaction. It provides a good
foundation for improving the compactness, avoiding defects and
preserving the advantages of MoS2 and graphite.
Based on the above principles, the improved Hummers
and hydrothermal synthesis methods were selected in the present
study to prepare an electrochemical biosensor, which was derived
from the graphite and MoS2 composite, for the
determination of UA in human serum. The present study suggested
that the G-MoS2-Nafion/GCE had catalytic oxidation
activity towards AA, DA and UA; however, the catalytic efficiencies
for UA and DA were markedly improved compared with AA. Nafion may
not enhance the adhesion of G-MoS2 composites, and may
additionally restrain the oxidation or reduction reactions of
negatively charged substances, including AA, at the
G-MoS2-Nafion/GCE surface.
The present study demonstrated that the reduction
peaks of AA, DA and UA may be well-separated, and only the UA
reduction peak was detected by the G-MoS2-Nafion/GCE in
the human serum samples. This suggested that the method had high
specificity for the determination of UA in human serum.
Furthermore, the UA concentration had a linear correlation with its
corresponding current intensity, a wide linear range and a high
sensitivity (the minimum detectable value was 13.91 µM; S/N=3) for
the determination of UA. The values of human serum UA, measured
using the G-MoS2-Nafion/GCE and an uricase colorimetric
assay, had a positive correlation. The average recovery rate of UA
detected with G-MoS2-Nafion/GCE was 95.28%, indicating
that the electrochemical method used in the present study had a
high accuracy for the detection of UA. Additionally, the
repeatability tests demonstrated that the electrochemical method
had a high precision for the detection of UA.
Although an electrode modifier for serum UA
detection was successfully identified, there remain certain
limitations to the present research. The feasibility of
G-MoS2-Nafion/GCE for the detection of human serum UA
was analyzed; however, the specific electrochemical catalytic
reaction of UA at the G-MoS2-Nafion/GCE electrode was
not discussed. Additionally, the different LSV curves of human
serum samples and mixed PBS solutions, which contained AA, DA and
UA, in the feasibility analysis may be further examined in future
studies. The number of mixed serum samples tested in the
comparative analysis of serum UA by uricase colorimetric assay and
i-t electrochemical method was low (only 11 cases). Furthermore,
the concentration range of serum UA was slightly narrow in the
present study. The average recovery rate of UA detected using the
G-MoS2-Nafion/GCE was <100%, suggesting that there
was a systemic error in the method. The systemic error may be
caused by the fact that the G-MoS2-Nafion in the present
study was a laboratory-synthesized composite, thus the dampening
effect on the electrochemical catalytic ability was unavoidable. In
addition, the equivalent amount of UA was added in the recovery
analysis, thus, the accuracy of the analysis of the
G-MoS2-Nafion/GCE may not be verified in numerous
directions. Finally, there was only one concentration of UA
standard solution selected in the precision analysis, which does
not cover all of the low, medium and high concentrations.
Additionally, the number of repeated measurements was <20, thus
the precision of the G-MoS2-Nafion/GCE may not be fully
verified at present. Therefore, improvements to the experiments to
evaluate the performance of the G-MoS2-Nafion/GCE for
the detection of human serum UA is required in future studies.
Nafion, which was contained in the
G-MoS2-Nafion composites, may inhibit the
electrochemical reduction reaction of AA. Therefore, it may be
speculated that if another material was identified that had the
ability to enhance the adhesion of G-MoS2, and to not
affect the catalytic efficiency of G-MoS2 composites
towards AA, DA and UA, the simultaneous detection of AA, DA and UA
may be possible in the future.
In conclusion, the present study indicated that
G-MoS2-Nafion composites may be used as an
electrochemical catalytic material for the detection of UA in human
serum. Compared with other methods for the determination of UA
(including enzymology, points spectrophotometry, high performance
liquid phase chromatography and electrochemical chemiluminescence
analysis), it has the characteristics of accuracy, high
sensitivity, a wide linear range, fast detection, strong
anti-interference properties, low cost, a simple preparation
process, reusability and being environmentally friendly.
Furthermore, human serum samples may be measured immediately
without any other treatment following centrifugation. Therefore,
the G-MoS2-Nafion composite or its improved analogs as
electrochemical catalysts for the determination of human serum UA
has good clinical application prospects.
Acknowledgements
The authors thank Professor Jing Jiang from China
West Normal University (Nanchong, China) for his assistance with
the data analysis.
Funding
The present study was supported by grants from The
National Natural Science Foundation of China (grant no. 81641096),
the Department of Science and Technology of Sichuan Province (grant
no. 2016JY0171) and International S&T Cooperation Program of
China (grant no. 2015DFA30420).
Availability of data and materials
The datasets used and/or analyzed during the
current study are available from the corresponding author on
reasonable request.
Authors' contributions
BY and DW designed the research and drafted the
manuscript. XL and QD acquired, analyzed and interpreted the data,
and performed statistical analysis. QW and QL prepared the figures.
XJ and JZ diagnosed the patients and provided treatment information
of hyperuricemia, and also helped improve the experimental design.
XG and YX performed the element verification of G-MoS2 composites
and revised the manuscript for important intellectual content. All
authors read and approved the final manuscript.
Ethics approval and consent to
participate
The present study was approved by the Ethics
Committee of the Affiliated Hospital of North Sichuan Medical
College (Nanchong, China). Written informed consent was obtained
from all patients.
Patient consent for publication
All patients involved in the present study provided
consent for publication.
Competing interests
The authors declare that they have no competing
interests.
References
|
1
|
Popa E, Kubota Y, Tryk DA and Fujishima A:
Selective voltammetric and amperometric detection of uric acid with
oxidized diamond film electrodes. Anal Chem. 72:1724–1727. 2000.
View Article : Google Scholar : PubMed/NCBI
|
|
2
|
Cardoso AS, Gonzaga NC, Medeiros CC and
Carvalho DF: Association of uric acid levels with components of
metabolic syndrome and non-alcoholic fatty liver disease in
overweight or obese children and adolescents. Pediatr. 89:412–418.
2013. View Article : Google Scholar
|
|
3
|
Gabison L, Chiadmi M, Colloc'h N, Castro
B, El Hajji M and Prangé T: Recapture of [S]-allantoin, the product
of the two-step degradation of uric acid, by urate oxidase. FEBS
Lett. 580:2087–2091. 2006. View Article : Google Scholar : PubMed/NCBI
|
|
4
|
Filisetti-Cozzi TM and Carpita NC:
Measurement of uric acids without interference from neutral sugars.
Anal Biochem. 197:157–162. 1991. View Article : Google Scholar : PubMed/NCBI
|
|
5
|
Inoue K, Namiki T, Iwasaki Y, Yoshimura Y
and Nakazawa H: Determination of uric acid in human saliva by
high-performance liquid chromatography with amperometric
electrochemical detection. J Chromatogr B Analyt Technol Biomed
Life Sci. 785:57–63. 2003. View Article : Google Scholar : PubMed/NCBI
|
|
6
|
Novoselov KS, Geim AK, Morozov SV, Jiang
D, Zhang Y, Dubonos SV, Grigorieva IV and Firsov AA: Electric field
effect in atomically thin carbon films. Science. 306:666–669. 2004.
View Article : Google Scholar : PubMed/NCBI
|
|
7
|
Sun CC, Luo FF, Wei L, Lei M, Li GF, Liu
ZL, LE WD and Xu PY: Association of serum uric acid levels with the
progression of Parkinson's disease in chinese patients. Chin Med J
(Engl). 125:583–587. 2012.PubMed/NCBI
|
|
8
|
Li S, Qian T, Wu S and Shen J:
Controllable fabrication of polystyrene/graphene core-shell
microspheres and its application in high-performance
electrocatalysis. Chem Commun (Camb). 48:7997–7999. 2012.
View Article : Google Scholar : PubMed/NCBI
|
|
9
|
Zen JM and Chen PJ: A selective
voltammetric method for uric acid and dopamine detection using
clay-modified electrodes. Anal. Chem. 69:5087–5093. 1997.
|
|
10
|
Geim AK and Novoselov KS: The rise of
grapheme. Nat Mater. 6:183–191. 2007. View Article : Google Scholar : PubMed/NCBI
|
|
11
|
Service RF: Carbon sheets an atom thick
give rise to graphene dreams. Science. 324:875–877. 2009.
View Article : Google Scholar : PubMed/NCBI
|
|
12
|
Kim KS, Zhao Y, Jang H, Lee SY, Kim JM,
Kim KS, Ahn JH, Kim P, Choi JY and Hong BH: Large-scale pattern
growth of graphene films for stretchable transparent electrodes.
Nature. 457:706–710. 2009. View Article : Google Scholar : PubMed/NCBI
|
|
13
|
Lee C, Wei X, Kysar JW and Hone J:
Measurement of the elastic properties and intrinsic strength of
monolayer graphene. Science. 321:385–388. 2008. View Article : Google Scholar : PubMed/NCBI
|
|
14
|
Chen JH, Jang C, Xiao S, Ishigami M and
Fuhrer MS: Intrinsic and extrinsic performance limits of graphene
devices on SiO2. Nat Nanotechnol. 3:206–209. 2008. View Article : Google Scholar : PubMed/NCBI
|
|
15
|
Balandin AA, Ghosh S, Bao W, Calizo I,
Teweldebrhan D, Miao F and Lau CN: Superior thermal conductivity of
single-layer graphene. Nano Lett. 8:902–907. 2008. View Article : Google Scholar : PubMed/NCBI
|
|
16
|
Wang Y, Huang Y, Song Y, Zhang X, Ma Y,
Liang J and Chen Y: Room-temperature ferromagnetism of graphene.
Nano Lett. 9:220–224. 2009. View Article : Google Scholar : PubMed/NCBI
|
|
17
|
Stepnowski P, Müller A, Behrend P, Ranke
J, Hoffmann J and Jastorff B: Reversed-phase liquid chromatographic
method for the determination of selected room-temperature ionic
liquid cations. J Chromatogr A. 993:173–178. 2003. View Article : Google Scholar : PubMed/NCBI
|
|
18
|
Ruiz-Angel MJ and Berthod A: Reversed
phase liquid chromatography of alkyl-imidazolium ionic liquids. J
Chromatogr A. 1113:101–108. 2006. View Article : Google Scholar : PubMed/NCBI
|
|
19
|
Yang H, Zhang Q, Shan C, Li F, Han D and
Niu L: Stable, conduetive supramolecular composite of graphene
sheets with conjugated polyelectrolyte. Langmuir. 26:6708–6712.
2010. View Article : Google Scholar : PubMed/NCBI
|
|
20
|
Niyogi S, Bekyarova E, Itkis ME,
McWilliams JL, Hamon MA and Haddon RC: Solution properties of
graphite and graphene. Am Chem Soc. 128:7720–7721. 2006. View Article : Google Scholar
|
|
21
|
Liu WW and Wang JN: Direct exfoliation of
graphene in organic solvents with addition of NaOH. Chem Commun.
47:6888–6890. 2011. View Article : Google Scholar
|
|
22
|
Balendhran S, Ou JZ, Bhaskaran M, Sriram
S, Ippolito S, Vasic Z, Kats E, Bhargava S, Zhuiykov S and
Kalantar-Zadeh K: Atomically thin layers of MoS2 via a two step
thermal evaporation-exfoliation method. Nanoscale. 4:461–466. 2012.
View Article : Google Scholar : PubMed/NCBI
|
|
23
|
Stephenson T, Li Z, Olsen B and Mitlin D:
Lithium ion battery applications of molybdenum disulfide (MoS2)
nanocomposites. Energ Environ Sci. 7:209–231. 2014. View Article : Google Scholar
|
|
24
|
Viemeusel B, Schneider T, Tremmel S,
Wartzack S and Gradt T: Humidity resistant MoS2 coatings deposited
by unbalanced magnetron sputtering. Surf Coat Tech. 235:97–107.
2013. View Article : Google Scholar
|
|
25
|
Viet Hung, pHam, Kwang-Hyun Kim, Dong-won
Jung, Pham VH, Kim KH, Jung DW, Singh K, Oh ES and Chung JS: Liquid
phase co-exfoliated MoS2-graphene composites as anode materials for
lithium ion batteries. J Power Sources. 244:280–286. 2013.
View Article : Google Scholar
|
|
26
|
Sun MY, Adjaye J and Nelson AE:
Theoretical investigations of the structures and properties of
molybdenum-based sulfide catalysts. Applied Catalysis A.
263:131–143. 2004. View Article : Google Scholar
|
|
27
|
Chen J, Kuriyama N, Yuan H, Takeshita HT
and Sakai T: Electrochemical hydrogen storage in MoS2 nanotubes. J
Am Chem Soc. 123:11813–11814. 2001. View Article : Google Scholar : PubMed/NCBI
|
|
28
|
Hua KH, Hua XG and Sun XJ: MorpHological
effect of MoS2 nanoparticles on catalytic oxidation and vacuum
lubrication. Applied Sur Sci. 256:2517–2523. 2010. View Article : Google Scholar
|
|
29
|
Xiao J, Choi DW, Cosimbescu L, Koech P,
Liu J and Lemmon JP: Exfoliated MoS2 nanocomposite as an anode
material for lithium ion batteries. Chem. Mater. 22:4522–4524.
2010.
|
|
30
|
Du G, Guo Z, Wang S, Zeng R, Chen Z and
Liu H: Superior stability and high capacity of restacked molybdenum
disulfide as anode material for lithium ion batteries. Chem Commun
(Camb). 46:1106–1108. 2010. View Article : Google Scholar : PubMed/NCBI
|
|
31
|
Chen CM, Yang QH, Yang YG, Lv W, Wen Y,
Hou PX, Wang M and Cheng HM: Self-assembled free-standing graphite
oxide membrane. Adv Mater. 21:3007–3011. 2009. View Article : Google Scholar
|
|
32
|
Li Y, Wang H, Xie L, Liang Y, Hong G and
Dai H: MoS2 nanoparticles grown on graphene: an advanced catalyst
for the hydrogen evolution reaction. J Am Chem Soc. 133:7296–7299.
2011. View Article : Google Scholar : PubMed/NCBI
|
|
33
|
Wang X, Zhang Z and Chen Y:
Morphology-controlled synthesis of MoS2 nanostructures with
different lithium storage properties. J All Comp. 600:84–89. 2014.
View Article : Google Scholar
|
|
34
|
Li XY, Ai LH and Jiang J: Nanoscale
zerovalent iron decorated on graphene nanosheets for Cr(VI) removal
from aqueous solution: Surface corrosion retard induced the
enhanced performance. Chem Eng J. 288:789–797. 2015. View Article : Google Scholar
|
|
35
|
Szentimay MN and Martin CR: Ion-exchange
selectivity of nafion films on electrode surfaces. Anal Chem.
56:1898–1902. 1984. View Article : Google Scholar
|
|
36
|
Hummers WS and Offeman RE: Preparation of
graphitic oxide. Am Chem Soc. 80:13391958. View Article : Google Scholar
|
|
37
|
Brodie BC: Bibiographic notices. Doublic J
Mecical Sci. 22:351–379. 1855.
|
|
38
|
Staudenmaier L: Verfahren zur darstellung
der Graphitsaure. Berichte der deutschen chemischen Gesellschaft.
31:1481–1487. 1898. View Article : Google Scholar
|
|
39
|
Yu L, Lee YH, Ling X, Santos EJ, Shin YC,
Lin Y, Dubey M, Kaxiras E, Kong J, Wang H and Palacios T:
Graphene/MoS2 hybrid technology for large-scale two-dimensional
electronics. Nano Lett. 14:3055–3063. 2014. View Article : Google Scholar : PubMed/NCBI
|
|
40
|
Jiang JW and Park HS: Mechanical
properties of MoS2/graphene heterostructures. App Phy Lett.
105:033–108. 2014. View Article : Google Scholar
|
|
41
|
Nengjie H, Kang J, Wei Z, Li SS, Li j and
Wei SH: Novel and Enhanced Optoelectronic Performances of
multilayer MoS2-WS2heterostructure transistors. Adv Fun Mat.
24:7025–7031. 2014. View Article : Google Scholar
|
|
42
|
Meng F, Li J and Cushing SK: Solar
hydrogen generation by nanoscale p-n junction of p-type molybdenum
disulfide/n-type nitrogen-doped reduced graphene oxide. J Am Chem
Soc. 135:10286–10289. 2013. View Article : Google Scholar : PubMed/NCBI
|
|
43
|
Chang K and Chen W: In situ synthesis of
MoS2/graphene nanosheet composites with extraordinarily high
electrochemical performance for lithium ion batteries. Chem Commun.
47:4252–4254. 2011. View Article : Google Scholar
|
|
44
|
Wang Z, Chen T, Chen W, Chang K, Ma L,
Huang G and Chen D JM: CTAB-assisted synthesis of single-layer
MoS2-graphene composites as anode materials of Li-ion batteries. J
Mat Chem A. 1:2202–2210. 2013. View Article : Google Scholar
|