Introduction
Starvation or severe deprivation of nutrients, which
is commonly seen in surgical patients, can result in various
adaptive and catabolic changes in skeletal muscles, such as muscle
atrophy (1,2). Except starvation and fasting,
multiple physiological and pathological conditions, including
immobilization, mechanical unloading, cancer and chronic disease,
can also trigger muscle atrophy (3,4). Our
previous studies demonstrated that decreases in actin fiber size
resulted in reduced expression of myogenin, and elevated expression
of atrogin-1 induced by cobalt dichloride mimicking hypoxia, which
subsequently led to skeletal muscle atrophy (5,6).
Muscle atrophy is usually accompanied by a decrease
in skeletal muscle mass, an important prognostic indicator of many
diseases. Patients with muscular atrophy often have increased
morbidity and mortality (7).
Decreased muscle protein synthesis accounts predominantly for
skeletal muscle atrophy. There are several protective and
therapeutic measures against muscular atrophy, such as intake of
essential amino acids (8),
insulin-like growth factor (IGF)-I treatment (9) and anabolic androgenic steroids
(10); however, these measures can
cause increased drug resistance and cardiac events, limiting their
therapeutic utility for the treatment of muscle atrophy (4,11).
Although major advances in our understanding of protein loss in
muscle atrophy have been made recently (12–15),
it is important to elucidate the underlying molecular regulatory
mechanisms of dysfunctional muscle anabolism during skeletal muscle
atrophy, in order to develop promising strategies to prevent and
treat muscular atrophy.
Long non-coding RNAs (lncRNAs) are a class of
non-coding RNAs >200 nucleotides in length that make up the
majority of the transcriptome (16,17).
lncRNAs have emerged as significant regulators in multiple
physiological and pathological processes. lncRNAs have important
roles in skeletal muscle differentiation, development and muscular
atrophy (3,18–24)
through various mechanisms, such as competitive endogenous RNA and
cis- and trans-regulatory mechanisms (4,17,18,20,23,25).
Long intergenic non-protein coding RNA muscle differentiation 1
(lincMD1) regulates the expression of mastermind like
transcriptional coactivator 1 and myocyte enhancer factor 2C in the
muscle differentiation program (18). Myogenesis-associated lncRNA
(lnc-mg) regulates IGF-2, myosin heavy chain (MYHC), lactamase β
and myogenic differentiation factor to control muscle
differentiation and development (24,26).
MYHC is a crucial component of myosin, which participates in the
formation of the cytoskeleton and provides a force for muscular
contraction. Atrolnc-1 causes increased expression of muscle RING
finger protein 1 (MURF1), leading to myofiber atrophy in mice with
chronic kidney disease (3). The
abnormal expression of lncRNAs can result in various pathologies,
including cancer, and cardiac and muscle diseases (27,28).
Although mechanisms involving the obvious functions of lncRNAs
continue to be identified, few studies have provided a
comprehensive perspective of lncRNAs in terms of their functions in
skeletal muscle atrophy.
MicroRNAs (miRNAs, ~22 nucleotides in length)
constitute a class of highly conserved, small endogenous non-coding
RNA molecules that negatively regulate gene expression at the
post-transcriptional level (29–32).
Most miRNAs are ubiquitously expressed. Some miRNAs are mainly
expressed in muscle but may also be observed at low levels in other
tissues. These miRNAs have important roles in muscle
differentiation, development and atrophy (33–35),
and are predicted to participate in the regulatory networks of
myogenesis, muscle fiber type composition, muscle growth and
homeostasis (33). The miRNAs
associated with muscle differentiation, development and muscular
atrophy include miR-133a (36,37),
miR-133b (38), miR-206 (39,40),
miR-186 (41), miR-23a (42,43),
miR-27b (44), miR-29b (32), miR-1a (39) and miR-18a (45,46).
miR-1 promotes myoblast differentiation and regeneration (36,37,39,47).
miR-29b is required for loss of muscle mass in cases of
dexamethasone, tumor necrosis factor-α and
H2O2 treatment-induced muscle atrophy
(32). Given the crucial roles of
miRNAs in muscle proliferation and differentiation, changes in
their regulation, and their potential involvement in muscle atrophy
during starvation, could be expected. Changes in the expression of
muscle development-associated miRNAs in a disease state may induce
muscle atrophy, however it is unclear whether these miRNAs are
causally involved in adaptive or compensatory responses to muscle
atrophy (33).
lncRNAs and miRNAs are both non-coding RNAs, of
which miRNAs have been extensively investigated in skeletal muscle
development (32,33,35–47).
An increasing number of studies has demonstrated that lncRNAs are
also involved in skeletal muscle development (3,18,20–23).
lncRNAs and miRNAs can mutually restrict muscle development. lncRNA
H19 modulates let-7 availability by acting as a molecular sponge.
H19 depletion leads to accelerated muscle differentiation,
indicating that this lncRNA counteracts muscle differentiation
(48). lncRNA Sirt1 antisense
fully bound to sirtuin 1 mRNA forms an RNA duplex that promotes
myoblast proliferation and inhibits differentiation by competing
with miR-34a (49). Few studies
have provided a comprehensive perspective of lncRNAs and miRNAs in
terms of their regulation of skeletal muscle atrophy. Therefore,
the present study aimed to investigate the expression levels of
regulatory lncRNAs and miRNAs in mice with muscular atrophy induced
by starvation in vitro and in vivo.
In the present study, a serum starvation C2C12 cell
model and a starved muscular atrophy mouse model were established,
and analyzed by reverse transcription-quantitative PCR (RT-qPCR),
western blot analysis, immunofluorescence staining and hematoxylin
and eosin (H&E) staining. Subsequently, lncRNAs and miRNAs
associated with muscle differentiation or atrophy, whose expression
trends in the muscle differentiation or atrophy models were
consistent with the findings of previous studies (3,18–24,32,33,35–47),
were selected to identify differences of regulatory non-coding RNA
expression. The current findings indicated that lncRNAs showed
similar expression trends in vitro and in vivo and
may have great potential as a diagnostic tool.
Materials and methods
Cell culture
The mouse myoblast C2C12 cell line was purchased
from the Stem Cell Bank of the Type Culture Collection of the
Chinese Academy of Sciences and cultured at 37°C in 5%
CO2 and high-glucose Dulbecco's modified Eagle's medium
(cat. no. 12100046; Gibco; Thermo Fisher Scientific, Inc.)
supplemented with 10% (v/v) fetal bovine serum (cat. no.
SH30070.03; HyClone; GE Healthcare Life Sciences). For myotube
differentiation, C2C12 myoblasts were incubated in 12-well plates
with 2% horse serum (cat. no. SH30074.03; HyClone; GE Healthcare
Life Sciences) for 72 h, according to previous studies (17,50).
For starvation studies, the medium of the differentiated myotubes
was replaced with serum-free medium for an additional 48 h
(51).
Mouse strains and starvation-induced
muscular atrophy model
Male C57BL/6 mice (age, 6 weeks; weight, 20–22 g)
were acquired from the Animal Laboratory of Sun Yat-sen University
(Guangzhou, China). Mice were maintained under standard conditions
of 22±2°C at a relative humidity of 50–60% and housed under
alternate 12 h dark/light cycle conditions. Mice were allowed free
access to food and drinking water. All animal procedures were in
accordance with the Suggestions for the Care and Use of Laboratory
Animals of the Ministry of Science and Technology of the People's
Republic of China (52). The study
was approved by the Ethics Committee of Guangdong Second Provincial
General Hospital (no. 2019-YJSWZ-001).
Following a seven-day acclimation period, the mice
were randomly divided into two groups (n=6 mice per group): The
starvation/fasting model group and the control group. The
starvation/fasting-induced muscular atrophy model group was
generated by giving mice access to drinking water for 48 h only,
whereas the control group mice had access to food and drinking
water. The humane endpoint used in the present study was body
weight loss no more than 20%. The mice exhibited normal grooming
and the total body weight loss was <20% when the mice were
sacrificed. Mice were weighed and sacrificed by cervical
dislocation under terminal anesthesia by inhalation of isoflurane,
and tibialis anterior muscles were dissected, weighed and placed in
4% neutral formalin fixative solution for 24 h at 25°C, or
immediately snap frozen in liquid nitrogen before storing at
−80°C.
RNA extraction and RT-qPCR
Isolation of RNA from cultured C2C12
cells
For in vitro analyses, cell samples were
washed with PBS before lysis in TRIzol reagent (cat. no. 15596018;
Thermo Fisher Scientific, Inc.). RNA extraction was performed
according to the manufacturer's instructions.
Isolation of RNA from tibialis
anterior muscles
Frozen tibialis anterior muscles were lysed in
TRIzol reagent (Thermo Fisher Scientific, Inc.) and homogenized
with a tissue homogenizer (Shanghai Jingxin Industrial Development
Co., Ltd.). RNA extraction was performed as described above.
RT-qPCR
For mRNA and lncRNA detection, total RNA was
reverse-transcribed into cDNA using the PrimeScript RT Master mix
(cat. no. RR036A; Takara Bio, Inc.). For miRNA detection, total RNA
was reverse-transcribed into cDNA using the Mir-X™ miRNA
First-Strand Synthesis kit (cat. no. 638313; Takara Bio, Inc.). The
abundance of mRNAs, lncRNAs and miRNAs was measured with SYBR-Green
Mix (cat. no. RR820A; Takara Bio, Inc.) on a StepOne Plus Real-Time
PCR System (Applied Biosystems; Thermo Fisher Scientific, Inc.).
PCR for detecting mRNAs and lncRNAs was performed as follows:
Denaturation at 95°C for 30 sec, followed by 40 cycles of
denaturation at 95°C for 5 sec, annealing at 55°C for 30 sec, and
extension at 72°C for 30 s. PCR for detecting miRNAs was performed
as follows: Denaturation at 95°C for 10 sec, followed by 40 cycles
of denaturation at 95°C for 5 sec, annealing and extension at 60°C
for 30 sec. mRNA and lncRNA expression was normalized to that of
18S RNA, and miRNA expression was normalized to that of U6 using
the 2−ΔΔCq method (53). A universal reverse primer, mRQ 3′
Primer (cat. no. 638313; Takara Bio, Inc.), was used for the all
the miRNAs. Primer sequences are listed in Tables I and II.
 | Table I.Sequences of mRNA and long non-coding
RNA primers. |
Table I.
Sequences of mRNA and long non-coding
RNA primers.
| Gene | Forward primer
(5′-3′) | Reverse primer
(5′-3′) |
|---|
| 18S |
GTAACCCGTTGAACCCCATT |
CCATCCAATCGGTAGTAGCG |
| MURF1 |
GTGTGAGGTGCCTACTTGCTC |
GCTCAGTCTTCTGTCCTTGGA |
| Atrogin-1 |
GAGTGGCATCGCCCAAAAGA |
TCTGGAGAAGTTCCCGTATAAGT |
| Atrolnc-1 |
CAGCTGCCTACACCTGAAGA |
AGGGCTCGCAGATTACACC |
| lincMD1 |
AGTGATTGAGGTGGACAGAAGG |
CCCATTGAGGAGCATAGAACC |
| Myolinc |
CGGTGCTATGGTTCTGATCG |
TATGTGGGAAATACAGGGACA |
| LncMyoD |
ACCCAAGGCAAGAAAAGTAGCA |
ACTCACGAGTCAGCGGCAGAAC |
| Dum |
CACAAAGACAGGCAGACAGAC |
TACCAAGCAGGTTCCTACGG |
| MAR1 |
CCAAAGGACTGTCTTGGAACA |
AACAGCACTGAGCAGGGAC |
| lnc-mg |
CTGCATCACGGAAGGAGATA |
AACAATCCATCCTCATTGGC |
| Table II.Sequences of miRNA primers. |
Table II.
Sequences of miRNA primers.
| miRNA | Sequence
(5′-3′) |
|---|
| U6 | F:
GGAACGATACAGAGAAGATTAGC |
|
| R:
TGGAACGCTTCACGAATTTGCG |
| miR-133a |
TTTGGTCCCCTTCAACCAGC |
| miR-133b |
GGTCCCCTTCAACCAGCTA |
| miR-206-3p |
GGAATGTAAGGAAGTGTGTGG |
| miR-186 |
GAATTCTCCTTTTGGGCTAAAA |
| miR-23a-3p |
ATCACATTGCCAGGGATTTCC |
| miR-27b |
TTCACAGTGGCTAAGTTCTGC |
| miR-29b-3p |
TAGCACCATTTGAAATCAGTGTT |
| miR-1a-3p |
TGGAATGTAAAGAAGUATGTAT |
| miR-18a |
GCCATCTAGTGCAGATAGAAAA |
Immunofluorescence staining and
myotube diameter measurements
Myotube diameter was analyzed by MYHC staining.
Harvested cells were fixed with a 4% paraformaldehyde solution
three times for 10 min at 25°C, blocked with goat serum (cat. no.
C0265; Beyotime Institute of Biotechnology) for 1 h at 25°C, and
then incubated with mouse anti-MYHC primary antibody (1:80; cat.
no. MAB4470; R&D Systems, Inc.) overnight at 4°C. After
removing the solution containing the primary antibody, cells were
incubated with Alexa Fluor 594-conjugated AffiniPure Goat
Anti-Mouse IgG (H+L; 1:100; cat. no. AS077; ABclonal Biotech Co.,
Ltd.) for 1 h. DAPI (cat. no. KGA215; KeyGen Biotech Co., Ltd.) was
used to stain nuclei. Images were acquired at magnification, ×400
using a fluorescent Leica DMIL LED microscope (Leica Microsystems
GmbH). Fiber diameters were measured in randomly selected fields
from three different wells of the control and three different wells
of the serum-starved myotubes using ImageJ software (v1.44P;
National Institutes of Health). Three diameters were measured per
myotube, and 80 myotubes were measured per well.
H&E staining and determining the
cross-sectional area (CSA) of muscle fibers
Muscles were placed in neutral formalin fixative
solution for 24 h at 25°C. To assess tissue morphology, tissues
were embedded in paraffin, then 10 µm thick transverse sections of
tibialis anterior muscles were stained with hematoxylin for 5 min
and eosin for 1 min (both at 25°C) and sealed with neutral balsam.
After H&E staining, six pairs of samples were placed under a
microscope at magnification, ×200 to capture light microscope
images (Leica Microsystems GmbH). The obtained images were analyzed
by ImageJ software (v1.44P; National Institutes of Health) to
measure muscle fiber CSA. The measured data were used to calculate
the mean ± standard deviation.
Western blot analysis
Serum-starved C2C12 myotubes were used to extract
total protein. Frozen tibialis anterior muscles were homogenized
with a tissue homogenizer (Shanghai Jingxin Industrial Development
Co., Ltd.) to extract total protein. RIPA lysis buffer (100 µl;
cat. no. P0013D; Beyotime Institute of Biotechnology) was used to
extract protein. Equal quantities of protein (20 µg), determined
using an enhanced Bicinchoninic Acid Protein Assay Kit (cat. no.
P0010S; Beyotime Institute of Biotechnology) were separated via
10–12% SDS-PAGE and transferred onto polyvinylidene fluoride
membranes. Membranes were blocked with 5% non-fat milk for 1 h at
25°C and incubated with primary antibodies targeting MURF1
(1:1,000; cat. no. ab77577; Abcam), atrogin-1 (1:2,000; cat. no.
ab168372; Abcam), MYHC (1:1,000; cat. no. MAB4470; R&D Systems,
Inc.) or tubulin (1:5,000; cat. no. AC021; ABclonal Biotech Co.,
Ltd.) overnight at 4°C. Tubulin was used as the control for protein
quantification. Membranes were then incubated with horseradish
peroxide-conjugated goat anti-mouse (1:5,000; cat. no. AS003;
ABclonal Biotech Co., Ltd.) or anti-rabbit (1:10,000; cat. no.
AS014; ABclonal Biotech Co., Ltd.) secondary antibodies for 1 h at
25°C. Band intensity was determined using a chemiluminescent
imaging system (Tanon-V8 Pro; Tanon Sciences and Technology, Co.,
Ltd.). Densitometry was performed to determine protein expression
using TanonImage (version 1.00; Tanon Sciences and Technology, Co.,
Ltd.)
Statistical analysis
GraphPad Prism 5.0 (GraphPad Software, Inc.) was
used to perform statistical analyses. Student's t-test was applied
for the comparison of two groups. P<0.05 was considered to
indicate a statistically significant difference.
Results
Establishment of the serum starvation
C2C12 cell model in vitro
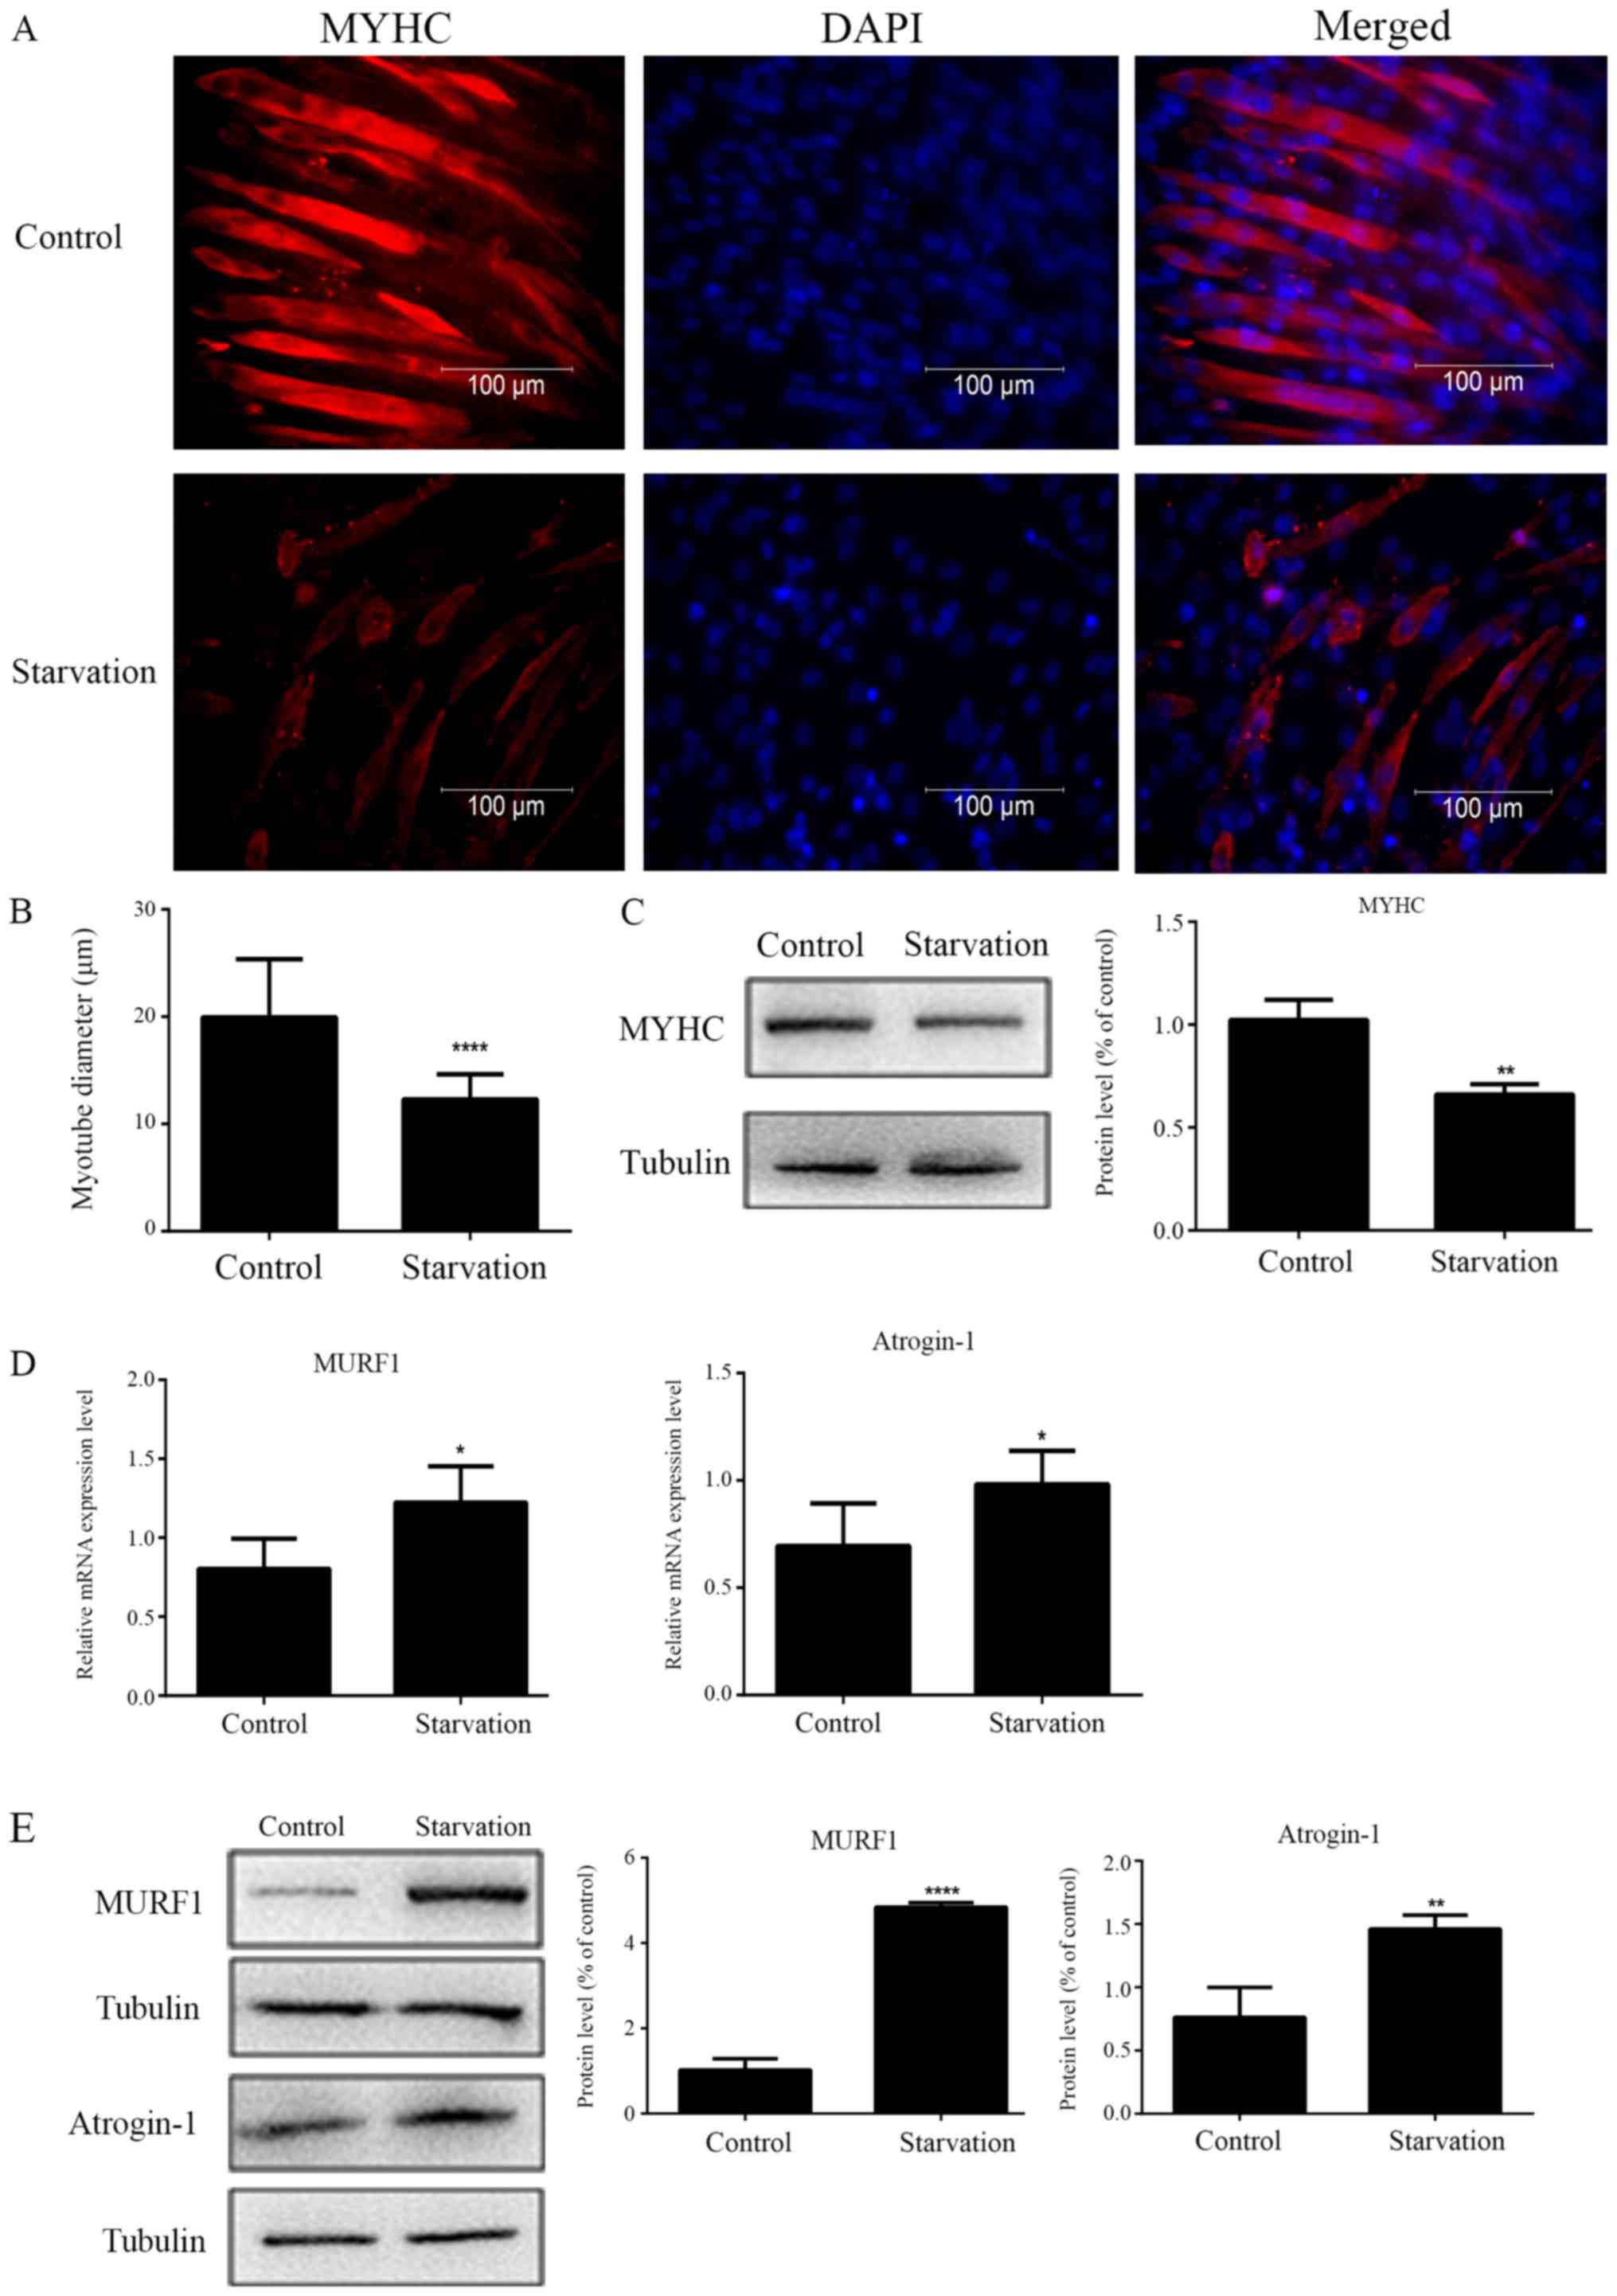
Immunofluorescence staining results indicated that,
under serum-starvation conditions, the diameter of starved C2C12
myotubes was thinner compared with control (regularly cultured)
myotubes (Fig. 1A and B). The
protein expression levels of MYHC were significantly decreased in
starved myotubes compared with control myotubes (Fig. 1C). An increase in the transcript
and protein expression levels of MURF1 and atrogin-1 were also
detected in starved myotubes, by RT-qPCR and western blot analysis
respectively (Fig. 1D and E).
These results suggested that starvation-induced muscle atrophy was
successfully established in C2C12 myotubes.
lncRNA expression patterns in atrophic
C2C12 cells
The levels of various lncRNAs associated with muscle
development were detected in order to identify differences in
regulatory lncRNA expression between control and serum-starved
C2C12 cells by RT-qPCR. lncRNAs whose altered expression in the
starvation model was consistent with previous studies were selected
for subsequent investigation (3,18–24).
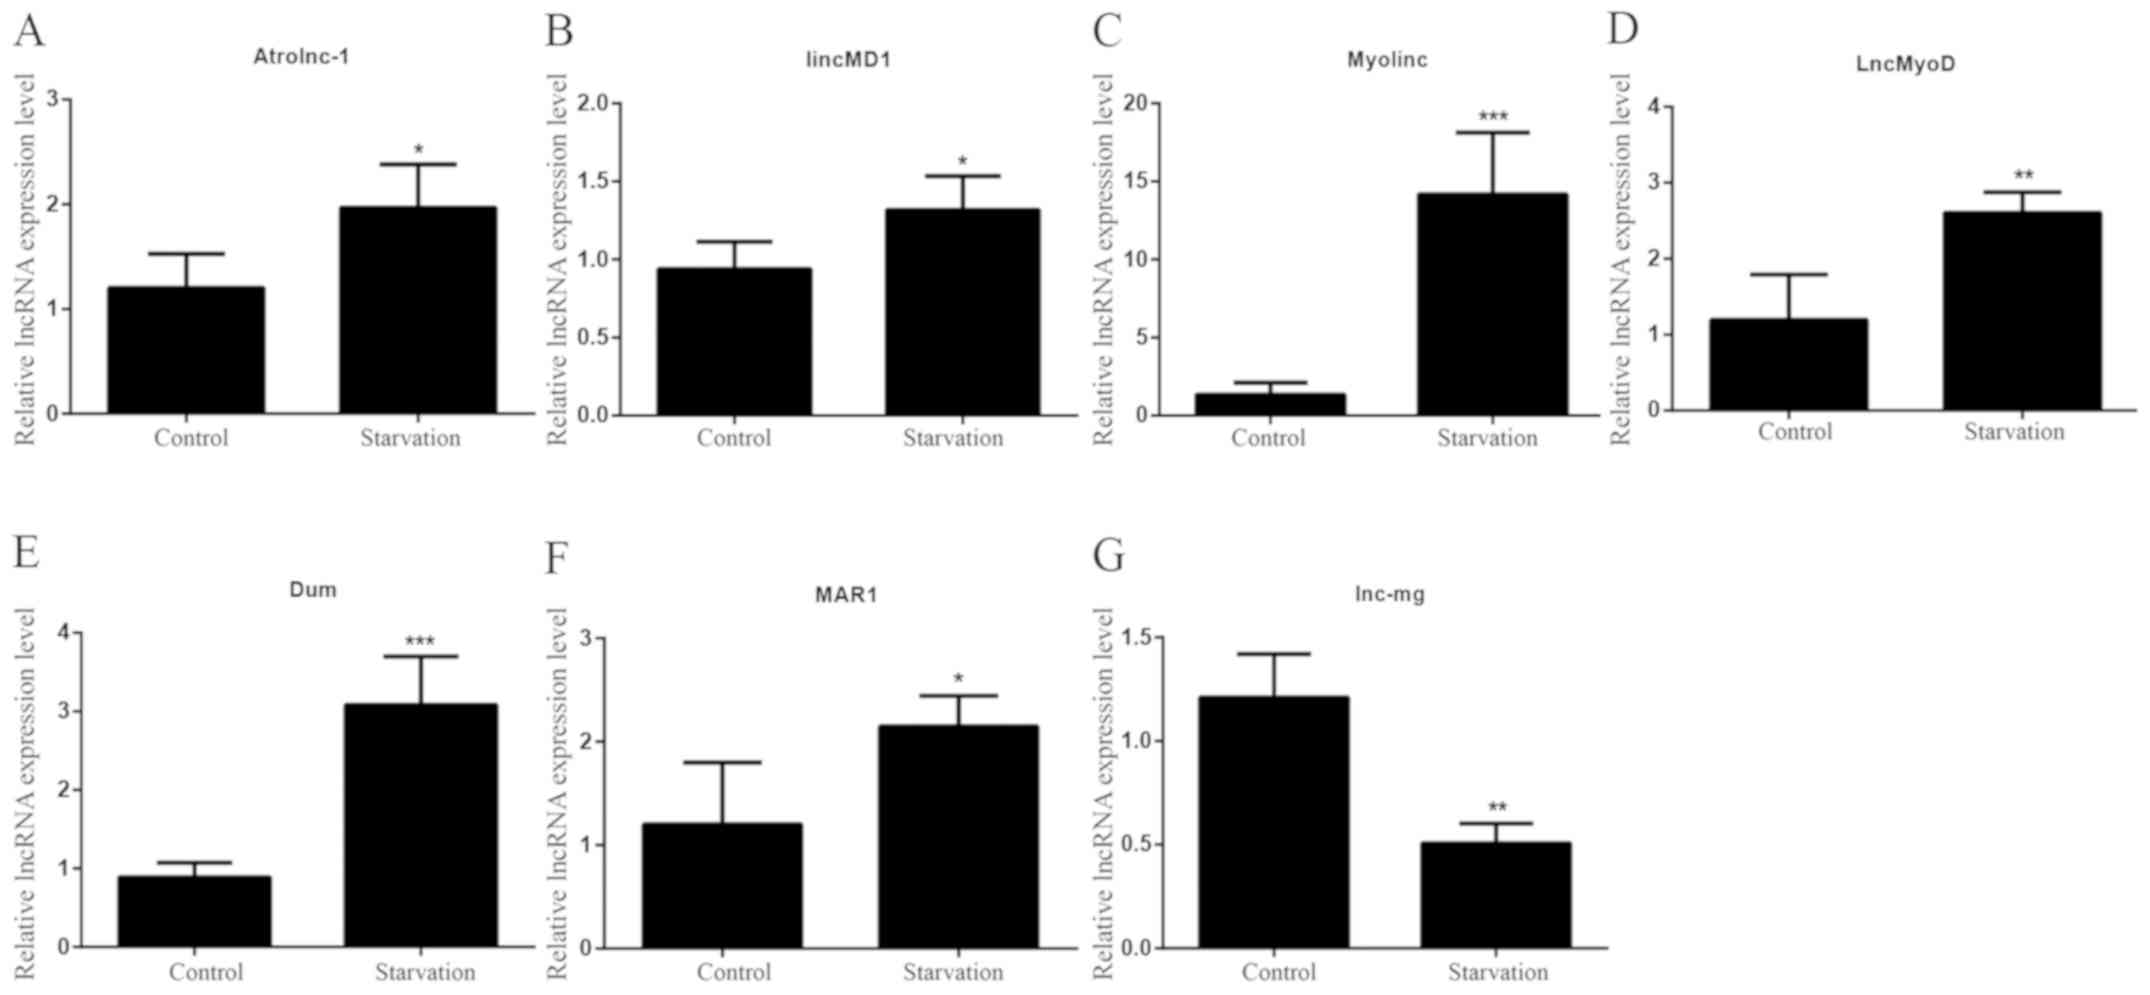
It was revealed that seven lncRNAs matched these criteria. Six of
these lncRNAs [Atrolnc-1, lincMD1, Myolinc, lncMyoD, Dum and muscle
anabolic regulator 1 (MAR1)] exhibited significantly increased
levels in starved C2C12 cells compared with control C2C12 cells
(Fig. 2A-F). By contrast,
significantly lower lnc-mg levels were observed in starved C2C12
myotubes (Fig. 2G). In the
differentiated starved model, the expression levels of lincMD1,
Myolinc, LncMyoD, Dum, MAR1, lnc-mg and Atrolnc-1 were
significantly different compared with control C2C12, suggesting
that these lncRNAs were involved in skeletal muscle differentiation
(lincMD1, Myolinc, LncMyoD, Dum, MAR1 and lnc-mg) and atrophy
(Atrolnc-1) under starvation conditions.
 | Figure 2.lncRNA expression patterns in
serum-starved C2C12 cells. The expression levels of lncRNAs (A)
Atrolnc-1, (B) lincMD1, (C) Myolinc, (D) LncMyoD, (E) Dum, (F) MAR1
and (G) lnc-mg were detected in control C2C12 cells and
differentiated serum-starved C2C12 cells. All data are presented as
the mean ± standard deviation. *P<0.05, **P<0.01 and
***P<0.001. (n=6). lncRNA, long non-coding RNA; lincMD1, long
intergenic non-protein coding RNA, muscle differentiation 1;
lnc-mg, myogenesis-associated lncRNA; MAR1, muscle anabolic
regulator 1. |
miRNA expression patterns in atrophic
C2C12 cells
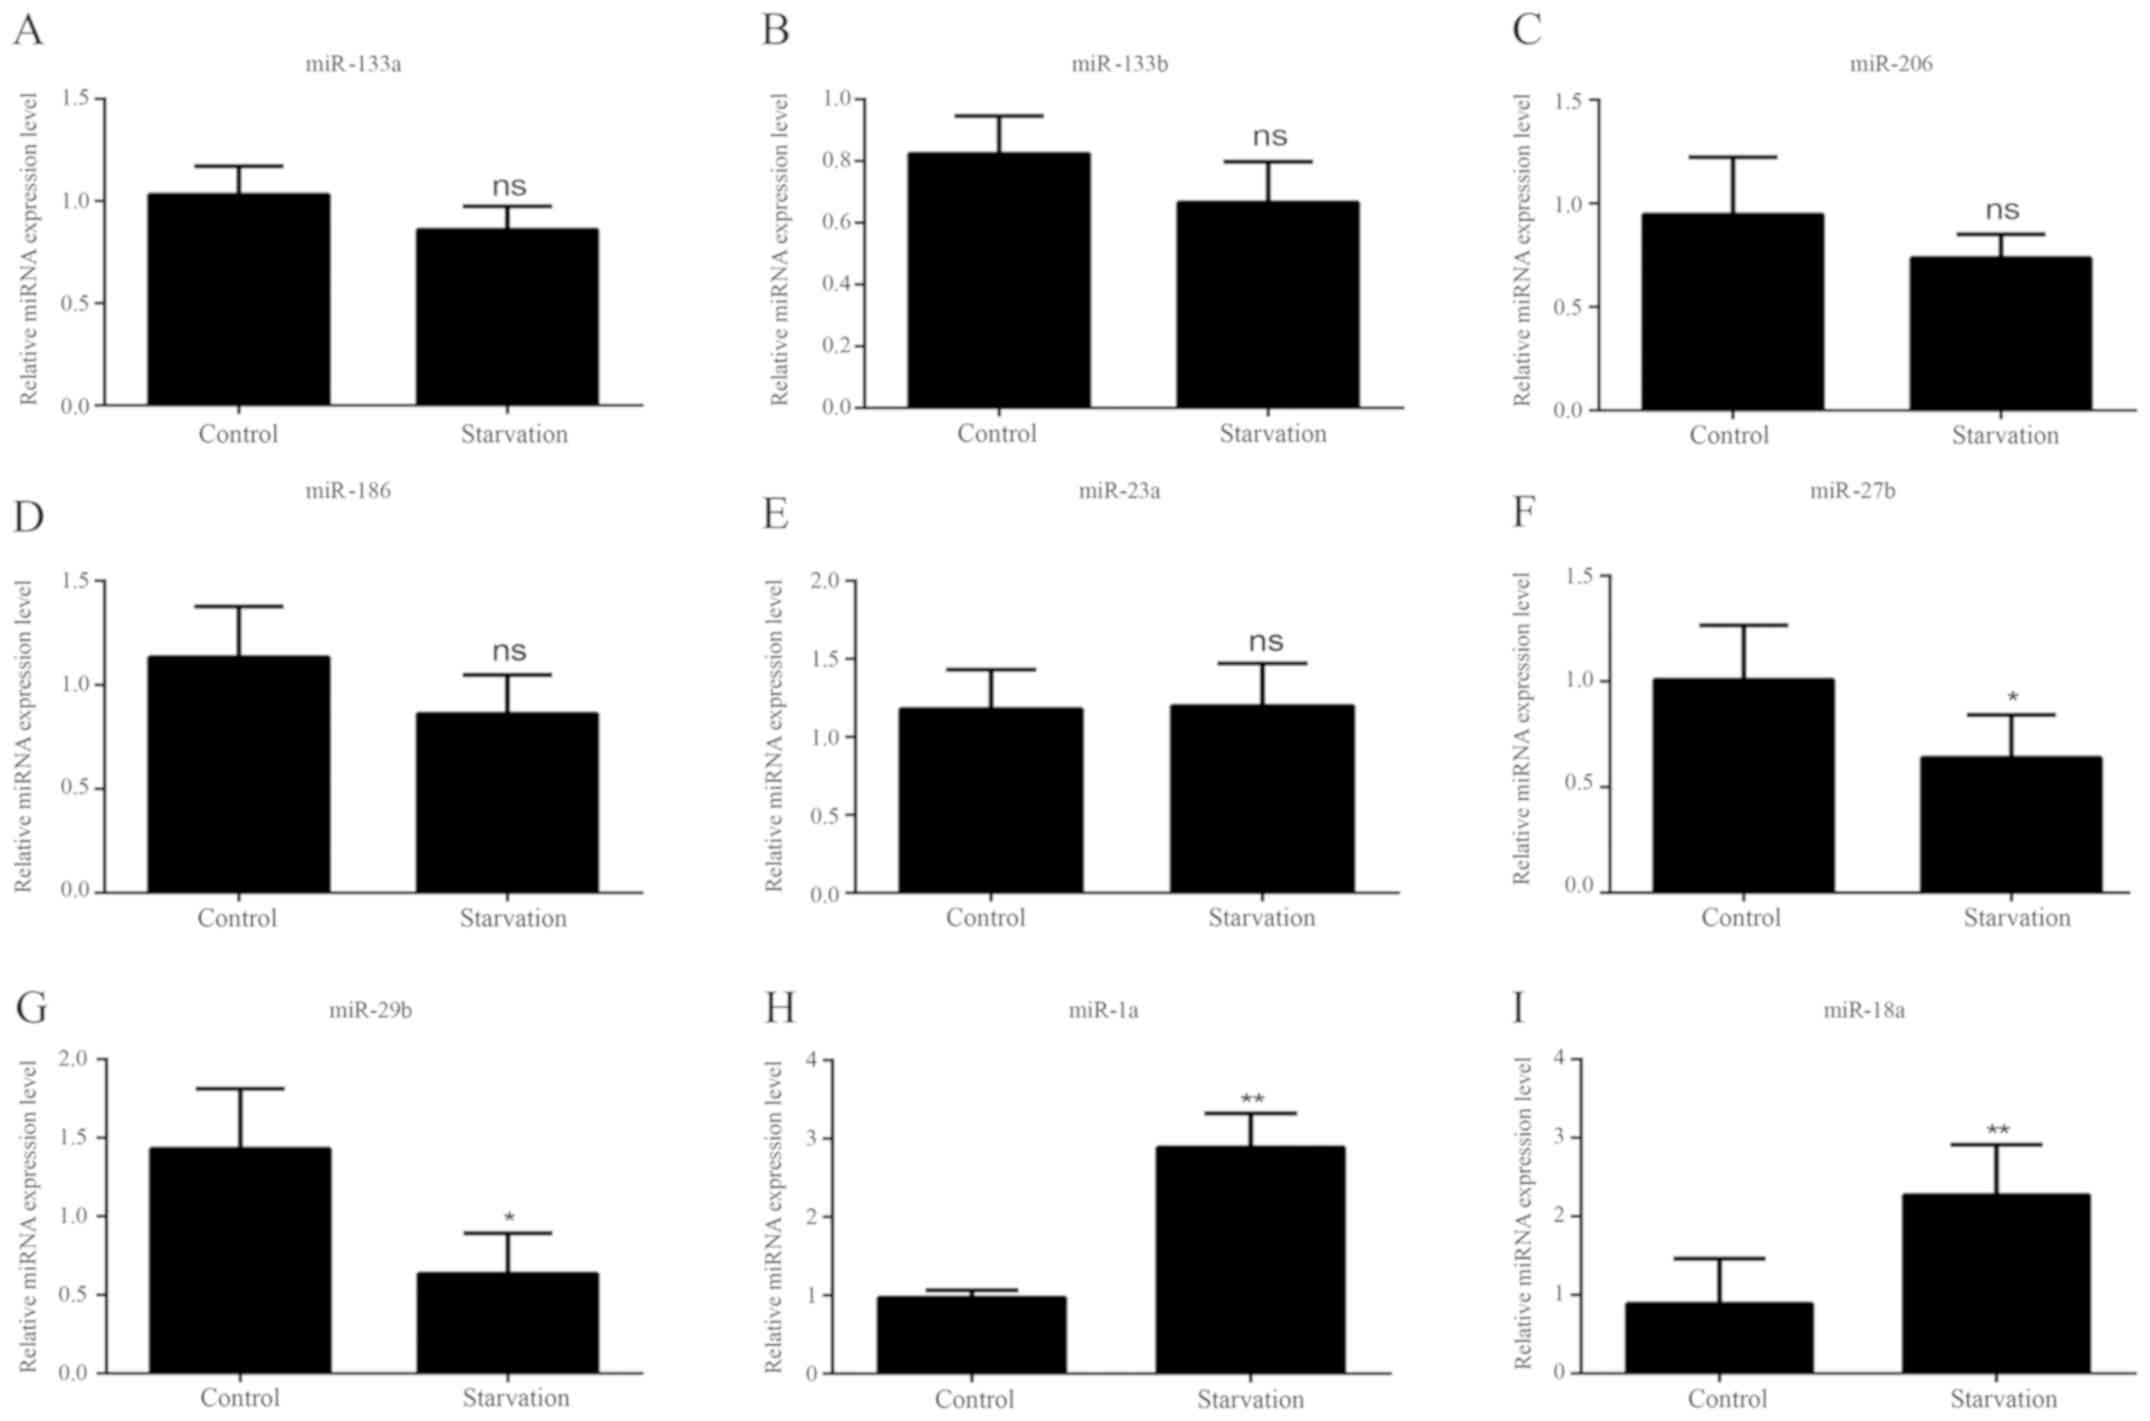
As with the lncRNAs, the levels of various miRNAs
associated with muscle development were detected in order to
identify differences in regulatory miRNA expression between control
and serum-starved C2C12 cells by RT-qPCR; miRNAs with expression
trends consistent with previous literature (32,33,35–47)
were selected for further experiments. It was revealed that nine
miRNAs matched these criteria. In starved C2C12 cells, five of the
miRNAs (miR-133a, miR-133b, miR-206, miR-186 and miR-23a) exhibited
no significant change in expression levels (Fig. 3A-E). Four miRNAs showed different
levels of expression between control and serum-starved C2C12 cells.
miR-27b and miR-29b expression (Fig.
3F and G) was significantly decreased in starved C2C12 cells;
however, miR-1a and miR-18a expression levels were significantly
higher (Fig. 3H and I).
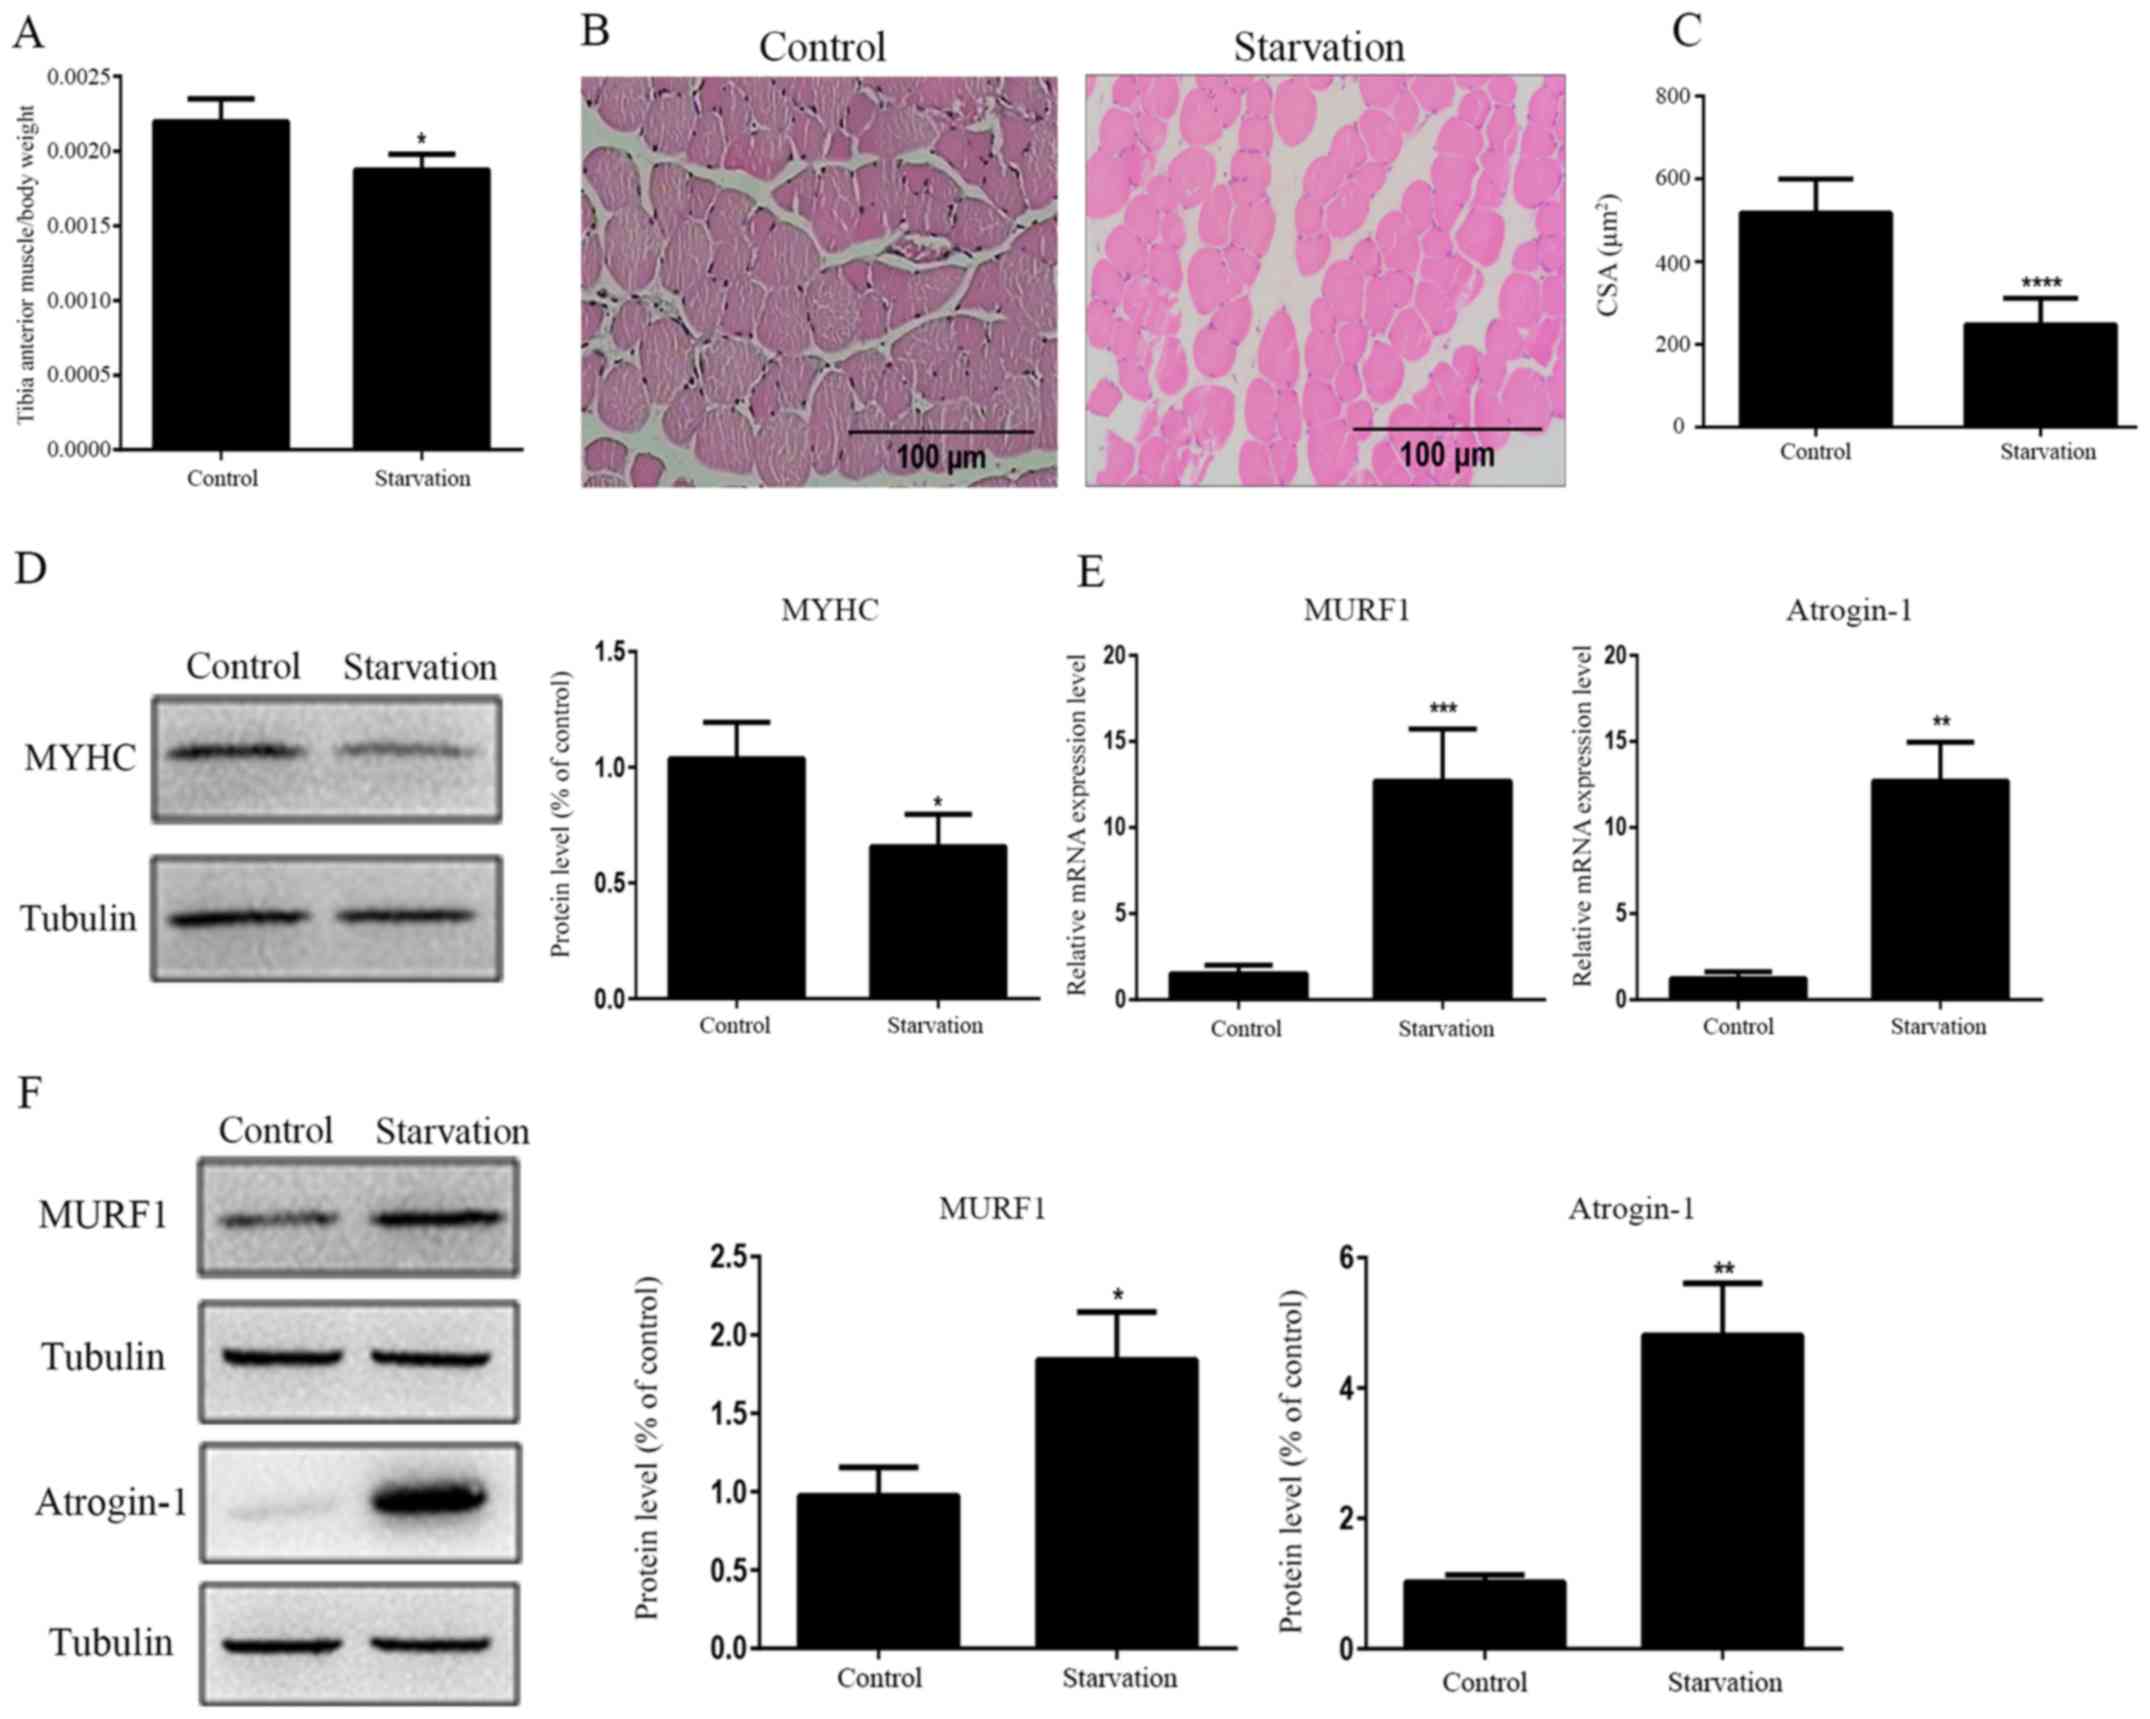
Establishment of a muscular atrophic
mouse model induced by starvation in vivo
The ratio of tibial anterior muscle to body weight
was decreased significantly in starved mice compared with normally
fed control mice (Fig. 4A).
H&E staining revealed that the CSA of mouse tibialis anterior
muscles was significantly decreased following food deprivation for
48 h (Fig. 4B and C). The protein
expression levels of MYHC were decreased in starved mouse tibialis
anterior muscles compared with control mouse muscles (Fig. 4D). Additionally, the transcript and
protein expression levels of MURF1 and atrogin-1 were increased in
starved tibialis anterior muscles compared with control mouse
muscles (Fig. 4E and F). These
results indicated that starvation induced muscle atrophy in
mice.
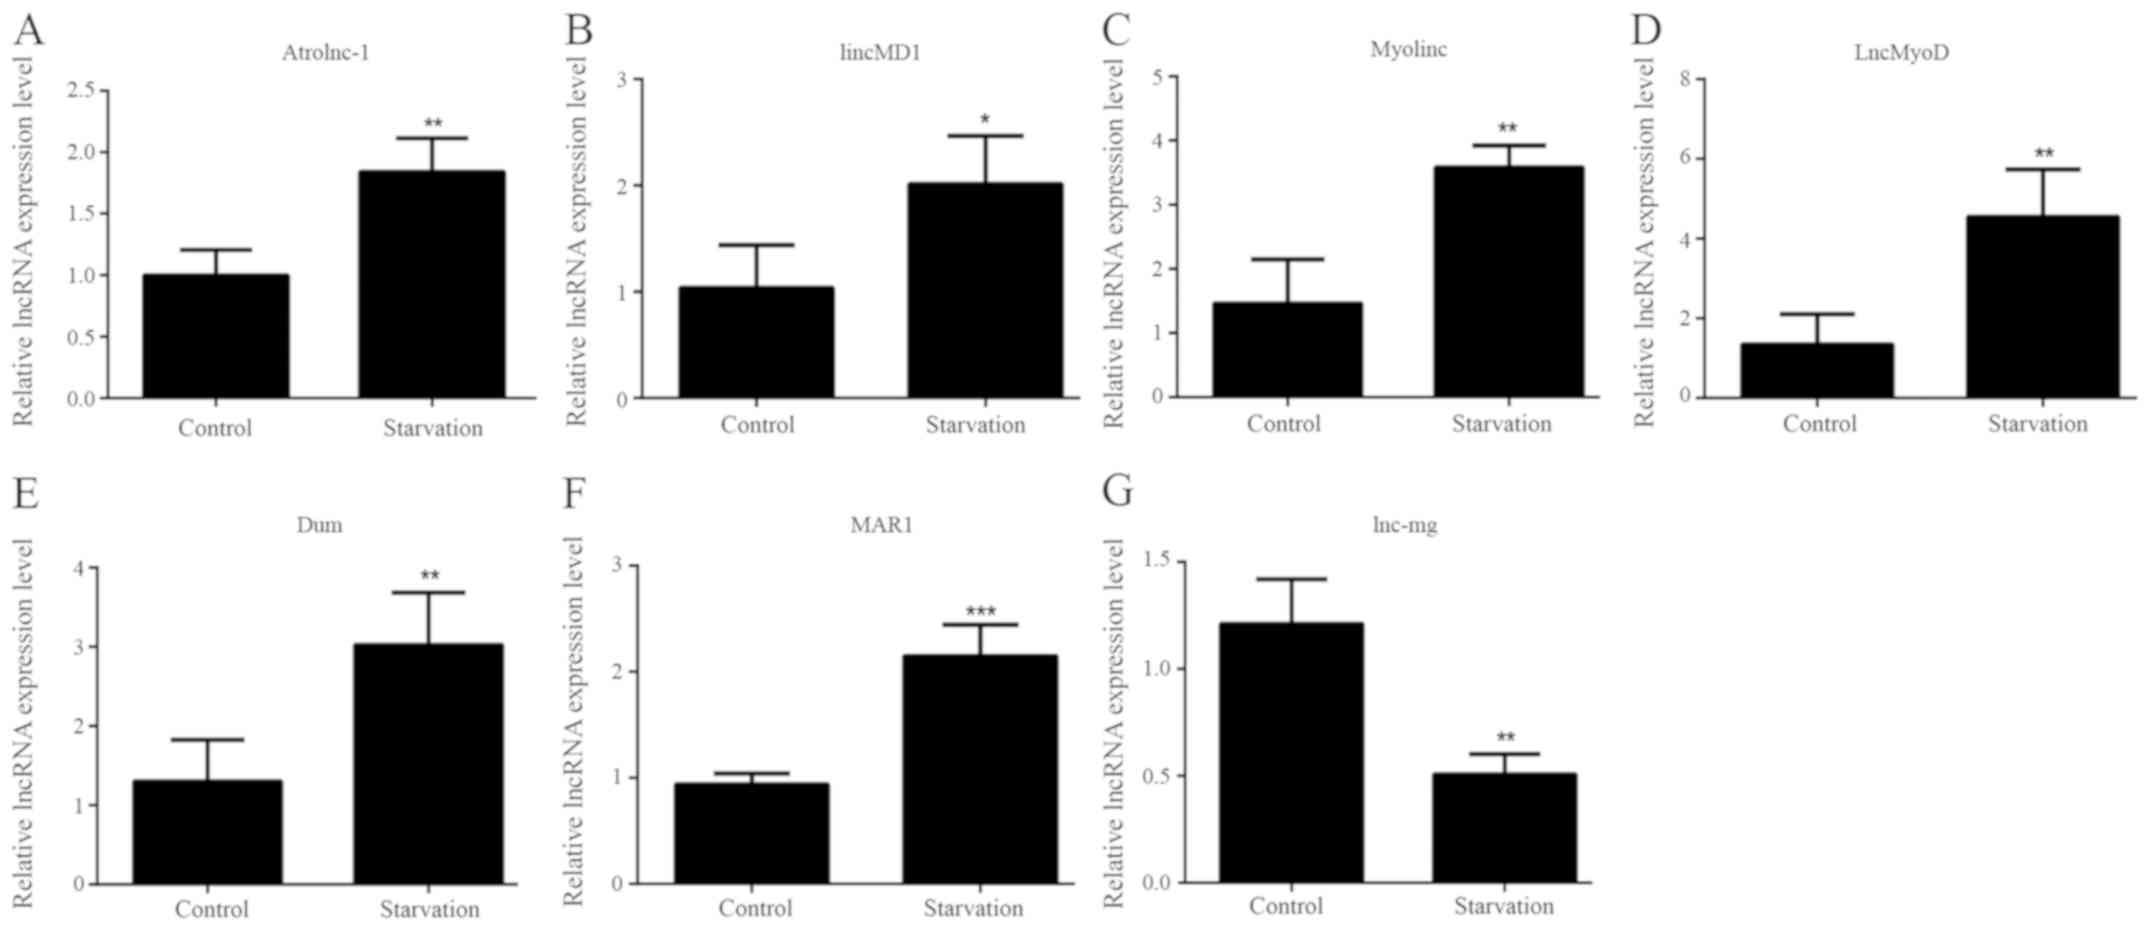
lncRNA expression patterns during
mouse starvation
The expression levels of the seven lncRNAs that were
selected in the present study were detected in the tibialis
anterior muscles of the starved and control mice by RT-qPCR. Six of
the lncRNAs (Atrolnc-1, lincMD1, Myolinc, LncMyoD, Dum and MAR1)
exhibited significantly higher levels in starved tibialis anterior
muscles compared with control muscles (Fig. 5A-F). Significantly lower lnc-mg
levels were observed in starved tibialis anterior muscles (Fig. 5G). The differences in the
expression levels of the seven lncRNAs in starved mice reflected
the patterns of differentiated serum-starved C2C12 cells in
vitro. The significantly differential expression of lncRNAs
between control and starved mice indicated that these lncRNAs are
associated with skeletal muscle proliferation, differentiation and
atrophy under starvation conditions.
 | Figure 5.lncRNA expression patterns during
mouse starvation. The expression levels of lncRNAs (A) Atrolnc-1,
(B) lincMD1, (C) Myolinc, (D) LncMyoD, (E) Dum, (F) MAR1 and (G)
lnc-mg were detected in tibialis anterior muscles from normally fed
and starved mice. All data are presented as the mean ± standard
deviation. *P<0.05, **P<0.01 and ***P<0.001 (n=6 mice per
group). lncRNA, long non-coding RNA; lincMD1, long intergenic
non-protein coding RNA muscle differentiation 1; lnc-mg,
myogenesis-associated lncRNA; MAR1, muscle anabolic regulator
1. |
miRNA expression patterns during mouse
starvation
In starved mouse tibialis anterior muscles, three
miRNAs (miR-206, miR-23a and miR-18a) showed no significant change
in expression levels (Fig. 6C, E and
I). Six miRNAs (miR-133a, miR-133b, miR-186, miR-27b and
miR-1a) showed significantly decreased levels of expression,
following starvation in mice (Fig. 6A,
B, D, F and H). By contrast, the miR-29b expression levels
(Fig. 6G) were significantly
higher in starved mice compared with control. The expression
patterns of miR-23a, miR-206 and miR-27b in starved mice exhibited
the same changes as those of the differentiated serum-starved C2C12
cells in vitro, whereas the expression patterns of the other
six miRNAs differed between the two starvation models.
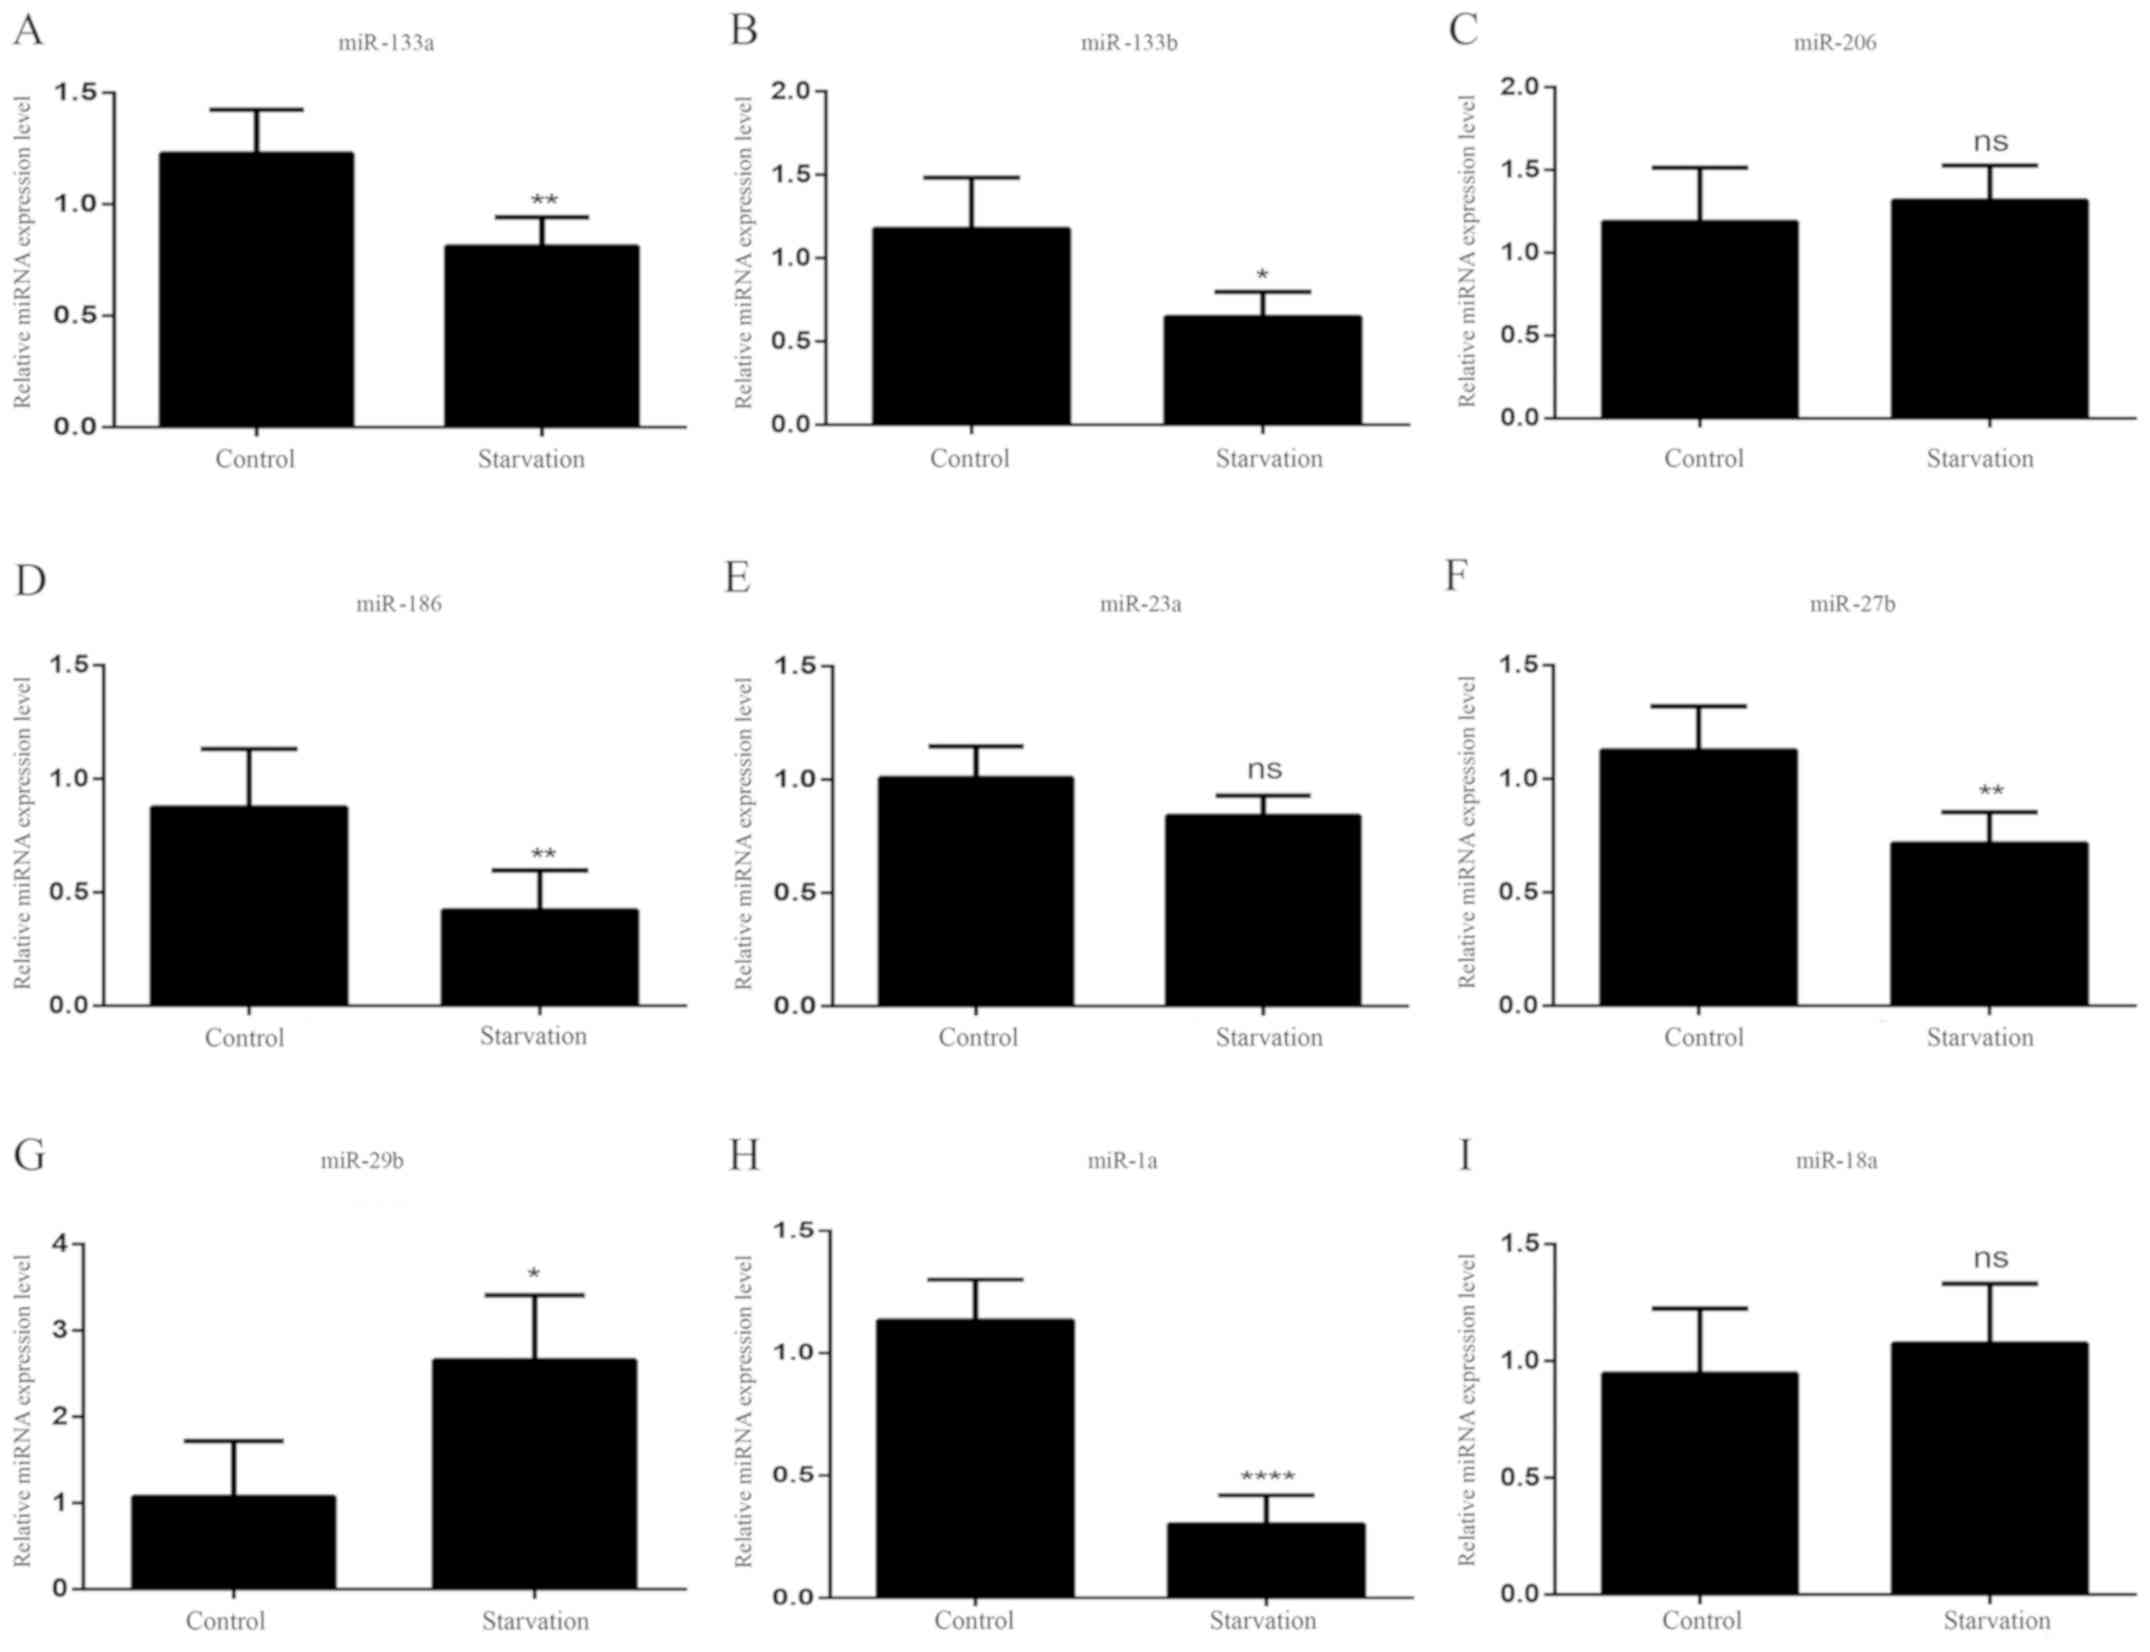 | Figure 6.miRNA expression patterns during
mouse starvation. The expression levels of (A) miR-133a, (B)
miR-133b, (C) miR-206, (D) mR-186, (E) miR-23a, (F) miR-27b, (G)
miR-29b, (H) miR-1a and (I) miR-18a were detected in normally fed
and starved mice. All data are presented as the mean ± standard
deviation. *P<0.05, **P<0.01 and ****P<0.0001 (n=6 mice
per group). miRNA/miR, microRNA; ns, no significance. |
Discussion
Muscular atrophy is beginning to be considered in
the pathogenesis of many physiological and pathological conditions,
such as starvation and severe deprivation of nutrients, muscle
disuse, Duchenne progressive muscular dystrophy, cancer and chronic
disease. Therefore, it is important to elucidate the molecular
regulatory mechanisms underlying dysfunctional muscle anabolism
during skeletal muscle atrophy, and to develop strategies to
prevent and treat muscular atrophy.
Isolation of muscles from mice revealed few vascular
endothelial cells, lymphatic vessels and nerves among the muscle
fibers. However, it is difficult at present to purify the skeletal
muscle of mice from contamination with endothelial cells or other
cell types due to the limitation of current technical tools. Based
on other studies on lncRNAs and miRNAs in the skeletal muscle
(19,24,32),
muscle samples were harvested directly without considering the
effects of endothelial cells or any other cell types. Therefore,
the entire tibialis anterior muscle was used to explore gene
expression and the underlying molecular regulatory mechanisms of
muscle dysfunctional metabolism.
Myotube diameter and MYHC intensity are closely
associated with skeletal muscle function (54). MYHC participates in the formation
of the cytoskeleton and provides the force for muscles to contract
normally. In the cell starvation model of the present study, cell
myotube diameter was dramatically thinner and MYHC protein
expression levels were significantly decreased. Changes in myotube
diameter and MYHC expression following starvation may indicate
changes in muscle functions.
The present study analyzed the expression patterns
of lncRNAs and miRNAs during starvation-induced muscular atrophy
in vitro and in vivo. Several lncRNAs, including
lnc-mg, Atrolnc-1, lincMD1, Myolinc, lncMyoD, Dum and MAR1 differed
in their expression levels between control and atrophic muscles.
Lnc-mg (24,26), lincMD1 (18) and Dum (22) regulate the expression of MYHC and
have important roles in skeletal muscle cell differentiation and
development. Lnc-mg regulates IGF-2 to promote muscle
differentiation and development, by functioning as a competitive
endogenous RNA for miR-125b (24).
In the muscular atrophic models (in vitro and in
vivo) of the present study, lnc-mg and MYHC were both
decreased. Thus, it is speculated that downregulated lnc-mg may
serve an important role in starvation-induced muscular atrophy and
could be positively associated with downregulated MYHC. The
increased expression of lincMD1 and Dum may be compensatory
responses to atrophy. Atrolnc-1 expression was significantly higher
in the starvation-induced atrophic models (in vitro and
in vivo). This result was consistent with the fact that
Atrolnc-1 is remarkably enhanced in atrophic muscles in atrophic
mouse models of chronic kidney disease, starvation and cancer
(3). Atrolnc-1 interacts with the
A20 binding inhibitor of nuclear factor κB-1 (NF-κB-1), promoting
its activation and resulting in increased MURF1 (3). The high expression of Atrolnc-1
observed in the present study further indicates that muscular
atrophy occurred in starved cells and mice.
LincMD1 regulates the expression of mastermind like
transcriptional coactivator 1 and myocyte enhancer factor 2C to
promote muscle differentiation by acting as a sponge for miR-133
and miR-135 (18). The present
demonstrated that lincMD1 expression levels significantly increased
during muscular atrophy, during which myoblasts are required for
differentiation and fusion in order to replace damaged myofibers.
In addition, lincMD1 promotes the expression of human antigen R
protein to consolidate the muscle regulatory factor mRNAs (20,55).
The expression levels of the other four lncRNAs, Myolinc, LncMyoD,
Dum and MAR1, were all elevated under atrophic conditions, which
may be explained by the fact that myoblasts are required for
differentiation and fusion, in order to replace damaged myofibers
under atrophic conditions.
The expression patterns of miR-206, miR-23a and
miR-27b in starved mice exhibited the same changes as those in
differentiated serum-starved C2C12 cells in vitro, whereas
the expression patterns of the other six miRNAs differed between
the two starvation models. miR-23a and miR-206 exhibited no
significant change in expression levels, indicating that their
roles in starvation-induced skeletal muscle atrophy may be minimal.
miR-27b promotes muscle differentiation and inhibits proliferation
by inhibiting MyoD family inhibitor (MDFI) expression (44). MDFI functions as a negative
regulator of muscle growth by inhibiting muscle hypertrophy
(56). However, miR-27b expression
was significantly decreased in the starvation-induced atrophic
models, possibly because differentiation was decreased under
atrophic conditions. miR-29b expression in the starvation-induced
atrophic mouse model was significantly higher than in control mice,
consistent with a study that demonstrated that miR-29b was elevated
in an in vivo atrophy model (32). However, the expression of miR-29b
in serum-starved C2C12 myotubes in vitro was significantly
reduced compared to control myotubes, which was not consistent with
our in vivo atrophy model; the role of miR-29b in primary
myoblasts therefore remains unclear, which was a limitation of the
present study, and the reasons for this phenomenon remain to be
determined.
The seven lncRNAs selected exhibited the same
expression trends in the in vivo and in vitro starved
models. Among the nine miRNAs selected, three miRNAs showed
consistent change in trends in the two models, whereas six miRNAs
showed inconsistent change. Therefore, the consistency of lncRNA
expression was superior; the inconsistent changes in the trends of
miRNAs in the two starved models require further investigation.
In conclusion, the present study analyzed the
expression patterns of lncRNAs and miRNAs in
starvation/fasting-induced muscular atrophy models. The current
findings indicated that lncRNAs had similar expression changes
in vitro and in vivo. The present results provided a
novel insight into the lncRNAs involved in muscle atrophy and
suggested that they may serve as potential diagnostic tools. A
follow-up investigation is required to better understand the roles
of lncRNAs in muscle atrophy.
Acknowledgements
Not applicable.
Funding
The current study was supported by grants from the
Natural Science Foundation of Guangdong Province (grant no.
2018A030313591), the Science and Technology Planning Project of
Guangdong Province (grant no. 2017ZC0333), the Administration of
Traditional Chinese Medicine of Guangdong Province (grant no.
20181014), the Science and Technology Planning Project of Haizhu
District (grant no. 2018-87), the Science Foundation of Guangdong
Second Provincial General Hospital (grant nos. YQ2017-012,
YN2017-002, YN2017-003 and YQ2018-005) and the National Natural
Science Foundation of China (grant no. 81601503).
Availability of data and materials
The datasets used and/or analyzed during the current
study are available from the corresponding author on reasonable
request.
Authors' contributions
RC conceived and designed the experiments. SL, YS
and RC performed the experiments in vivo and analyzed the
data. SL, YS, JZ, SZ and HS performed the experiments in
vitro and analyzed the data. SL and RC wrote the manuscript.
All authors read and approved the final manuscript.
Ethics approval and consent to
participate
The present study was approved by the Ethics
Committee of Guangdong Second Provincial General Hospital (approval
no. 2019-YJSWZ-001).
Patient consent for publication
Not applicable.
Competing interests
The authors declare that they have no competing
interests.
References
|
1
|
Wallimann T, Dolder M, Schlattner U, Eder
M, Hornemann T, Kraft T and Stolz M: Creatine kinase: An enzyme
with a central role in cellular energy metabolism. MAGMA.
6:116–119. 1998. View Article : Google Scholar : PubMed/NCBI
|
|
2
|
Zhao C, Shang L, Wang W and Jacobs DO:
Myocellular creatine and creatine transporter serine
phosphorylation after starvation. J Surg Res. 105:10–16. 2002.
View Article : Google Scholar : PubMed/NCBI
|
|
3
|
Sun L, Si M, Liu X, Choi JM, Wang Y,
Thomas SS, Peng H and Hu Z: Long-noncoding RNA Atrolnc-1 promotes
muscle wasting in mice with chronic kidney disease. J Cachexia
Sarcopenia Muscle. 9:962–974. 2018. View Article : Google Scholar : PubMed/NCBI
|
|
4
|
Zhang ZK, Li J, Guan D, Liang C, Zhuo Z,
Liu J, Lu A, Zhang G and Zhang BT: Long noncoding RNA lncMUMA
reverses established skeletal muscle atrophy following mechanical
unloading. Mol Ther. 26:2669–2680. 2018. View Article : Google Scholar : PubMed/NCBI
|
|
5
|
Chen R, Jiang T, She Y, Xu J, Li C, Zhou
S, Shen H, Shi H and Liu S: Effects of cobalt chloride, a
hypoxia-mimetic agent, on autophagy and atrophy in skeletal C2C12
myotubes. Biomed Res Int. 2017:70975802017.PubMed/NCBI
|
|
6
|
Chen R, She Y, Fu Q, Chen X, Shi H, Lei S,
Zhou S, Ou J and Liu Y: Differentially expressed coding and
noncoding RNAs in CoCl2-induced cytotoxicity of C2C12 cells.
Epigenomics. 11:423–438. 2019. View Article : Google Scholar : PubMed/NCBI
|
|
7
|
Mak RH, Ikizler AT, Kovesdy CP, Raj DS,
Stenvinkel P and Kalantar-Zadeh K: Wasting in chronic kidney
disease. J Cachexia Sarcopenia Muscle. 2:9–25. 2011. View Article : Google Scholar : PubMed/NCBI
|
|
8
|
Zwart SR, Davis-Street JE, Paddon-Jones D,
Ferrando AA, Wolfe RR and Smith SM: Amino acid supplementation
alters bone metabolism during simulated weightlessness. J Appl
Physiol (1985). 99:134–140. 2005. View Article : Google Scholar : PubMed/NCBI
|
|
9
|
Alzghoul Mb, Gerrard D, Watkins BA and
Hannon K: Ectopic expression of IGF-I and shh by skeletal muscle
inhibits disuse-mediated skeletal muscle atrophy and bone
osteopenia in vivo. FASEB J. 18:221–223. 2004. View Article : Google Scholar : PubMed/NCBI
|
|
10
|
Gregory CM, Vandenborne K, Huang HF,
Ottenweller JE and Dudley GA: Effects of testosterone replacement
therapy on skeletal muscle after spinal cord injury. Spinal Cord.
41:23–28. 2003. View Article : Google Scholar : PubMed/NCBI
|
|
11
|
Finkle WD, Greenland S, Ridgeway GK, Adams
JL, Frasco MA, Cook MB, Fraumeni JF Jr and Hoover RN: Increased
risk of non-fatal myocardial infarction following testosterone
therapy prescription in men. PLoS One. 9:e858052014. View Article : Google Scholar : PubMed/NCBI
|
|
12
|
Milan G, Romanello V, Pescatore F, Armani
A, Paik JH, Frasson L, Seydel A, Zhao J, Abraham R, Goldberg AL, et
al: Regulation of autophagy and the ubiquitin-proteasome system by
the FoxO transcriptional network during muscle atrophy. Nat Commun.
6:66702015. View Article : Google Scholar : PubMed/NCBI
|
|
13
|
Cid-Díaz T, Santos-Zas I, González-Sánchez
J, Gurriarán-Rodríguez U, Mosteiro CS, Casabiell X,
García-Caballero T, Mouly V, Pazos Y and Camiña JP: Obestatin
controls the ubiquitin-proteasome and autophagy-lysosome systems in
glucocorticoid-induced muscle cell atrophy. J Cachexia Sarcopenia
Muscle. 8:974–990. 2017. View Article : Google Scholar : PubMed/NCBI
|
|
14
|
Miller BF, Baehr LM, Musci RV, Reid JJ,
Peelor FF III, Hamilton KL and Bodine SC: Muscle-specific changes
in protein synthesis with aging and reloading after disuse atrophy.
J Cachexia Sarcopenia Muscle. Jul 16–2019.(Epub ahead of print).
doi: 10.1002/jcsm.12470. View Article : Google Scholar : PubMed/NCBI
|
|
15
|
Tanaka M, Sugimoto K, Fujimoto T, Xie K,
Takahashi T, Akasaka H, Kurinami H, Yasunobe Y, Matsumoto T, Fujino
H and Rakugi H: Preventive effects of low-intensity exercise on
cancer cachexia-induced muscle atrophy. FASEB J. 33:7852–7862.
2019. View Article : Google Scholar : PubMed/NCBI
|
|
16
|
Boltaña S, Valenzuela-Miranda D, Aguilar
A, Mackenzie S and Gallardo-Escárate C: Long noncoding RNAs
(lncRNAs) dynamics evidence immunomodulation during ISAV–Infected
Atlantic salmon (Salmo salar). Sci Rep. 6:226982016. View Article : Google Scholar : PubMed/NCBI
|
|
17
|
Chen R, Jiang T, She Y, Xie S, Zhou S, Li
C, Ou J and Liu Y: Comprehensive analysis of lncRNAs and mRNAs with
associated co-expression and ceRNA networks in C2C12 myoblasts and
myotubes. Gene. 647:164–173. 2018. View Article : Google Scholar : PubMed/NCBI
|
|
18
|
Cesana M, Cacchiarelli D, Legnini I,
Santini T, Sthandier O, Chinappi M, Tramontano A and Bozzoni I: A
long noncoding RNA controls muscle differentiation by functioning
as a competing endogenous RNA. Cell. 147:358–369. 2011. View Article : Google Scholar : PubMed/NCBI
|
|
19
|
Gong C, Li Z, Ramanujan K, Clay I, Zhang
Y, Lemire-Brachat S and Glass DJ: A long non-coding RNA, LncMyoD,
regulates skeletal muscle differentiation by blocking IMP2-mediated
mRNA translation. Dev Cell. 34:181–191. 2015. View Article : Google Scholar : PubMed/NCBI
|
|
20
|
Legnini I, Morlando M, Mangiavacchi A,
Fatica A and Bozzoni I: A feedforward regulatory loop between HuR
and the long noncoding RNA linc-MD1 controls early phases of
myogenesis. Mol Cell. 6:506–514. 2014. View Article : Google Scholar
|
|
21
|
Militello G, Hosen MR, Ponomareva Y,
Gellert P, Weirick T, John D, Hindi SM, Mamchaoui K, Mouly V,
Döring C, et al: A novel long non-coding RNA myolinc regulates
myogenesis through TDP-43 and Filip1. J Mol Cell Biol. 10:102–117.
2018. View Article : Google Scholar : PubMed/NCBI
|
|
22
|
Wang L, Zhao Y, Bao X, Zhu X, Kwok YK, Sun
K, Chen X, Huang Y, Jauch R and Esteban MA: LncRNA Dum interacts
with Dnmts to regulate Dppa2 expression during myogenic
differentiation and muscle regeneration. Cell Res. 25:335–350.
2015. View Article : Google Scholar : PubMed/NCBI
|
|
23
|
Zhang Z, Li J, Guan D, Liang C, Zhuo Z,
Liu J, Lu A, Zhang G and Zhang BT: A newly identified lncRNA MAR1
acts as a miR-487b sponge to promote skeletal muscle
differentiation and regeneration. J Cachexia Sarcopenia Muscle.
9:613–626. 2018. View Article : Google Scholar : PubMed/NCBI
|
|
24
|
Zhu M, Liu J, Xiao J, Yang L, Cai M, Shen
H, Chen X, Ma Y, Hu S, Wang Z, et al: Lnc-mg is a long non-coding
RNA that promotes myogenesis. Nat Commun. 8:147182017. View Article : Google Scholar : PubMed/NCBI
|
|
25
|
Xiong W, Jiang Y, Ai Y, Liu S, Wu XR, Cui
JG, Qin JY, Liu Y, Xia YX and Ju YH: Microarray analysis of long
non-coding RNA expression profile associated with
5-fluorouracil-based chemoradiation resistance in colorectal cancer
cells. Asian Pac J Cancer Prev. 16:3395–3402. 2015. View Article : Google Scholar : PubMed/NCBI
|
|
26
|
Du J, Zhang P, Zhao X, He J, Xu Y, Zou Q,
Luo J, Shen L, Gu H, Tang Q, et al: MicroRNA-351-5p mediates
skeletal myogenesis by directly targeting lactamase-β and is
regulated by lnc-mg. FASEB J. 33:1911–1926. 2019. View Article : Google Scholar : PubMed/NCBI
|
|
27
|
Neguembor MV, Jothi M and Gabellini D:
Long noncoding RNAs, emerging players in muscle differentiation and
disease. Skelet Muscle. 4:82014. View Article : Google Scholar : PubMed/NCBI
|
|
28
|
Simionescu-Bankston A and Kumar A:
Noncoding RNAs in the regulation of skeletal muscle biology in
health and disease. J Mol Med (Berl). 94:853–866. 2016. View Article : Google Scholar : PubMed/NCBI
|
|
29
|
Bartel DP: MicroRNAs: Genomics,
biogenesis, mechanism, and function. Cell. 116:281–297. 2004.
View Article : Google Scholar : PubMed/NCBI
|
|
30
|
Ivey KN and Srivastava D: MicroRNAs as
developmental regulators. Cold Spring Harb Perspect biol.
7:a0081442015. View Article : Google Scholar : PubMed/NCBI
|
|
31
|
Lei Z, Sluijter JP and van Mil A: MicroRNA
therapeutics for cardiac regeneration. Mini Rev Med Chem.
15:441–451. 2015. View Article : Google Scholar : PubMed/NCBI
|
|
32
|
Li J, Chan MC, Yu Y, Bei Y, Chen P, Zhou
Q, Cheng L, Chen L, Ziegler O, Rowe GC, et al: miR-29b contributes
to multiple types of muscle atrophy. Nat Commun. 8:152012017.
View Article : Google Scholar : PubMed/NCBI
|
|
33
|
Horak M, Novak J and Bienertova-Vasku J:
Muscle-specific microRNAs in skeletal muscle development. Dev Biol.
410:1–13. 2016. View Article : Google Scholar : PubMed/NCBI
|
|
34
|
Lagos-Quintana M, Rauhut R, Yalcin A,
Meyer J, Lendeckel W and Tuschl T: Identification of
tissue-specific microRNAs from mouse. Curr Biol. 12:735–739. 2002.
View Article : Google Scholar : PubMed/NCBI
|
|
35
|
Walden TB, Timmons JA, Keller P,
Nedergaard J and Cannon B: Distinct expression of muscle-specific
MicroRNAs (myomirs) in brown adipocytes. J Cell Physiol.
218:444–449. 2009. View Article : Google Scholar : PubMed/NCBI
|
|
36
|
Chen J, Mandel EM, Thomson JM, Wu Q,
Callis TE, Hammond SM, Conlon FL and Wang DZ: The role of
microRNA-1 and microRNA-133 in skeletal muscle proliferation and
differentiation. Nat Genet. 38:228–233. 2006. View Article : Google Scholar : PubMed/NCBI
|
|
37
|
McCarthy JJ and Esser KA: MicroRNA-1 and
microRNA-133a expression are decreased during skeletal muscle
hypertrophy. J Appl Physiol (1985). 102:306–313. 2007. View Article : Google Scholar : PubMed/NCBI
|
|
38
|
Boutz PL, Chawla G, Stoilov P and Black
DL: MicroRNAs regulate the expression of the alternative splicing
factor nPTB during muscle development. Gene Dev. 21:71–84. 2007.
View Article : Google Scholar : PubMed/NCBI
|
|
39
|
Anderson C, Catoe H and Werner R: MIR-206
regulates connexin43 expression during skeletal muscle development.
Nucleic Acids Res. 34:5863–5871. 2006. View Article : Google Scholar : PubMed/NCBI
|
|
40
|
Kim HK, Lee YS, Sivaprasad U, Malhotra A
and Dutta A: Muscle-specific microRNA miR-206 promotes muscle
differentiation. J Cell Biol. 174:677–687. 2006. View Article : Google Scholar : PubMed/NCBI
|
|
41
|
Antoniou A, Mastroyiannopoulos NP, Uney JB
and Phylactou LA: MiR-186 inhibits muscle cell differentiation
through myogenin regulation. J Biol Chem. 289:3923–3935. 2014.
View Article : Google Scholar : PubMed/NCBI
|
|
42
|
Guan L, Hu X, Liu L, Xing Y, Zhou Z, Liang
X, Yang Q, Jin S, Bao J, Gao H, et al: bta-miR-23a involves in
adipogenesis of progenitor cells derived from fetal bovine skeletal
muscle. Sci Rep. 7:437162017. View Article : Google Scholar : PubMed/NCBI
|
|
43
|
Mercatelli N, Fittipaldi S, De Paola E,
Dimauro I, Paronetto MP, Jackson MJ and Caporossi D: MiR-23-TrxR1
as a novel molecular axis in skeletal muscle differentiation. Sci
Rep. 7:72192017. View Article : Google Scholar : PubMed/NCBI
|
|
44
|
Hou L, Xu J, Jiao Y, Li H, Pan Z, Duan J,
Gu T, Hu C and Wang C: MiR-27b promotes muscle development by
inhibiting MDFI expression. Cell Physiol Biochem. 46:2271–2283.
2018. View Article : Google Scholar : PubMed/NCBI
|
|
45
|
Liu C, Wang M, Chen M, Zhang K, Gu L, Li
Q, Yu Z, Li N and Meng Q: MiR-18a induces myotubes atrophy by
down-regulating IgfI. Int J Biochem Cell Biol. 90:145–154. 2017.
View Article : Google Scholar : PubMed/NCBI
|
|
46
|
Liu C, Chen M, Wang M, Pi W, Li N and Meng
Q: MiR-18a regulates myoblasts proliferation by targeting Fgf1.
PLoS One. 13:e2015512018.
|
|
47
|
Chen J, Tao Y, Li J, Deng Z, Yan Z, Xiao X
and Wang DZ: MicroRNA-1 and microRNA-206 regulate skeletal muscle
satellite cell proliferation and differentiation by repressing
Pax7. J Cell Biol. 190:867–879. 2010. View Article : Google Scholar : PubMed/NCBI
|
|
48
|
Kallen AN, Zhou XB, Xu J, Qiao C, Ma J,
Yan L, Lu L, Liu C, Yi JS and Zhang H: The imprinted H19 lncRNA
antagonizes let-7 microRNAs. Mol Cell. 52:101–112. 2013. View Article : Google Scholar : PubMed/NCBI
|
|
49
|
Wang G, Wang Y, Xiong Y, Chen XC, Ma ML,
Cai R, Gao Y, Sun YM, Yang GS and Pang WJ: Sirt1 AS lncRNA
interacts with its mRNA to inhibit muscle formation by attenuating
function of miR-34a. Sci Rep. 6:218652016. View Article : Google Scholar : PubMed/NCBI
|
|
50
|
Chen R, Jiang T, Lei S, She Y, Shi H, Zhou
S, Ou J and Liu Y: Expression of circular RNAs during C2C12
myoblast differentiation and prediction of coding potential based
on the number of open reading frames and N6-methyladenosine motifs.
Cell Cycle. 17:1832–1845. 2018. View Article : Google Scholar : PubMed/NCBI
|
|
51
|
Li F, Li X, Peng X, Sun L, Jia S, Wang P,
Ma S, Zha H, Yu Q and Huo H: Ginsenoside Rg1 prevents
starvation-induced muscle protein degradation via regulation of
AKT/mTOR/FoxO signaling in C2C12 myotubes. Exp Ther Med.
14:1241–1247. 2017. View Article : Google Scholar : PubMed/NCBI
|
|
52
|
The Ministry of Science and Technology of
the People's Republic of China, . Guidance suggestions for the care
and use of laboratory animals. Sep 30–2006.
|
|
53
|
Livak KJ and Schmittgen TD: Analysis of
relative gene expression data using real-time quantitative PCR and
the 2(-Delta Delta C(T)) method. Methods. 25:402–408. 2001.
View Article : Google Scholar : PubMed/NCBI
|
|
54
|
Kim W, Kim J, Park H and Jeon J:
Development of microfluidic stretch system for studying recovery of
damaged skeletal muscle cells. Micromachines (Basel). 9:E6712018.
View Article : Google Scholar : PubMed/NCBI
|
|
55
|
von Roretz C, Beauchamp P, Di Marco S and
Gallouzi I: HuR and myogenesis: Being in the right place at the
right time. Biochim Biophys Acta. 1813:1663–1667. 2011. View Article : Google Scholar : PubMed/NCBI
|
|
56
|
Chen CM, Kraut N, Groudine M and Weintraub
H: I-mf, a novel myogenic repressor, interacts with members of the
MyoD family. Cell. 86:731–741. 1996. View Article : Google Scholar : PubMed/NCBI
|