Introduction
Selective serotonin/5-hydroxytryptamine (5-HT)
reuptake inhibitors (SSRIs) are considered first-line therapy for
the treatment of depression and account for ~60% of all
antidepressant drugs prescribed worldwide (1). These therapeutic agents are
prescribed for numerous psychiatric conditions, including
post-traumatic stress, generalized anxiety, panic and premenstrual
dysphoric disorders. In addition, they can be prescribed for
certain non-psychiatric conditions, including chronic pain,
fibromyalgia and post-menopausal vasomotor symptoms, such as night
sweats and hot flashes (2). SSRIs
act by antagonizing the 5-HT transporter (5HTT; also known as
SLC6A4), enhancing the amount of 5-HT available in the synaptic
cleft and potentiating serotonergic activity, thereby improving the
symptoms of major depressive disorders (3).
A functional 5-HT signaling pathway was identified
in bone in 2001 (4,5). A serotonin transporter has been
detected in all major bone cell types, including osteoblasts,
osteocytes and osteoclasts. Further investigation of this
peripheral 5-HT system revealed that SSRIs affect the serotonin
transporter in the central nervous system and bone with similar
potency (6).
A dose-dependent increase in fracture risk and low
bone mass has been reported to be associated with SSRI
administration and the reason for these effects is unknown;
however, direct and/or indirect 5-HT effects on bone cells may be
the underlying cause (7).
Osteoporosis results in a biomechanically weakened skeleton; delays
in bone healing resulting from medications, such as SSRIs, may
increase the chance of prosthesis implant failure and may result in
suboptimal outcomes (8).
The aim of the present study was to assess the
mechanisms underlying SSRI fluoxetine toxicity on mesenchymal stem
cells (MSCs) osteogenesis in vitro by measuring the
concentration of serotonin expressed in osteoblasts following the
administration of fluoxetine. In addition, the molecular pathways
associated with the toxic effects of fluoxetine on bone cells were
investigated by assessing the expression of specific genes.
Additionally, the extent of apoptosis occurring in bone cells in
response to various concentrations of fluoxetine was evaluated.
Materials and methods
Ethics statement and animals
The present study was conducted at the Medical
Experimental Research Center (MERC), Faculty of Medicine, Mansoura
University (Mansoura, Egypt). The protocol conducted in the present
study was approved by the medical ethical committee of the Faculty
of Medicine, Mansoura University.
Adipose tissue samples were collected from 12 male
Sprague Dawley rats (6–8 weeks old, 250–280 g), which were
purchased from the animal house at the MERC. The animals were
housed at 24±2°C, 60±10% relative humidity with a 12-h light/dark
cycle. The rats were acclimated to the laboratory conditions, fed
standard rat chow and water was available ad libitum. The
tissues were collected under the supervision of a responsible
veterinary doctor. The samples were collected in the operating room
under complete aseptic conditions, and subcutaneous,
intra-abdominal and peri-renal fat samples were obtained. The
samples were preserved in sterile glass bottles containing PBS
(Sigma Aldrich; Merck KGaA, Darmstadt, Germany) and immediately
transferred to the Stem Cell Laboratory (MERC) for processing.
Sample preparation procedures
Sample preparation was performed as described
previously (9). The samples were
washed numerous times with PBS supplemented with 10,000 units
penicillin, 10 mg/ml streptomycin and 25 µg amphotericin B per ml.
The samples were then sectioned into small pieces (1
mm3) and treated with collagenase type I (Gibco; Thermo
Fisher Scientific, Inc., Waltham, MA, USA). An adequate amount of
the enzyme (0.05% w/v) was added to the chopped fat tissue for 5
min and occasionally swirled in a water bath at 37°C. The action of
the enzyme was terminated using Dulbecco's modified Eagle's medium
(DMEM)-low glucose media supplemented with 10% fetal bovine serum
(FBS; both Sigma Aldrich; Merck KGaA) and 1% of
penicillin/streptomycin/amphotericin; the suspension was then
centrifuged at 200 × g and 4°C for 10 min. Subsequently, the top
oily layer was discarded and the remaining fluid was filtered
through a 70-µm filter and centrifuged at 200 × g and 4°C for 10
min. Cell viability was assessed using a Trypan blue exclusion
assay. Cell viability was calculated as the number of viable cells
divided by the total number of cells within the grids on the
hemocytometer. If the cells took up trypan blue, they were
considered non-viable. First the cell density of the cell line
suspension was determined using a hemocytometer. Then, 0.4%
solution of trypan blue in PBS was prepared, pH 7.2 to 7.3. A total
of 0.1 ml trypan blue stock solution was added to 0.1 ml cells. The
hemocytometer was loaded and the cells were examined immediately
under light microscope at low magnification. Cell counting was done
by counting the number of blue staining cells and the number of
total cells. (% viable cells=[1.00-(Number of blue cells÷Number of
total cells)] ×100). The number of viable cells per ml culture was
calculated using the formula below:
Number of viable cells ×104x1.1=cells/ml
culture and cell count was 1×10⁶ cells/mg tissue.
Cells were cultured in Dulbecco's modified Eagle's
medium (DMEM)-low glucose media (Sigma Aldrich; Merck KGaA)
supplemented with 10% FBS, 10,000 U penicillin and 10 mg/ml
streptomycin, in two 75-cm2 tissue culture flasks and
maintained in an incubator at 37°C containing 5% CO2.
Cells were harvested once confluence reached 80% and cells from
passage 3 were used for flow cytometric analysis.
As described by Zimmerlin et al (10), flow cytometric analysis was
conducted to detect cellular expression of mouse anti-cluster of
differentiation (CD)106 (cat. no. BBA5), anti-CD166 (cat. no.
MAB6561), anti-CD146 (cat. no. MAB932), anti-CD105 (cat. no.
MAB10971), anti-CD44 (cat. no. BBA10), anti-CD19 (cat. number
MAB4867), anti-CD45 (cat. no. MAB1430), anti-CD90 (cat. no.
MAB2067) and anti-Stro-1 (cat. no. MAB1038). The monoclonal
antibodies (R&D Systems, Inc., Minneapolis, MN, USA) were
conjugated to fluorescence isothiocyanate (FITC); for each marker,
90 µl of the cell suspension was added to 10 µl of antibody
(dilution 1:10) and the cells were incubated for 30 min in dark at
room temperature with the antibodies [Secondary developing reagent
(cat. no. F0103B), Flow Cytometry Staining Buffer (R&D Systems,
Inc.; cat. no. FC001) and isotype controls (R&D Systems, Inc.;
cat. nos. MAB002 and MAB003; Caltag®; cat. no. MGM00].
Sterile PBS was used as a washing agent.
Osteogenic differentiation
Cells from passage 3 were seeded in 6-well plates at
a density of 5×10⁴ cells/well. Following 24 h, the media
were replaced with osteogenic media, which consisted of DMEM-low
glucose media supplemented with 10% FBS, 100 units penicillin/ml,
100 mg streptomycin/ml, 10 mM b-glycerophosphate, 50 mg/ml
2-phosphate ascorbate and 10 nM dexamethasone (11). After 1 week, the cells were stained
for calcium deposits using Alizarin red (Sigma Aldrich; Merck KGaA)
for 30 min at room temperature in the dark. In addition to
osteogenic differentiation, adipogenic differentiation was
conducted to confirm multilineage differentiation potency of this
population. Cells from passage 3 were seeded in 6-well plates at a
density of 5×10⁴ cells/well. After 24 h, the media were
replaced with adipogenic media, which consisted of DMEM-low glucose
media supplemented with 10% FBS, with 10,000 units penicillin, 10
mg/ml streptomycin, 0.5 µmol/l isobutylmethylxanthine (1,000×0.5 mM
in methanol), 50 µmol/l indomethacin (1,000×50 mM in methanol), and
0.5 µmol/l dexamethasone (1,000×0.5 mM in water; all from
Sigma-Aldrich; Merck KGaA) (12).
The medium was changed every 3 days; after 2 weeks, cytoplasmic oil
droplets were assessed via Oil Red O staining (20 min in dark at
room temperature).
Drug application
Fluoxetine hydrochloride (Eli Lilly, Patheon France,
France) was added to the media at the following concentrations:
0.5, 0.8, 1, 3, 5, 7, 10, 20 and 30 µmol/l for 5 days at 37°C with
5% CO2, and the media were replaced on days 0 and 3.
Cells cultured in drug-free medium were considered the control
group. Morphological alterations were observed at day 5 in all
plates using an inverted microscope (Olympus Corporation, Tokyo,
Japan) and the cells were analyzed by flow cytometry to detect the
apoptotic markers Annexin V and caspase-3.
Detection of apoptosis
Annexin V analysis
A total of 1×10⁵ cells from all groups
were stained with propidium iodide (PI) and FITC Annexin V (BD
Pharmingen; BD Biosciences, Franklin Lakes, NJ, USA). Briefly, 100
µl cell suspension was incubated with 5 µl FITC Annexin V and 5 µl
PI in the dark for 15 min at room temperature; 400 µl binding
buffer was added immediately prior to flow cytometric analysis
using BD Accuri C6 software (BD Pharmingen; BD Biosciences).
Caspase-3 analysis
Briefly, the cells were washed twice with PBS, and
1×10⁵ cells from each group were incubated with 10 µl
anti-caspase-3 conjugated to FITC (BD Pharmingen; BD Biosciences)
in the dark for 20 min at room temperature. The cells were washed
again with PBS, centrifuged for 5 min at 560 × g at 22–25°C,
stained with the FITC rabbit anti-active caspase-3 antibody for 30
min at room temperature, then washed, and suspended in BD
Perm/Wash™ buffer (component of cat. no. 554714) before analyzing
by flow cytometry Accuri C6 software (BD Pharmingen; BD
Biosciences).
Quantitative assessment of
serotonin
The levels of serotonin present in the groups
treated with various concentrations of fluoxetine and in the
control group were assessed using a\serotonin ELISA kit (H0533;
Glory Science Co., Ltd., Shanghai, China) according to the
manufacturer's protocols. The culture supernatants were collected
from the plates and preserved for ELISA. The samples were prepared
by diluting 5-fold with a sample dilution reagent. The wells were
covered with adhesive strips and incubated for 30 min at 37°C.
Following incubation, the adhesive strips were removed, the liquids
(the sample tested and the standards for washing) were discarded,
the wells were manually washed five times, each with the diluted
wash solution and horseradish peroxidase was added to each well
except the blank. Subsequently, the wells were incubated again for
30 min at 37°C. Following incubation, the wells were washed again
and 50 µl chromogen solution A and chromogen solution B were added
to all wells and incubated for 15 min at 37°C. The reaction was
terminated by adding the stop solution, following which the color
changed from blue to yellow. The color change was measured at 450
nm using a spectrophotometer. Data were calculated according to the
following equation: y=0.0115 × +0.1153 and
R2=0.9606.
Assessment of serotonergic genes
Assays were conducted to quantify the expression
levels of the following serotonergic receptors: Serotonin 1B
receptor (HTR1B), serotonin 2A receptor (HTR2A), serotonin 2B
receptor (HTR2B) and serotonin transporter (SLC6A4) under the
effects of various drug concentrations of fluoxetine (1, 3, 5, 7,
and 10 µmol/l). Total RNA was extracted from all samples after 5
days of differentiation using an RNA extraction kit (Promega
Corporation, Madison, WI, USA). The concentration and quality of
extracted RNA were assessed with a Nanophotometer P-330 (Implen
GmbH, Munich, Germany). A total of 3 µg RNA was reverse transcribed
using a SensiFast cDNA Synthesis kit (Bioline Reagents, Ltd.,
London, UK) according to the manufacturer's protocols.
Quantification of mRNA expression levels was performed via reverse
transcription-quantitative polymerase chain reaction (RT-qPCR)
using the SensiFast SYBR green system (Bioline Reagents, Ltd.). The
reaction mixture contained 5 µl template cDNA with 1 µl (10 pM)
forward and reverse primers of the specific genes, and 10 µl SYBR
green premix, in a total volume of 20 µl. The thermocycling
conditions were as follows: Denaturation at 95°C for 2 min followed
by 40 cycles of denaturation consisting of 5 sec at 95°C and
annealing for 30 sec at 55°C for HTR1B, 60°C for HTR2A, 53°C for
HTR2B, 53°C for SLC6A4 and 58°C for GAPDH and extension at 72°C for
10 sec. The expression values were measured using the
2−ΔΔCq method (13) and
data were normalized to the loading control gene GAPDH. The primer
sequences of the selected genes, as well as the loading control
gene, were obtained from NCBI (https://www.ncbi.nlm.nih.gov/nuccore). The forward and
reverse sequences are presented in Table I.
 | Table I.Primer sequences of serotonergic
genes. |
Table I.
Primer sequences of serotonergic
genes.
| Gene | Forward | Reverse |
|---|
| HTR1B |
5′-GATTGCCACAGTGTACCGGA-3′ |
5′-CAGGATGGACACAAGCAGGT-3 |
| HTR2B |
5′-CTCACTGGCTGCCTTCTTCA-3′ |
5′-GCGTTGAGGTGGCTTGTTTT-3′ |
| HTR2A |
5′-TCGTCATCATGGCAGTGTCC-3′ |
5′-ACAAGGAAACCCAGCAGCAT-3′ |
| SLC6A4 |
5′-TTGGCTATGCTGTGGACCTG-3′ |
5′-TGATGGTGTAGGGGAGGAGG-3′ |
| GAPDH |
5′-CTCTGCTCCTCCTGTTCGAC-3′ |
5′-GCGCCCAATACGACCAAATC-3′ |
Statistical analysis
Data were tabulated and analyzed using SPSS version
23.0 (IBM Corp., Armonk, NY, USA). Data are presented as the mean ±
standard deviation or the median and interquartile range (IQR). All
experiments were performed once only. Significant differences were
determined by one way analysis of variance, followed by a post-hoc
Tukey test for parametric data, and a Kruskal Wallis test was
performed for the analysis of non-parametric data. P<0.05 was
considered to indicate a statistically significant difference.
Results
Rat MSCs isolation and
characterization
Cells isolation
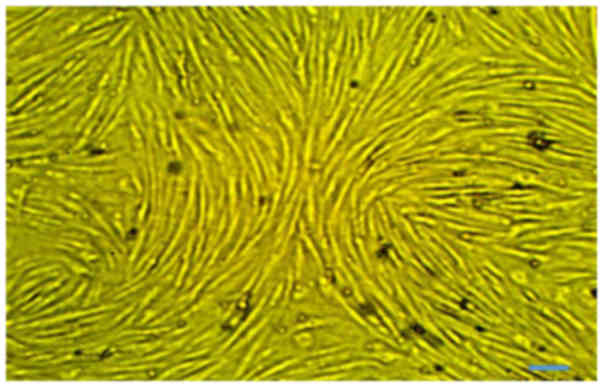
Rat MSCs were isolated from 10 g adipose tissue:
1×10⁶ cells/g. At passage 3, no major morphological
alterations were observed during cell passaging. The primary and
proliferating cells were fusiform in shape and exhibited
fibroblast-like morphologies. The undifferentiated cells were
observed to have small bodies with few cell processes, which were
long and thin. The cell bodies contained a large, round nucleus
with clear appearance (Fig.
1).
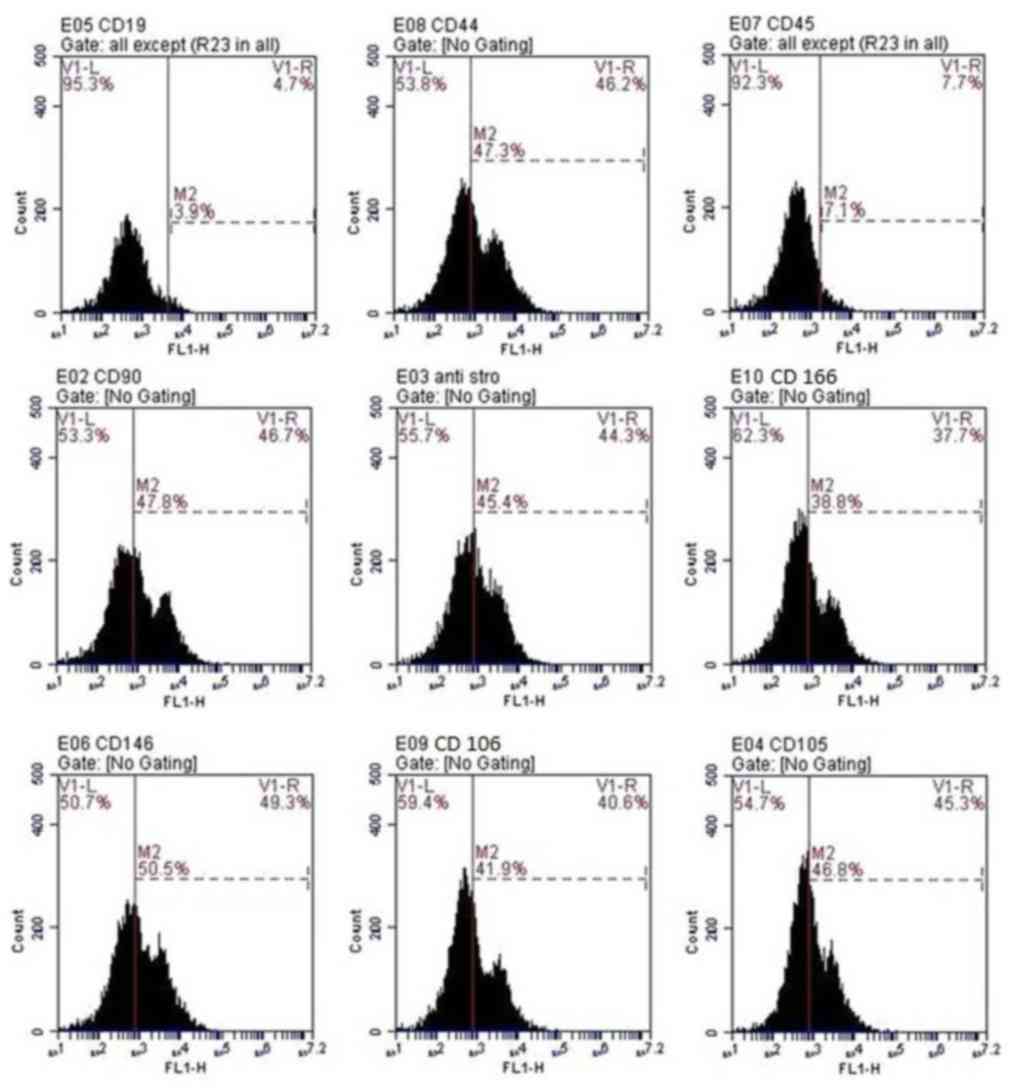
Cell characterization
Flow cytometric analysis of cells at passage 3
revealed that cells were positive for CD166, CD105, CD106,
anti-Stro-1, CD146, CD44 and CD90. Conversely, the hematopoietic
lineage markers, CD45 and CD19 were negative in >92% of cells
(Fig. 2).
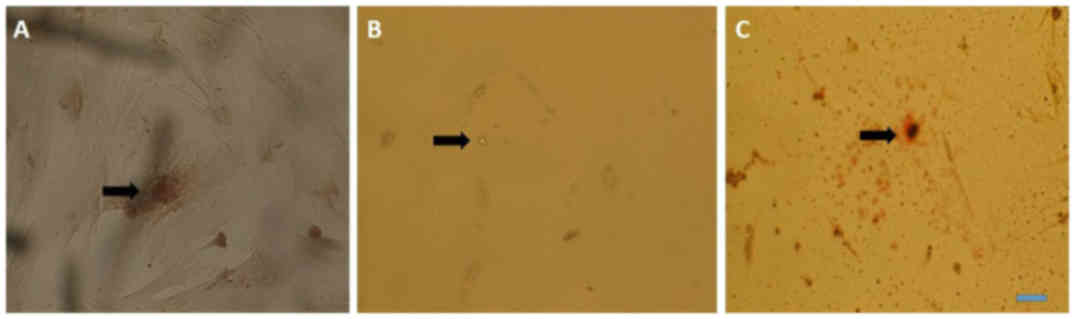
Multilineage differentiation for the
determination of osteogenic differentiation
Cells from passage 3 to 7 were used for
differentiation; calcium deposits and matrix mineralization were
detected in the cytoplasm at day 5 using Alizarin red (Fig. 3A). For adipogenic differentiation,
cells from passage 3 to 7 were used for differentiation; oil
droplets were observed in the cytoplasm after 7 days of
differentiation and were clear without staining, however; oil
droplets became more evident when stained with Oil Red O (Fig. 3B and C).
Cell treatment with fluoxetine
Various morphological alterations were observed in
the treatment groups: Shredding (loss of cellular adherence and
integrity), absence of calcium deposits and cluster formations.
These alterations were confirmed by flow cytometric analysis of the
apoptotic markers caspase-3 and Annexin V.
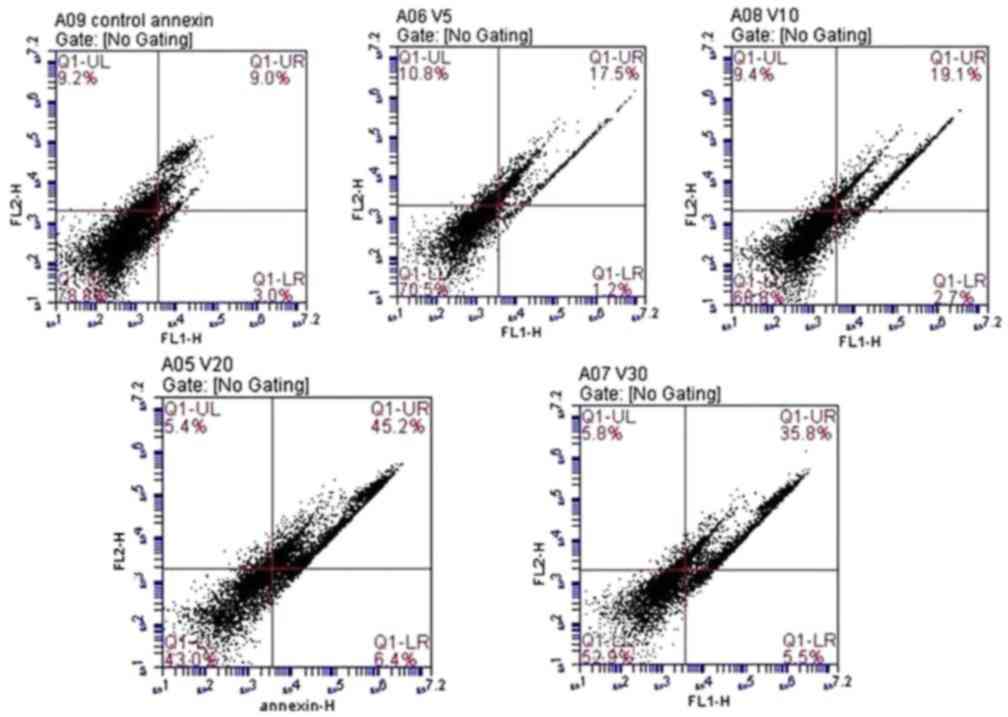
Annexin V-FITC detection
There was a significant dose-dependent increase in
apoptotic cells in response to increasing doses of fluoxetine.
Highly significant late apoptosis was observed in cells treated
with 20 µmol/l fluoxetine (45.2±6.1%). The lowest level of
apoptosis was observed in cells treated with 5 µmol/l fluoxetine
(17.5±3.7%). Data are presented in Fig. 4.
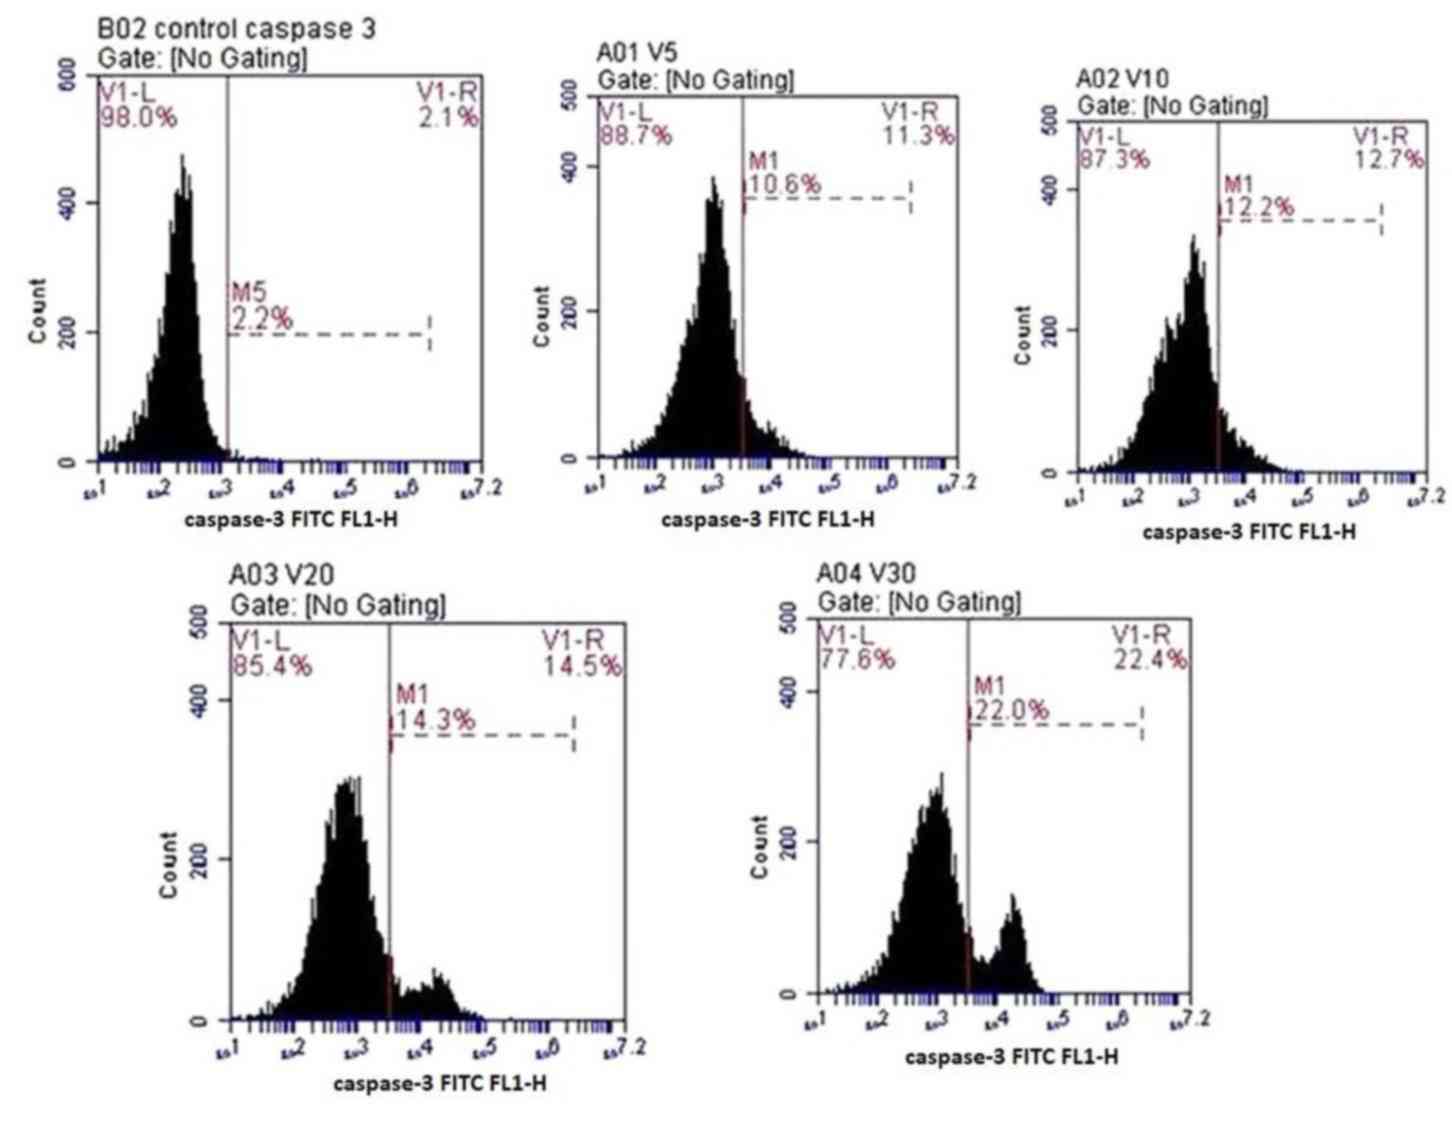
Caspase-3 detection
Anti-active caspase-3 antibodies were used to
quantify the expression of caspase-3 in the osteoprogenitor cells
under the effects of various concentrations of fluoxetine. The
number of cells stained positive for caspase-3 was increased in a
dose-dependent manner. The highest level of apoptosis was detected
in cells treated with 30 µmol/l fluoxetine (22±4.5%). The lowest
level of apoptosis was detected in cells treated with 5 µmol/l
fluoxetine (10.6±2.3%). Data are presented in Fig. 5.
ELISA analysis of serotonin
The amount of serotonin in the culture supernatants
was measured at day 5 for all fluoxetine-treated groups (1, 3, 5, 7
and 10 µmol/l fluoxetine) and the control group. Data were
expressed as the median and IQR, and a Kruskal Wallis test was used
to determine significance (Table
II). There was no significant difference in extracellular
serotonin concentrations in response to increasing doses of
fluoxetine when compared with the control group (P=0.098).
| Table II.Comparison between serotonin
concentrations and increasing doses of fluoxetine. |
Table II.
Comparison between serotonin
concentrations and increasing doses of fluoxetine.
|
| Control group | 1 µmol/l group | 3 µmol/l group | 5 µmol/l group | 7 µmol/l group | 10 µmol/l
group | P-value |
|---|
| Median | 15.93 | 29.45 | 15.89 | 15.15 | 19.94 | 58 | 0.098 |
| IQR | 7.082 | 23.63 | 8.941 | 8.256 | 11.06 | 8.800 |
|
|
| 22.73 | 42.80 | 69.34 | 18.80 | 22.80 | 18.80 |
|
RT-qPCR analysis of serotonergic
genes
The results of RT-qPCR analysis demonstrated that a
statistically significant dose-dependent increase in the expression
levels of serotonergic receptors, including HTR1B, HTR2A and HTR2B,
as well as the serotonin transporter SLC6A4, was detected in
osteoprogenitor cells in response to increasing doses of
fluoxetine. The expression levels of all receptors were increased
in response to 10 µmol/fluoxetine and the lowest levels of
expression were reported in cells treated with 3 µmol/fluoxetine;
however, all expression levels were significantly lower compared
with the control group (P<0.001; Fig. 6). These results suggested that rat
bone cells may exhibit higher expression levels of HTR2A compared
with HTR1B and HTR2B in response to fluoxetine.
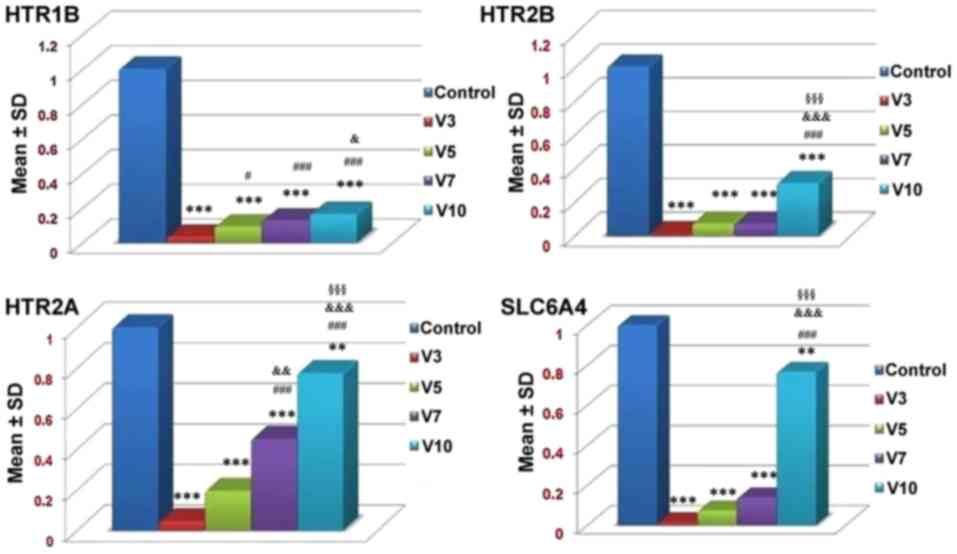 | Figure 6.mRNA expression levels of HTR1B,
HTR2B, HTR2A and SLC6A4 receptors in the control and
fluoxetine-treated groups. Fluoxetine downregulated all
investigated serotonergic genes and SLC6A4. V3 refers to 3 µmol/l
fluoxetine, V5 refers to 5 µmol/l fluoxetine, V7 refers to 7 µmol/l
fluoxetine and V10 refers to 10 µmol/l fluoxetine. **P<0.01,
***P<0.001, vs. the control. #P<0.05,
###P<0.001 vs. V3. &P<0.05,
&&&P<0.001 vs. V5.
§§§P<0.001 vs. V7. HTR1B, serotonin 1B receptor;
HTR2A, serotonin 2A receptor; HTR2B, serotonin 2B receptor; SD,
standard deviation; SLC6A4, serotonin transporter. |
Discussion
SSRIs are the most common type of drug used to treat
psychiatric disorders and are the first line treatment for major
depressive and anxiety disorders (14). Several in vitro studies have
reported the presence of serotonin receptors in primary bone cells
and/or bone cell lines, which mainly harbor HTR1A, HTR2A and HTR2B
binding sites (4,5). Conflicting data have been reported
regarding the effects of serotonin and SSRIs on bone; both
beneficial and detrimental effects have been observed (15).
In the present study, the effects of fluoxetine on
osteoprogenitor cells were investigated using rat adipose
tissue-derived MSCs as a source of osteoprogenitor cells. In depth
analysis of the effects of fluoxetine on bone cells in vitro
was conducted using histochemical analysis with Alizarin red
staining. Subsequently, flow cytometric detection of the extent of
cell apoptosis was conducted using Annexin V and caspase-3 markers,
and the expression levels of serotonin in the cell supernatant were
detected in response to various concentrations of fluoxetine using
ELISA. Additionally, RT-qPCR analysis of serotonergic genes was
performed to elucidate the underlying molecular pathways associated
with the effects of fluoxetine on osteoprogenitor cells.
The results of the present study demonstrated that
fluoxetine inhibited osteoprogenitor cell proliferation,
differentiation and mineralization in a dose-dependent manner,
which may occur via the apoptotic pathway alongside downregulated
expression levels of serotonin-associated genes independent of
serotonin concentration. Various morphological alterations were
reported in cells in response to increasing doses of fluoxetine.
Flow cytometric analysis of apoptosis using Annexin V and
caspasee-3 markers supported these morphological alterations;
increased levels of apoptosis were associated with increasing doses
of fluoxetine in the present study. A concentration of 20 µmol/l
was associated with cytotoxicity; the proportion of apoptotic cells
was ~45.5% by annexin staining. The present study observed that
this cytotoxic effect may be independent of the levels of serotonin
within cells. Analysis of intracellular serotonin levels following
exposure to various concentrations of fluoxetine indicated that
there was an insignificant association between drug dose and the
levels of serotonin released. This result supported the hypothesis
that apoptosis may be the mechanism underlying the detrimental
effects of fluoxetine on osteoprogenitor cells. RT-qPCR analysis
detected a significant dose-dependent downregulation of all
serotonergic genes, including HTR1A, HTR2A and HTR2B, and SLC6A4.
The expression of the HTR2A receptor was the most significantly
affected within all treated groups, suggesting an important role of
these G-protein coupled receptors on growing bone cells which might
need further research work.
The findings of the present study are consistent
with those of Hodge et al (16), who conducted a systematic in
vitro study investigating the effect of fluoxetine and other
SSRIs on trabecular bone cells. In addition, it was reported that
treatment of human osteoblasts with increasing doses of exogenous
serotonin (3–30 µmol/l) exhibits no effect on bone mineralization
or alkaline phosphatase activity (16). However, Ortuño et al
(17) revealed the inhibitory
effect of fluoxetine on developing bone cells; alternative
molecular pathways were suggested (17). Ortuño et al (17) identified a dual role of fluoxetine
on bone remodeling, in which short-term (3 weeks) treatment with
fluoxetine was revealed to result in a local anti-resorptive
response that increases bone mass, directly impairing osteoclast
differentiation and function via a serotonin reuptake-independent
Ca2+-calmodulin-nuclear factor of activated T cells
1-dependent mechanisms. However, chronic treatment (6 weeks) with
fluoxetine was revealed to induce a central serotonin-dependent
increase in sympathetic output flow, which results in increased
bone resorption sufficient to counteract the local anti-resorptive
effects, therefore leading to a net effect of decreased bone
formation and bone loss (17).
The present study proposed that fluoxetine induces
apoptosis in differentiating bone cells and reduces osteoblasts
proliferation (as tested by measuring cell viability),
mineralization of the bone cells and the formation of new healthy
cells; some studies have indicated that fluoxetine not only
inhibits the activity of serotonin but also directly affects cell
proliferation and apoptosis in other body tissues: Fluoxetine has
been reported to induce apoptosis of the hippocampus and cortical
neuronal cells within developing rats as demonstrated by Schaz
et al (18).
A recent in vivo study conducted by Rafiei
et al (19) investigated
the effects of fluoxetine on maxillary teeth in rats by
administering fluoxetine (10 mg/kg) intraperitoneally 5 times/week
for 1 month. The results indicated that fluoxetine exerts an
inhibitory effect on osteoprogenitor cell regeneration (19). The findings of the present study
regarding the effects of fluoxetine on serotonergic genes were
consistent with those of Gustafsson et al (20), who reported that stimulation of
HTR2A receptors results in reduced signaling for differentiation
within osteoblasts. Additionally, it has been reported that the
expression levels of HTR2A were higher compared with HTR2B within
rat bone cells (21,22). In the present work, it was
demonstrated that fluoxetine may have a direct inhibitory effect on
the expression of this receptor. To investigate this theory
regarding the effect of fluoxetine, more research regarding this
point is necessary.
Compared with the findings of the present study,
previous reports have demonstrated positive anabolic effects of
fluoxetine on bone cells. Battaglino et al (23) demonstrated that treatment of
Swiss-Webster mice with fluoxetine at a dose of 10 mg/kg/d may
stimulate bone formation in the femur and lumbar vertebrae.
Mortazavi et al (24)
reported an increase in bone formation following treatment with
fluoxetine of rats with calvarial small-size bone defects. A
possible explanation for this difference in results may be the
variation in the fluoxetine treatment protocol, using different
strains of animals or genetic differences in the origin of the
tested cells. The results of Nam et al (22) were in accordance with those of the
present study regarding the inhibitory effects of fluoxetine on
bone cells, however; serotonin was proposed to exhibit a direct
inhibitory effect on osteoprogenitor cells (22), contradictory to the results of the
present study.
In conclusion, the present study demonstrated a
direct inhibitory effect of fluoxetine on bone cells, which may be
dependent on apoptosis rather than on serotonin levels.
Additionally, there was an overall down regulation in the
expression of serotonin receptors HTR1B, HTR2A, HTR2B as well as
5HTTT (SLC6A4) in response to varying doses of fluoxetine. The
findings of the present study may indicate that fluoxetine
consumption negatively affects bone mineral density with the
possible increase in the rate of bone fracture.
Acknowledgements
Not applicable.
Funding
The present study was supported by funding from
Mansoura University competitive grants program (MAS, MS, 2015) and
International Society for Neurochemistry (ISN) CAEN grant 2017.
Category 1B (MS).
Availability of data and materials
The datasets used and/or analyzed during the current
study are available from the corresponding author on reasonable
request.
Authors' contributions
MS, AL and MAS designed the study; SMK, MS and MEH
performed the experiments; SMK, MS, MEH, MESAK, AL, SAH, SAGE and
MAS performed data analysis; and, SMK, MS and MEH wrote the
manuscript.
Ethics approval and consent to
participate
The protocol conducted in the present study was
approved by the medical ethical committee of the Faculty of
Medicine, Mansoura University (Mansoura, Egypt).
Patient consent to participate
Not applicable.
Competing interests
The authors declare that they have no competing
interests.
References
|
1
|
Haney EM, Chan BK, Diem SJ, Ensrud KE,
Cauley JA, Barrett-Connor E, Orwoll E and Bliziotes MM;
Osteoporotic Fractures in Men Study Group, : Association of low
bone mineral density with selective serotonin reuptake inhibitor
use by older men. Arch Intern Med. 167:1246–1251. 2007. View Article : Google Scholar : PubMed/NCBI
|
|
2
|
Haney EM, Warden SJ and Bliziotes MM: The
effects of selective serotonin reuptake inhibitors on bone health
in adults: Time for recommendations about screening, prevention and
management? Bone. 46:13–17. 2010. View Article : Google Scholar : PubMed/NCBI
|
|
3
|
Chen F, Hahn TJ and Weintraub NT: Do SSRIs
play a role in decreasing bone mineral density? J Am Med Dir Assoc.
13:413–417. 2012. View Article : Google Scholar : PubMed/NCBI
|
|
4
|
Bliziotes MM, Eshleman AJ, Zhang XW and
Wiren KM: Neurotransmitter action in osteoblasts: Expression of a
functional system for serotonin receptor activation and reuptake.
Bone. 29:477–486. 2001. View Article : Google Scholar : PubMed/NCBI
|
|
5
|
Westbroek I, van der Plas A, de Rooij KE,
Klein-Nulend J and Nijweide PJ: Expression of serotonin receptors
in bone. J Biol Chem. 276:28961–28968. 2001. View Article : Google Scholar : PubMed/NCBI
|
|
6
|
Chau K, Atkinson SA and Taylor VH: Are
selective serotonin reuptake inhibitors a secondary cause of low
bone density? J Osteoporos. 2012:3230612012. View Article : Google Scholar : PubMed/NCBI
|
|
7
|
Bab I and Yirmiya R: Depression, selective
serotonin reuptake inhibitors, and osteoporosis. Curr Osteoporos
Rep. 8:185–191. 2010. View Article : Google Scholar : PubMed/NCBI
|
|
8
|
Bradaschia-Correa V, Josephson AM, Mehta
D, Mizrahi M, Neibart SS, Liu C, Kennedy OD, Castillo AB, Egol KA
and Leucht P: The selective serotonin reuptake inhibitor fluoxetine
directly inhibits osteoblast differentiation and mineralization
during fracture healing in mice. J Bone Miner Res. 32:821–833.
2017. View Article : Google Scholar : PubMed/NCBI
|
|
9
|
Zuk PA, Zhu M, Ashjian P, De Ugarte DA,
Huang JI, Mizuno H, Alfonso ZC, Fraser JK, Benhaim P and Hedrick
MH: Human adipose tissue is a source of multipotent stem cells. Mol
Biol Cell. 13:4279–4295. 2002. View Article : Google Scholar : PubMed/NCBI
|
|
10
|
Zimmerlin L, Donnenberg VS and Donnenberg
AD: Rare event detection and analysis in flow cytometry: Bone
marrow mesenchymal stem cells, breast cancer stem/progenitor cells
in malignant effusions, and pericytes in disaggregated adipose
tissue. Methods Mol Biol. 699:251–273. 2011. View Article : Google Scholar : PubMed/NCBI
|
|
11
|
Halvorsen YD, Franklin D, Bond AL, Hitt
DC, Auchter C, Boskey AL, Paschalis EP, Wilkison WO and Gimble JM:
Extracellular matrix mineralization and osteoblast gene expression
by human adipose tissue-derived stromal cells. Tissue Eng.
7:729–741. 2001. View Article : Google Scholar : PubMed/NCBI
|
|
12
|
Salamh M, Mehanna R, Hanafy Sh and Abdel
Ghafar H: The usage of liver extract verses growth factors in the
differentiation of mesenchymal stem cells into hepatocyte like
cells. J Int Acad Res Multidisciplinary. 2:35–50. 2014.
|
|
13
|
Livak KJ and Schmittgen TD: Analysis of
relative gene expression data using real-time quantitative PCR and
the 2(-Delta Delta C (T)) method. Methods. 25:402–408. 2001.
View Article : Google Scholar : PubMed/NCBI
|
|
14
|
Dale E, Bang-Andersen B and Sánchez C:
Emerging mechanisms and treatments for depression beyond SSRIs and
SNRIs. Biochem Pharmacol. 95:81–97. 2015. View Article : Google Scholar : PubMed/NCBI
|
|
15
|
Tsapakis EM, Gamie Z, Tran GT, Adshead S,
Lampard A, Mantalaris A and Tsiridi E: The adverse skeletal effects
of selective serotonin reuptake inhibitors. Eur Psychiatry.
27:156–169. 2012. View Article : Google Scholar : PubMed/NCBI
|
|
16
|
Hodge JM, Wang Y, Berk M, Collier FM,
Fernandes TJ, Constable MJ, Pasco JA, Dodd S, Nicholson GC, Kennedy
RL and Williams LJ: Selective serotonin reuptake inhibitors inhibit
human osteoclast and osteoblast formation and function. Biol
Psychiatry. 74:32–39. 2013. View Article : Google Scholar : PubMed/NCBI
|
|
17
|
Ortuño MJ, Robinson ST, Subramanyam P,
Paone R, Huang YY, Guo XE, Colecraft HM, Mann JJ and Ducy P:
Serotonin-reuptake inhibitors act centrally to cause bone loss in
mice by counteracting a local anti-resorptive effect. Nat Med.
22:1170–1179. 2016. View
Article : Google Scholar : PubMed/NCBI
|
|
18
|
Schaz U, Föhr KJ, Liebau S, Fulda S,
Koelch M, Fegert JM, Boeckers TM and Ludolph AG: Dose-dependent
modulation of apoptotic processes by fluoxetine in maturing
neuronal cells: An in vitro study. World J Biol Psychiatry.
12:89–98. 2011. View Article : Google Scholar : PubMed/NCBI
|
|
19
|
Rafiei M, Sadeghian S, Torabinia N and
Hajhashemi V: Systemic effects of fluoxetine on the amount of tooth
movement, root resorption, and alveolar bone remodeling during
orthodontic force application in rat. Dent Res J (Isfahan).
12:482–487. 2017.
|
|
20
|
Gustafsson BI, Westbroek I, Waarsing JH,
Waldum H, Solligård E, Brunsvik A, Dimmen S, van Leeuwen JP,
Weinans H and Syversen U: Long-term serotonin administration leads
to higher bone mineral density, affects bone architecture, and
leads to higher femoral bone stiffness in rats. J Cell Biochem.
97:1283–1291. 2006. View Article : Google Scholar : PubMed/NCBI
|
|
21
|
Dai SQ, Yu LP, Shi X, Wu H, Shao P, Yin GY
and Wei YZ: Serotonin regulates osteoblast proliferation and
function in vitro. Braz J Med Biol Res. 47:759–765. 2014.
View Article : Google Scholar : PubMed/NCBI
|
|
22
|
Nam SS, Lee JC, Kim HJ, Park JW, Lee JM,
Suh JY, Ums HS, Kim JY, Lee Y and Kim YG: Serotonin inhibits
osteoblast differentiation and bone regeneration in rats. J
Periodontol. 87:461–469. 2016. View Article : Google Scholar : PubMed/NCBI
|
|
23
|
Battaglino R, Vokes M, Schulze-Späte U,
Sharma A, Graves D, Kohler T, Müller R, Yoganathan S and Stashenko
P: Fluoxetine treatment increases trabecular bone formation in
mice. J Cell Biochem. 100:1387–1394. 2007. View Article : Google Scholar : PubMed/NCBI
|
|
24
|
Mortazavi SH, Khojasteh A, Vaziri H,
Khoshzaban A, Roudsari MV and Razavi SH: The effect of fluoxetine
on bone regeneration in rat calvarial bone defects. Oral Surg Oral
Med Oral Pathol Oral Radiol Endod. 108:22–27. 2009. View Article : Google Scholar : PubMed/NCBI
|