Introduction
According to the guidelines from the World Health
Organization, gliomas are categorized into grades I to IV.
Glioblastoma multiforme (GBM) is classified as grade IV and it is a
highly malignant form (1,2). GBM has been recognized as the most
aggressive type of brain tumor with highly infiltrative ability
(3), affecting about ~20,000
people every year in the United States (4). Currently, the treatments for GBM
include surgical resection, chemotherapy and radiotherapy (5). However, due to the aggressiveness of
gliomas and their resistance to chemotherapy and radiation therapy
(6,7), the prognosis of GBM is still poor
with a median survival time of 12–15 months for patients with GBM
(8,9). In recent years, targeted therapies,
such as combinatorial chemotherapy targeting molecular subgroups
and gene and immune therapies, have made important progress in
preclinical models (10–12). However, the potential molecular
mechanism in the pathogenesis of GBM needs to be further
investigated. In order to improve the prognosis of GBM patients, it
is important to identify molecular mechanism underlying GBM
pathogenesis.
In recent years, a number of studies have
investigated the potential molecular mechanisms of GBM. It has been
reported that the upregulation and mutations in EGFR may be
responsible for the resistance of glioma cells to the treatments
with chemotherapy and radiation (13–15).
Additionally, Annexin-A5 over-activation increases Snail expression
level via the PI3K/Akt/NF-κB signaling pathway, which is associated
with glioblastoma cells migration and invasion (16). In addition, Siebzehnrubl et
al (17) indicated that
ZEB1 is linked to tumor chemoresistance and invasion of
glioblastoma cells by modulating its downstream effectors,
including c-MYB, MGMT and ROBO1. Nevertheless, the
exact molecular mechanism and gene networks underlying GBM
progression remain to be fully elucidated.
The present study aimed to identify the potential
key nodes and molecular mechanisms associated with the progression
of GBM. Co-expression interactions between the identified DEGs were
conducted using a protein-protein interaction (PPI) network and
several critical genes were identified. In addition, a network
module analysis was performed according to the PPI network. In
conclusion, the present study may improve the current understanding
of the pathogenesis underlying GBM and identified key genes that
may represent novel targets for the development of novel treatments
of GBM.
Materials and methods
Data download
RNA-seq data were downloaded from The Cancer Genome
Atlas (TCGA) database (portal.gdc.cancer.gov/) (18). The data of 169 GBM samples and 5
normal brain tissue samples were used and analyzed.
Data preprocessing and DEG
analysis
Based on the annotation information contained in the
Ensembl database (asia.ensembl.org/html) (19), 23,269 protein coding genes were
identified. Then, the DEGs between GBM samples and normal samples
were screened using edgeR package in R (20,21).
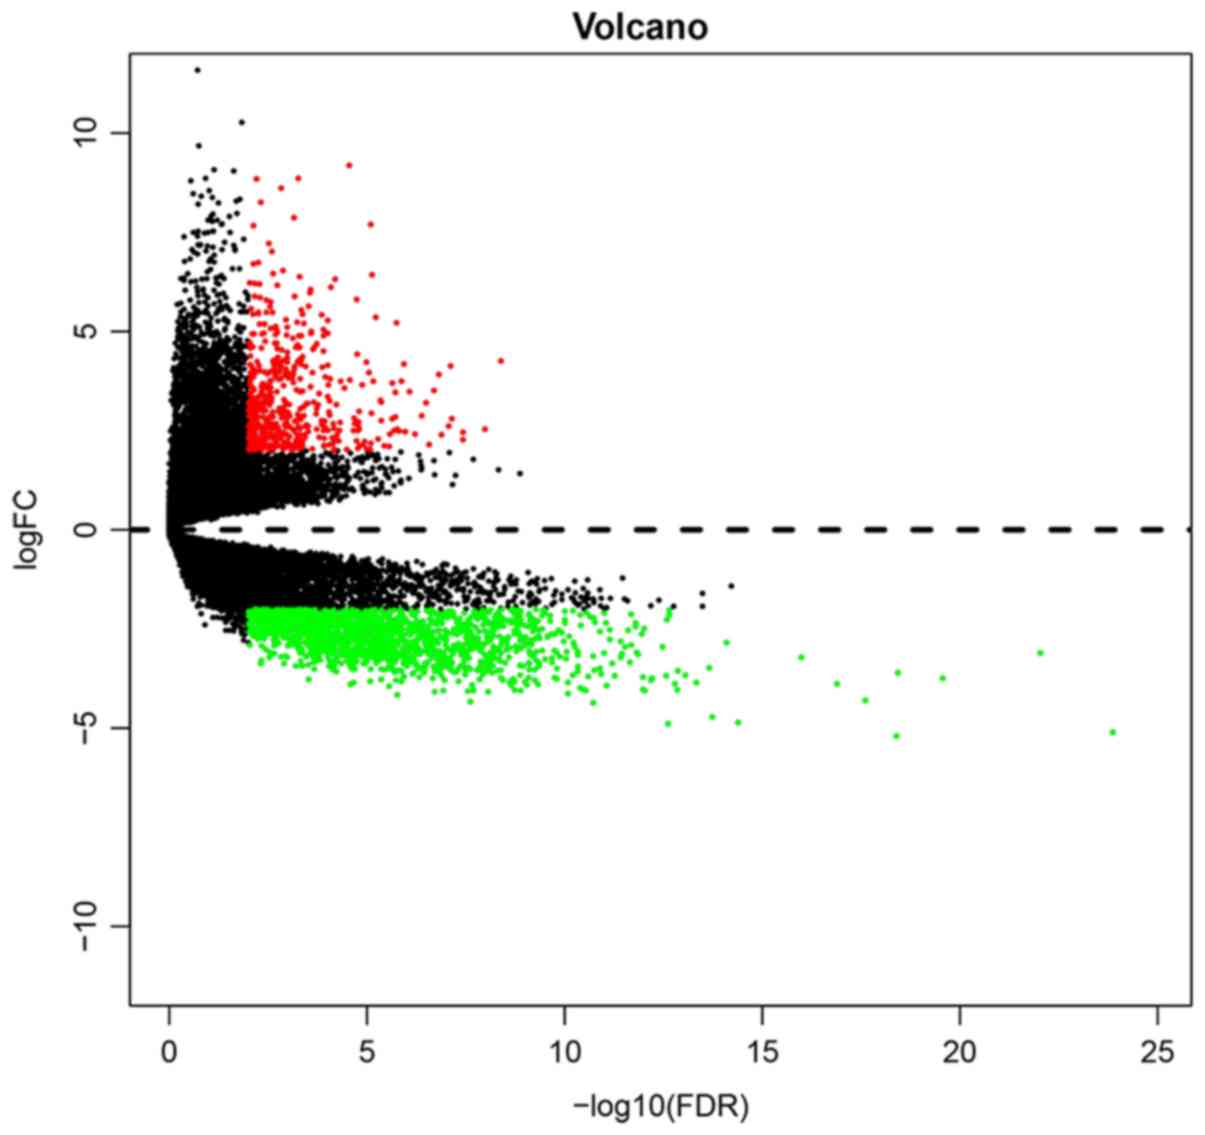
A P<0.01 and |log2 (fc)| >4 were selected as the cutoff
criteria for the identification of DEGs. In addition, a volcano
plot was drawn using the gplots package in R software (22).
Functional and pathway enrichment
analysis of DEGs
To reveal the main functional pathways of GBM, the
Database for Annotation, Visualization and Integrated Discovery
(DAVID; http://david.ncifcrf.gov/) was used
to analyze Gene Ontology (GO) terms and Kyoto Encyclopedia of Genes
and Genomes (KEGG) pathways enriched in the identified DEGs
(23). DEG count ≥2 and P<0.05
were used as cutoff to identify the significant biological
functions and signaling pathways.
PPI network and module analysis of
DEGs
The Search Tool for the Retrieval of Interacting
Genes/Proteins (STRING) database (https://string-db.org/) was used to assess the
interacting partners of the DEGs (24), and the PPI network was constructed
with a combined score >0.7. Visualization of the network was
performed with Cytoscape (version 3.6.1) software (25). After constructing the PPI network,
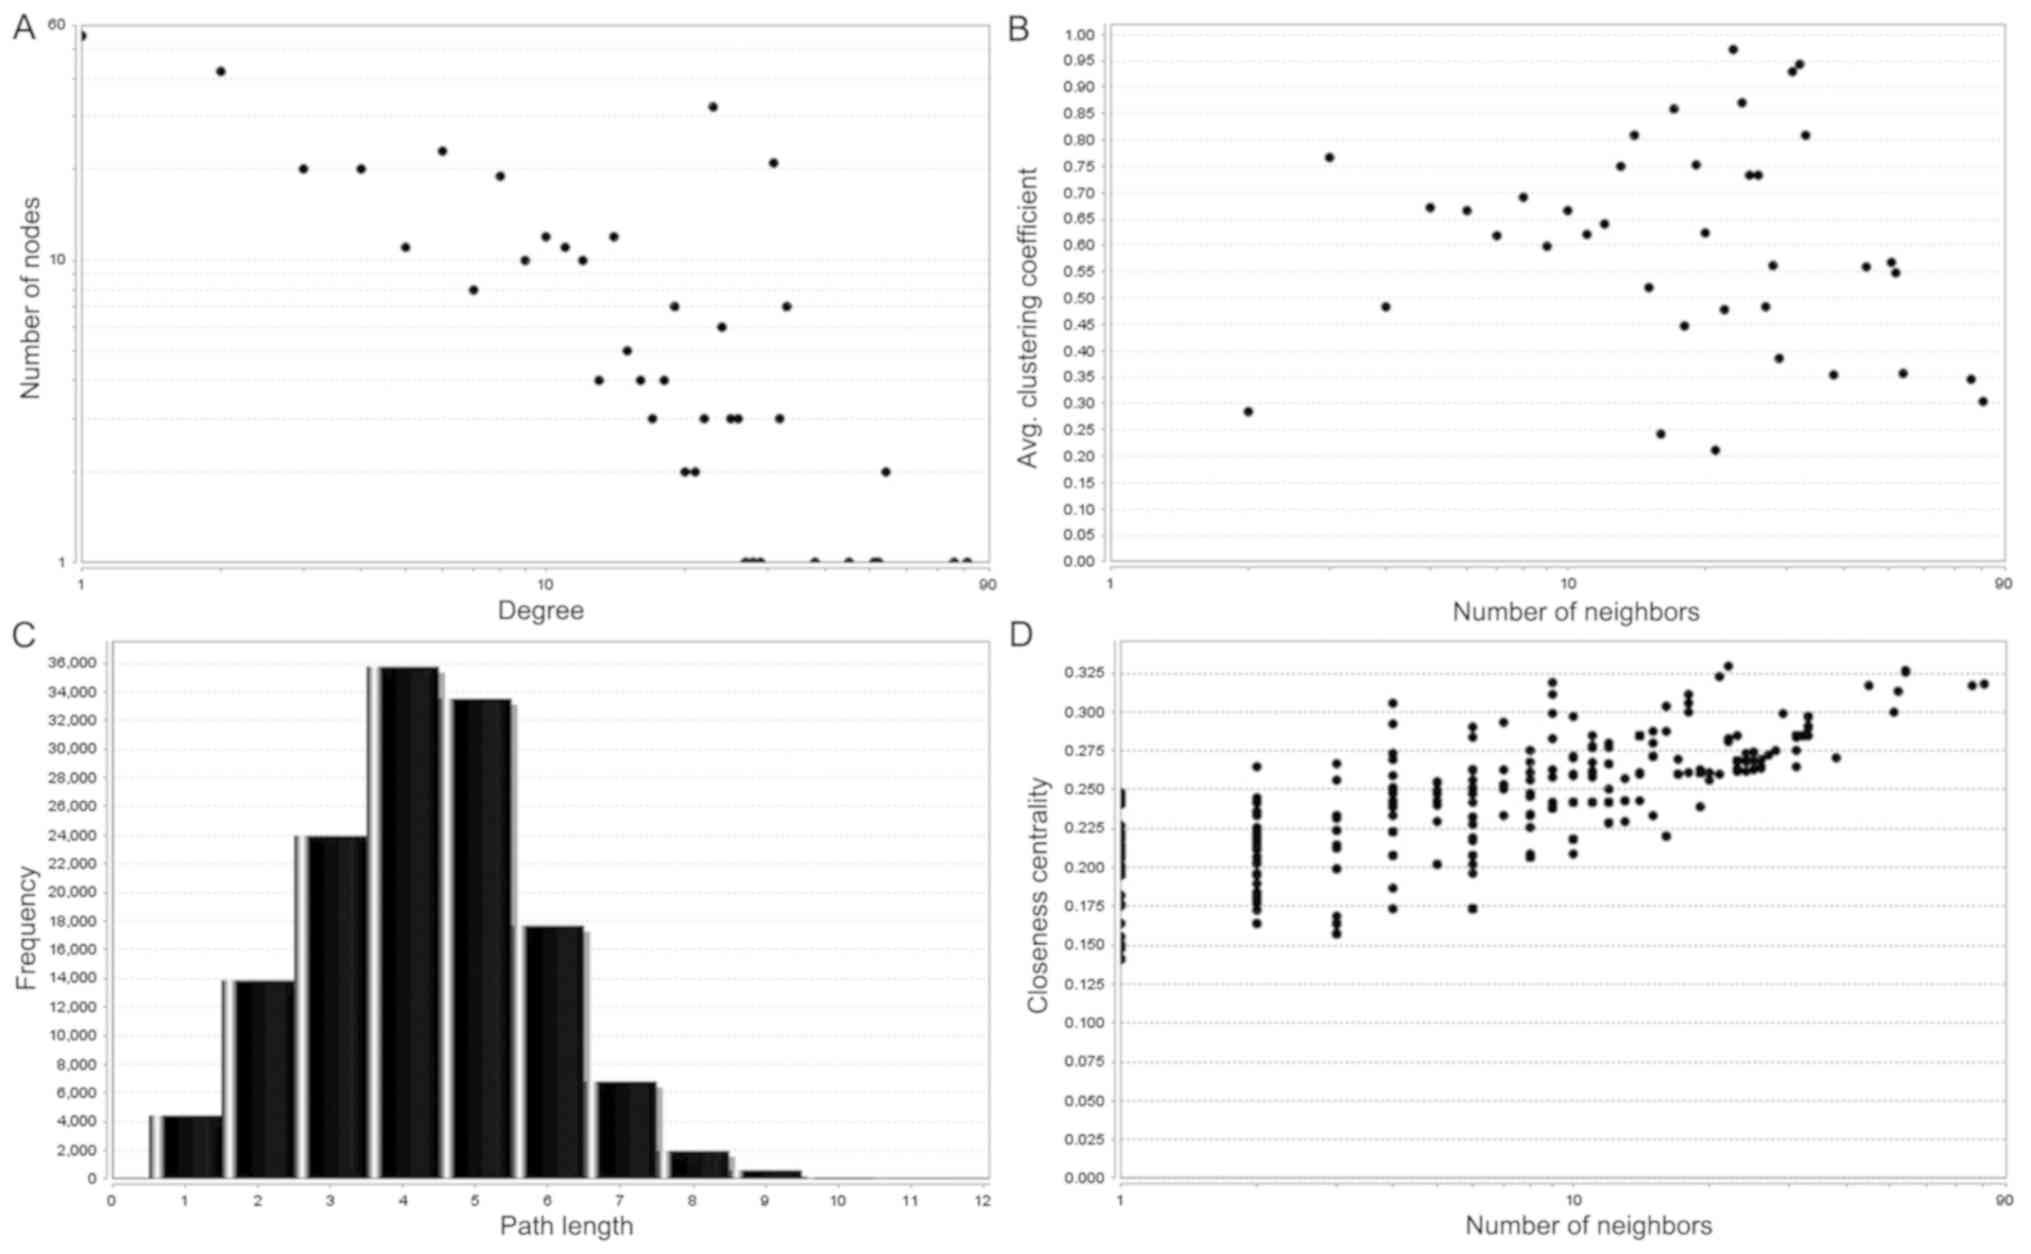
topology characteristics of the network were analyzed using the
Network Analyzer plug-in of Cytoscape software, and degree
distribution, distribution of the shortest path, average clustering
coefficient and closeness centrality were examined (26). Subsequently, the top 10 significant
hub genes or key nodes were identified according to their
connectivity degrees by using the CytoHubba tool, a plug-in for
Cytoscape (27). The MCODE plug-in
was used to analyze the highly interconnected clusters of this
network with default parameters (28).
UALCAN survival analysis
UALCAN (ualcan.path.uab.edu/) is an interactive web-software
that can be used to perform analyses of tumor subgroup gene
expression and survival (29). In
UALCAN, samples were categorized into two groups: High expression
and Low/Medium expression patients. High expression patients refer
to the highest quarter of all patients. Low and medium expression
patients refer to the remaining three quarters of patients. The
P-values from the Kaplan-Meier analysis were based on log-rank. The
effects of candidate key gene expression levels on overall survival
(OS) were analyzed using UALCAN.
Sample collection and ethics
statement
To determine the expression of hub genes in GBM
tissues, samples from 20 patients (age, 26–77 years), including
nine males and eleven females, who underwent tumor resection
surgery were collected at the Shanghai Ninth People's Hospital
between September 2010 and March 2018. All patients provided
written informed consent, and the study conducted in accordance
with the Declaration of Helsinki. In addition, 20 normal brain
tissues (used as the control group) were collected from patients
who suffered from traumatic brain injury and required internal
decompression surgery. After collection, all tissues were frozen in
liquid nitrogen and stored at −80°C. All participants in the
present study signed informed consents and the study was approved
by the Ethics Review Committee of Shanghai Ninth People's
Hospital.
RNA extraction and reverse
transcription-quantitative (RT-q) PCR
TRIzol (cat. no. 9109; Takara Bio, Inc.) was used to
isolate total RNA from each tissue sample according to the
manufacturer's instructions. Briefly, 2 ml TRIzol was added to
brain tissue (100 mg) to prepare homogenate. After obtaining RNA,
TE buffer was used to dilute the RNA. Nanodrop software (ND2000C;
Gene Company, Ltd.) was used to determine the OD value. A value of
OD260/OD280 within 1.7–2.1 indicated that the
extracted RNA was relatively pure. Then, total RNA was reverse
transcribed into cDNAs using the PrimeScript RT Master Mix (cat.
no. RR036A; Takara Bio, Inc.). RT-qPCR was performed to measure the
levels of cDNAs using a SYBR GREEN kit (cat. no. RR420 A; Takara
Bio, Inc.). qPCR amplification procedure was performed as follows:
Pre-denaturation at 95°C for 30 sec for 1 cycle followed by 40
cycles of 95°C for 5 sec and 60°C for 20 sec. The relative
expression level of the five key genes was calculated following
comparative CT method, as previously described (30). GAPDH was used to normalize the mRNA
expression level. The primer sequences are presented in Table I.
 | Table I.Primer sequences for PCR. |
Table I.
Primer sequences for PCR.
| cDNA | Forward primer
(5′-3′) | Reverse primer
(5′-3′) |
|---|
| CDK1 |
CACAAAACTACAGGTCAAGTGG |
GAGAAATTTCCCGAATTGCAGT |
| BUB1 |
GAAAGCATGAGCAATGGGTAAA |
CCACCTGATGCAACTTCTTATG |
| BUB1B |
ATGGGTCCTTCTGGAAACTTAG |
GGAATGTAGTGTCAAAAACCCC |
| CENPA |
AAGAGCACACACCTCTTGATAA |
CATGTAAGGTGAGGAGATAGGC |
| GNG3 |
CGGTGAACAGCACTATGAGTAT |
TCACAGTAAGTCATCAGGTCTG |
| GAPDH |
GTGGACCTGACCTGCCGTCTAG |
GAGTGGGTGTCGCTGTTGAAGTC |
Statistical analysis
Experimental data are presented as the mean ±
standard error of the mean. All statistical analyses were performed
using SPSS 20.0 (IBM, Corp.) and visualized using GraphPad Prism
6.0 (GraphPad Software Inc.). Differences in expression levels
between groups were analyzed by unpaired Student's t-test.
P<0.05 was considered to indicate a statistically significant
difference.
Results
Identification of DEGs
Using P<0.01 as a cutoff, a total of 1,483 DEGs
(954 upregulated genes and 529 downregulated) were identified
between GBM and control samples (Table S1). The volcano plot of DEGs is
presented in Fig. 1. Each
individual dot represents a DEG.
Functional and pathway enrichment
analysis of the DEGs
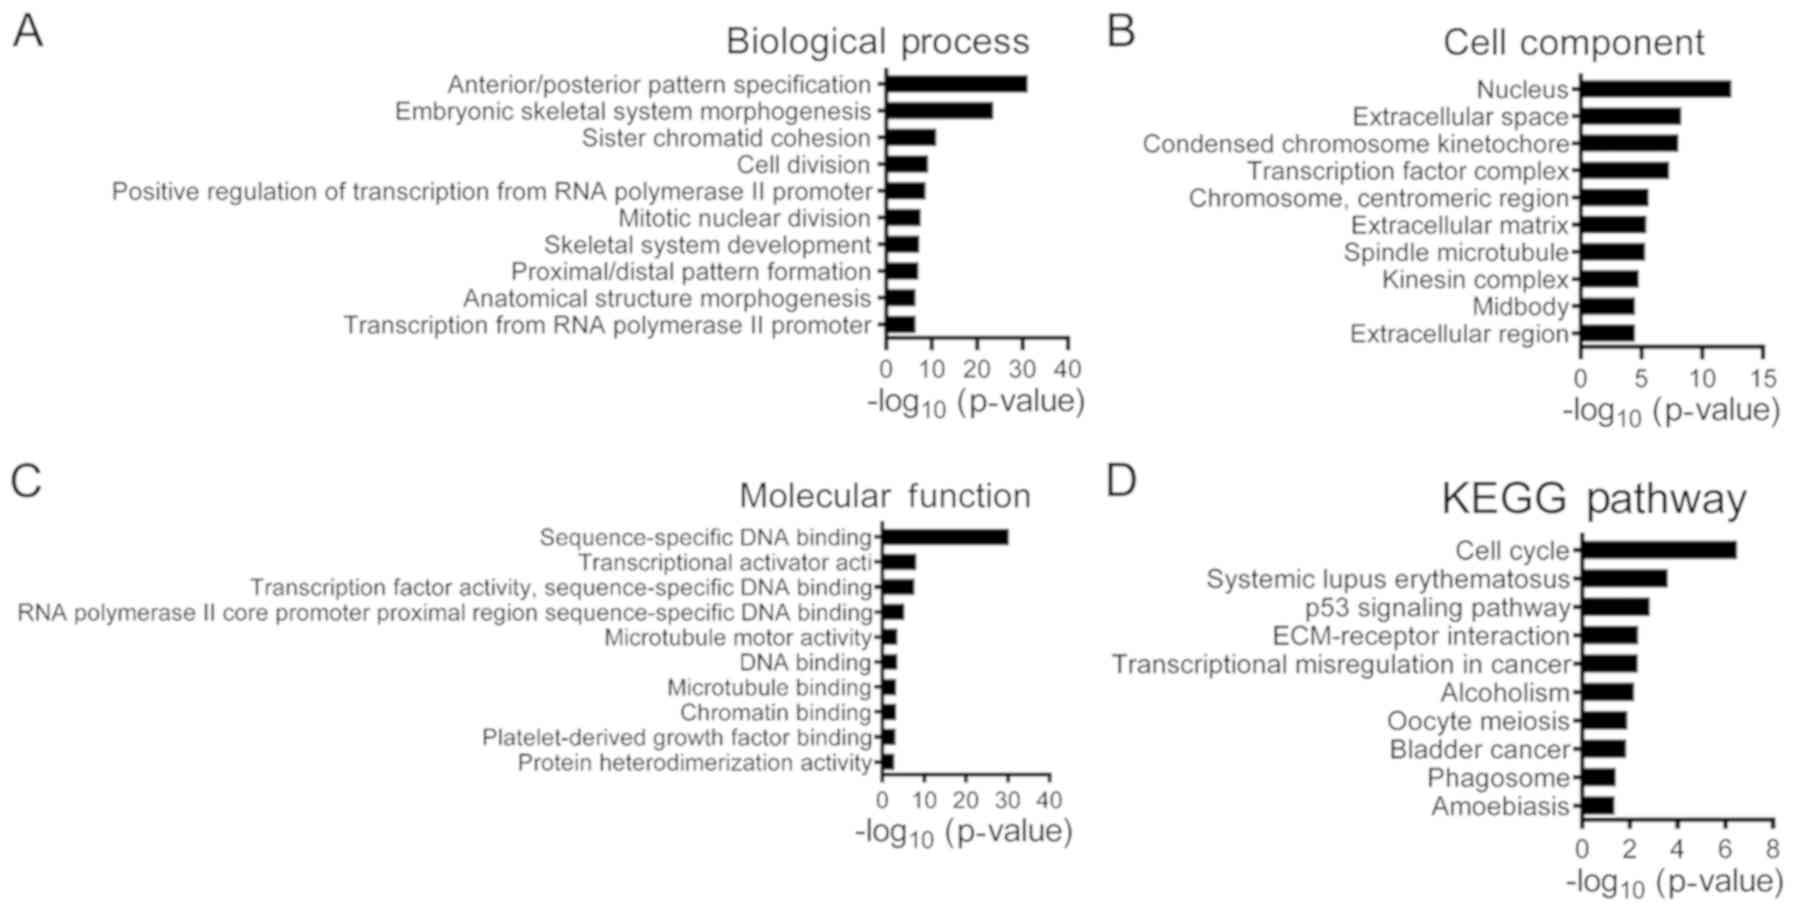
The GO enrichment analysis results revealed that 954
upregulated DEGs were primarily involved in biological process that
included ‘anterior/posterior pattern specification’, ‘embryonic
skeletal system morphogenesis’, ‘sister chromatid cohesion’ and
‘cell division’ (Fig. 2).
According to the ‘cellular components’ analysis, DEGs were found to
be primarily localized in the nucleus. In addition, the most
significantly enriched molecular functions were related to
transcriptional activator activity. In addition, as presented in
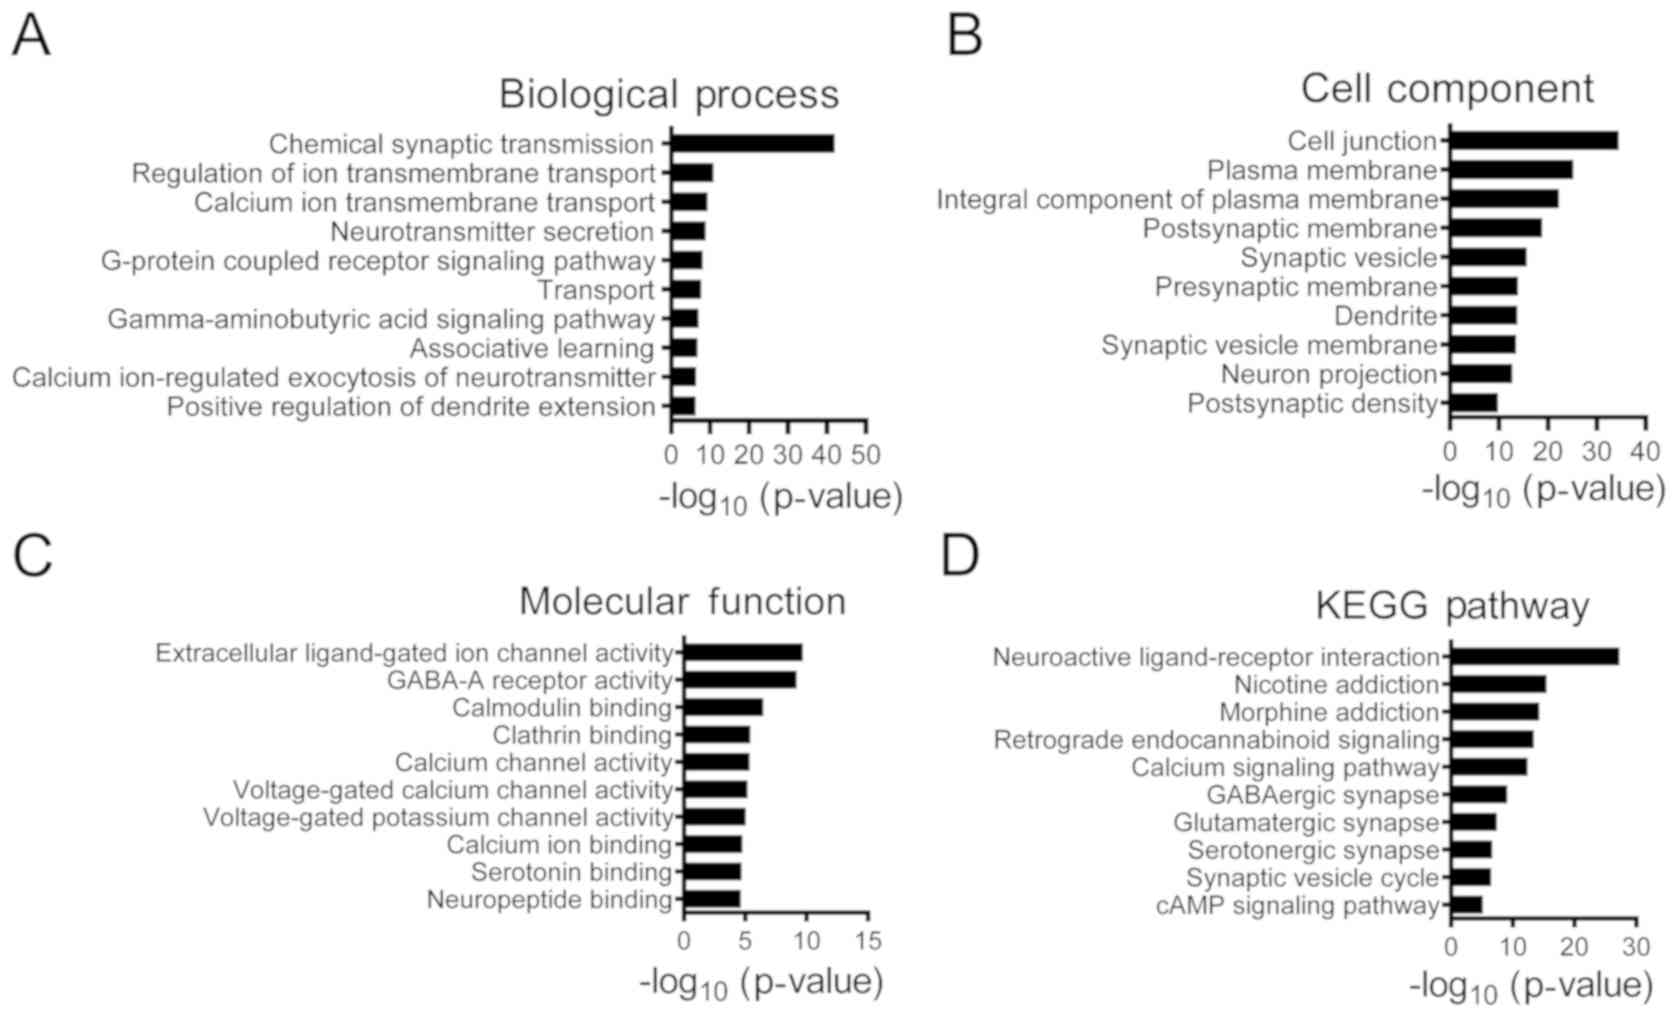
Fig. 3, 529 downregulated DEGs
were significantly associated with ‘chemical synaptic
transmission’, ‘regulation of ion transmembrane transport’ and
‘γ-aminobutyric acid signaling pathway’. The top five main
biological processes enriched in the upregulated and downregulated
DEGs are presented in Tables II
and III, respectively. The
associated signaling pathways significantly enriched in the
identified DEGs are presented in Table IV. The KEGG pathway analysis
indicated that upregulated DEGs were mostly involved in pathways
such as ‘cell cycle’ and ‘p53 signaling’ pathways, whereas
downregulated genes were associated with ‘retrograde
endocannabinoid signaling’, ‘GABAergic synapse’ and ‘glutamatergic
synapse’.
| Table II.GO analysis of upregulated genes
associated with glioblastoma multiforme. |
Table II.
GO analysis of upregulated genes
associated with glioblastoma multiforme.
| Category | Term | Count | P-value |
|---|
|
GOTERM_BP_DIRECT | GO:0007062~sister
chromatid cohesion | 17 | 8.70E-12 |
|
GOTERM_BP_DIRECT | GO:0051301~cell
division | 26 | 5.28E-10 |
|
GOTERM_BP_DIRECT | GO:0007067~mitotic
nuclear division | 20 | 2.20E-08 |
|
GOTERM_BP_DIRECT | GO:0007051~spindle
organization | 3 | 0.026829 |
|
GOTERM_BP_DIRECT |
GO:0007094~mitoticspindle assembly
checkpoint | 3 | 0.04073 |
|
GOTERM_CC_DIRECT |
GO:0005634~nucleus | 142 | 3.58E-13 |
|
GOTERM_CC_DIRECT |
GO:0005615~extracellular space | 51 | 5.11E-09 |
|
GOTERM_CC_DIRECT |
GO:0000777~condensed chromosome
kinetochore | 13 | 9.06E-09 |
|
GOTERM_MF_DIRECT |
GO:0043565~sequence-specific DNA
binding | 57 | 5.42E-31 |
|
GOTERM_MF_DIRECT | GO:0003677~DNA
binding | 46 | 2.76E-04 |
|
GOTERM_MF_DIRECT |
GO:0003682~chromatin binding | 17 | 2.76E-04 |
| Table III.GO analysis of downregulated genes
associated with glioblastoma multiforme. |
Table III.
GO analysis of downregulated genes
associated with glioblastoma multiforme.
| Category | Term | Count | P-value |
|---|
|
GOTERM_BP_DIRECT | GO:0007268~chemical
synaptic transmission | 54 | 1.09E-42 |
|
GOTERM_BP_DIRECT |
GO:0034765~regulation of ion transmembrane
transport | 18 | 1.37E-11 |
|
GOTERM_BP_DIRECT |
GO:0007269~neurotransmitter secretion | 12 | 1.33E-09 |
|
GOTERM_BP_DIRECT |
GO:0007187~G-protein coupled receptor
signaling pathway, coupled to cyclic nucleotide second
messenger | 11 | 7.02E-09 |
|
GOTERM_BP_DIRECT |
GO:0007214~gamma-aminobutyric acid
signaling pathway | 8 | 7.68E-08 |
|
GOTERM_CC_DIRECT | GO:0005886~plasma
membrane | 162 | 7.00E-26 |
|
GOTERM_CC_DIRECT | GO:0005887~integral
component of plasma membrane | 85 | 4.55E-23 |
|
GOTERM_CC_DIRECT |
GO:0045211~postsynaptic membrane | 32 | 1.74E-19 |
|
GOTERM_MF_DIRECT |
GO:0005230~extracellular ligand-gated ion
channel activity | 11 | 1.99E-10 |
|
GOTERM_MF_DIRECT | GO:0004890~GABA-A
receptor activity | 9 | 6.42E-10 |
|
GOTERM_MF_DIRECT |
GO:0005516~calmodulin binding | 17 | 3.29E-07 |
| Table IV.Results of KEGG pathway analysis. |
Table IV.
Results of KEGG pathway analysis.
| A, Upregulated
genes |
|---|
|
|---|
| Term | Count | P-value |
|---|
| hsa04110: Cell
cycle | 12 | 3.26E-07 |
| hsa05322: Systemic
lupus erythematosus | 9 | 2.49E-04 |
| hsa04115: p53
signaling pathway | 6 | 0.001428 |
| hsa04512:
ECM-receptor interaction | 6 | 0.004496 |
| hsa05202:
Transcriptional misregulation in cancer | 8 | 0.004710 |
|
| B, Downregulated
genes |
|
| Term | Count | P-value |
|
| hsa04080:
Neuroactive ligand-receptor interaction | 44 | 5.35E-28 |
| hsa04723:
Retrograde endocannabinoid signaling | 20 | 4.27E-14 |
| hsa04020: Calcium
signaling pathway | 24 | 3.72E-13 |
| hsa04727: GABAergic
synapse | 15 | 7.40E-10 |
| hsa04724:
Glutamatergic synapse | 15 | 3.76E-08 |
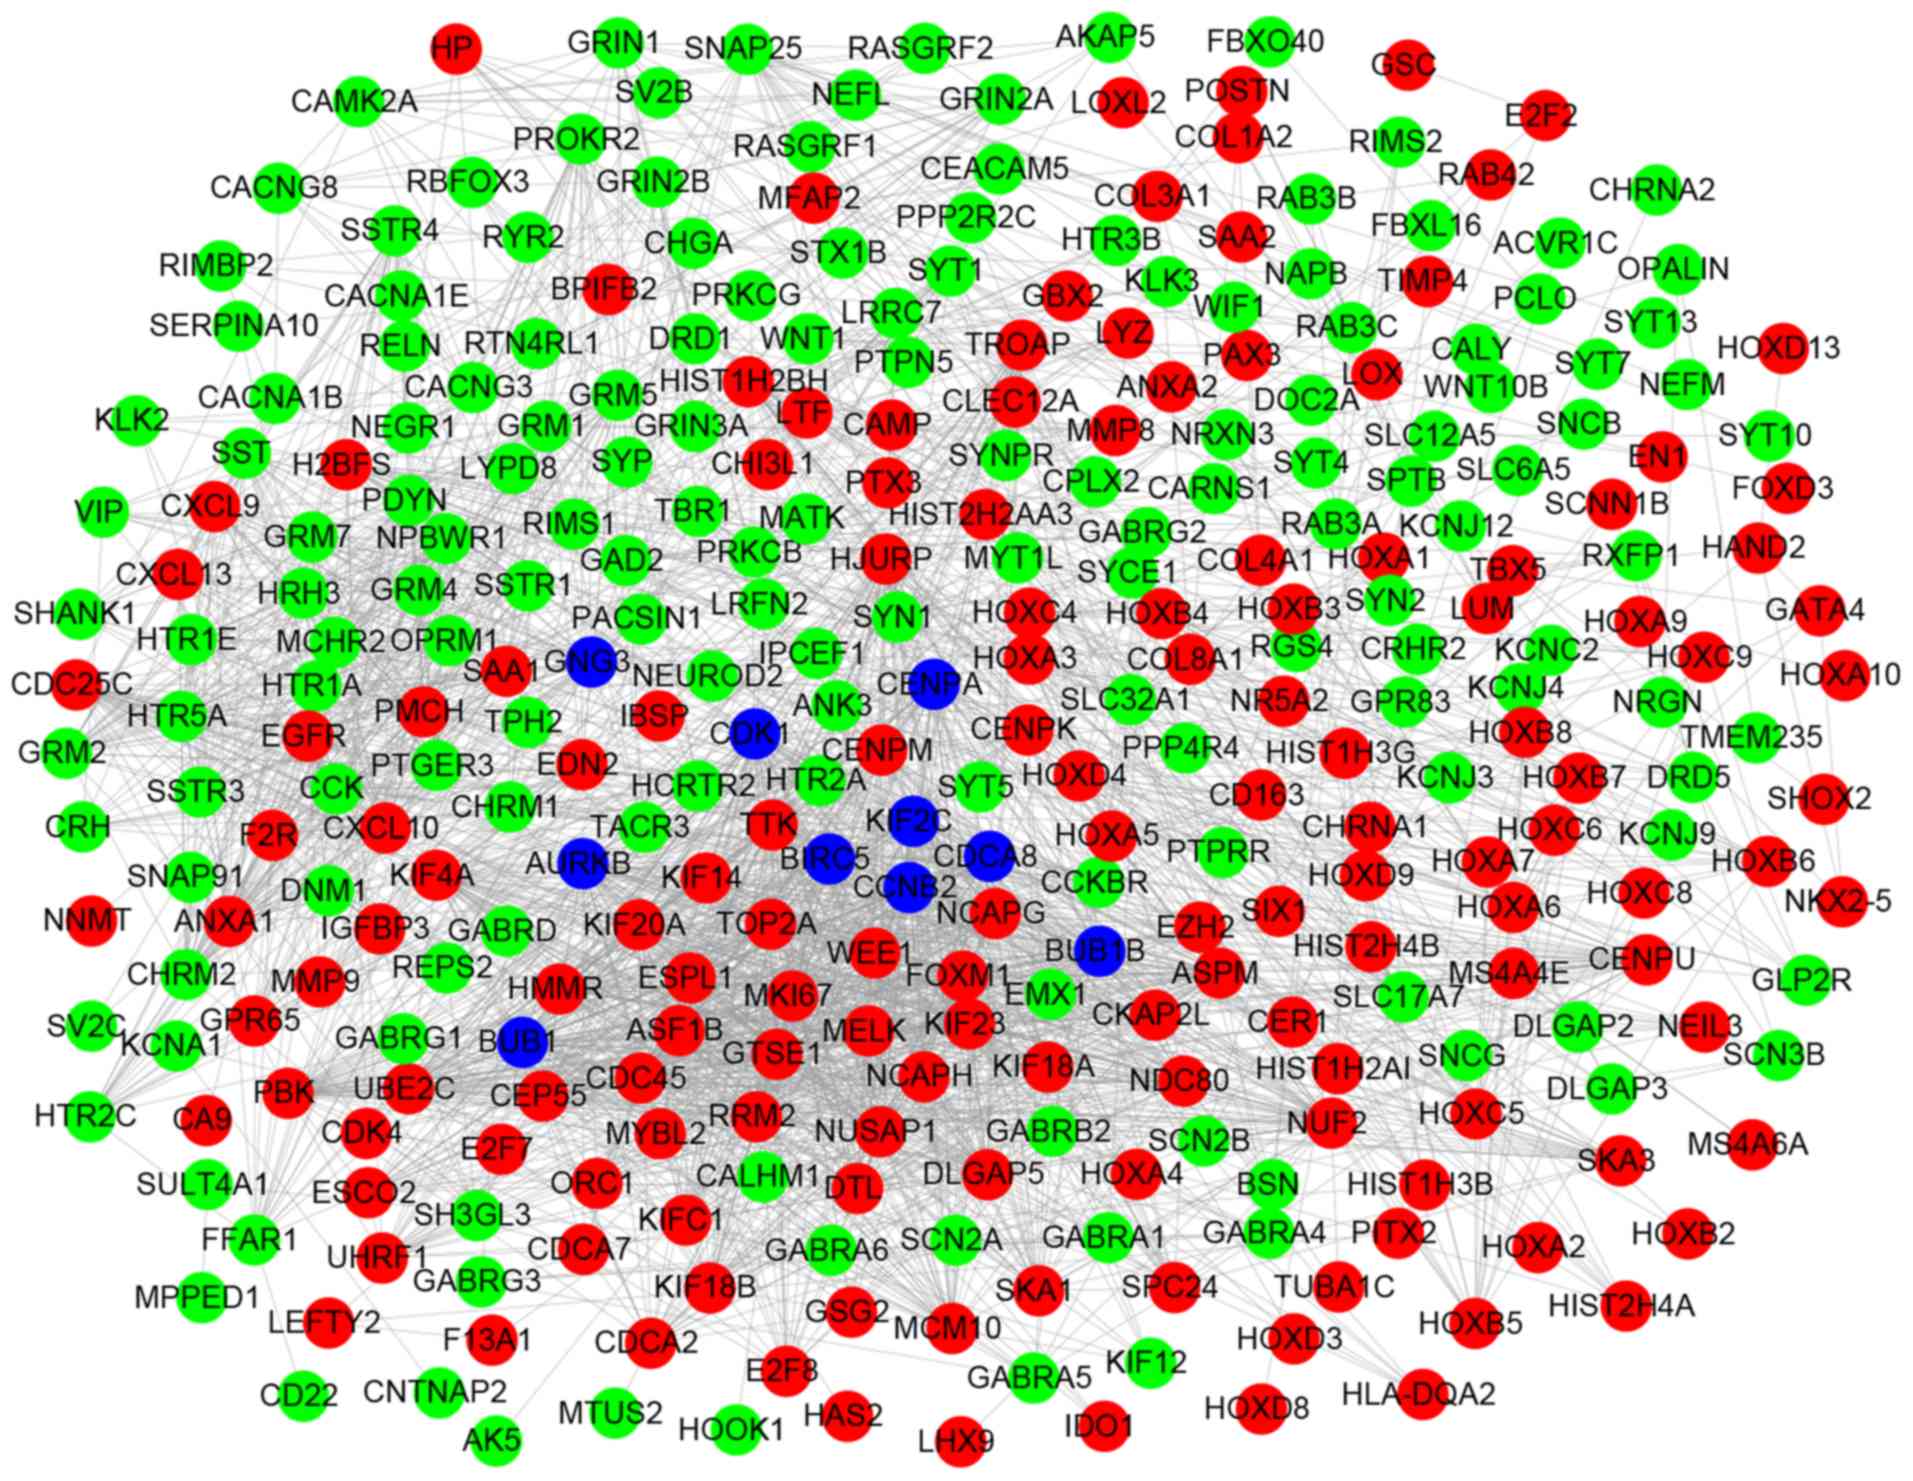
PPI network construction of DEGs
Based on the STRING database and Cytoscape software,
PPI networks were constructed with combined scores >0.7,
including 645 nodes and 1,779 edges (Fig. 4). Subsequently, the node degree
distribution of this network was analyzed using a pattern of
power-law according to the topology property (Fig. 5). In this network, a degree value
>40 was used as the cutoff criterion for the CytoHubba tool.
Finally, 10 DEGs were identified as the hub genes with the highest
connectivity degree: cyclin dependent kinase 1 (CDK1),
centromere protein A (CENPA), G protein subunit γ 3
(GNG3), BUB1 mitotic checkpoint serine/threonine kinase
(BUB1), cyclin B2 (CCNB2), kinesin family member 2C
(KIF2C), aurora kinase B (AURKB), baculoviral IAP
repeat containing 5 (BIRC5), cell division cycle associated
8 (CDCA8) and BUB1 mitotic checkpoint serine/threonine
kinase B (BUB1B).
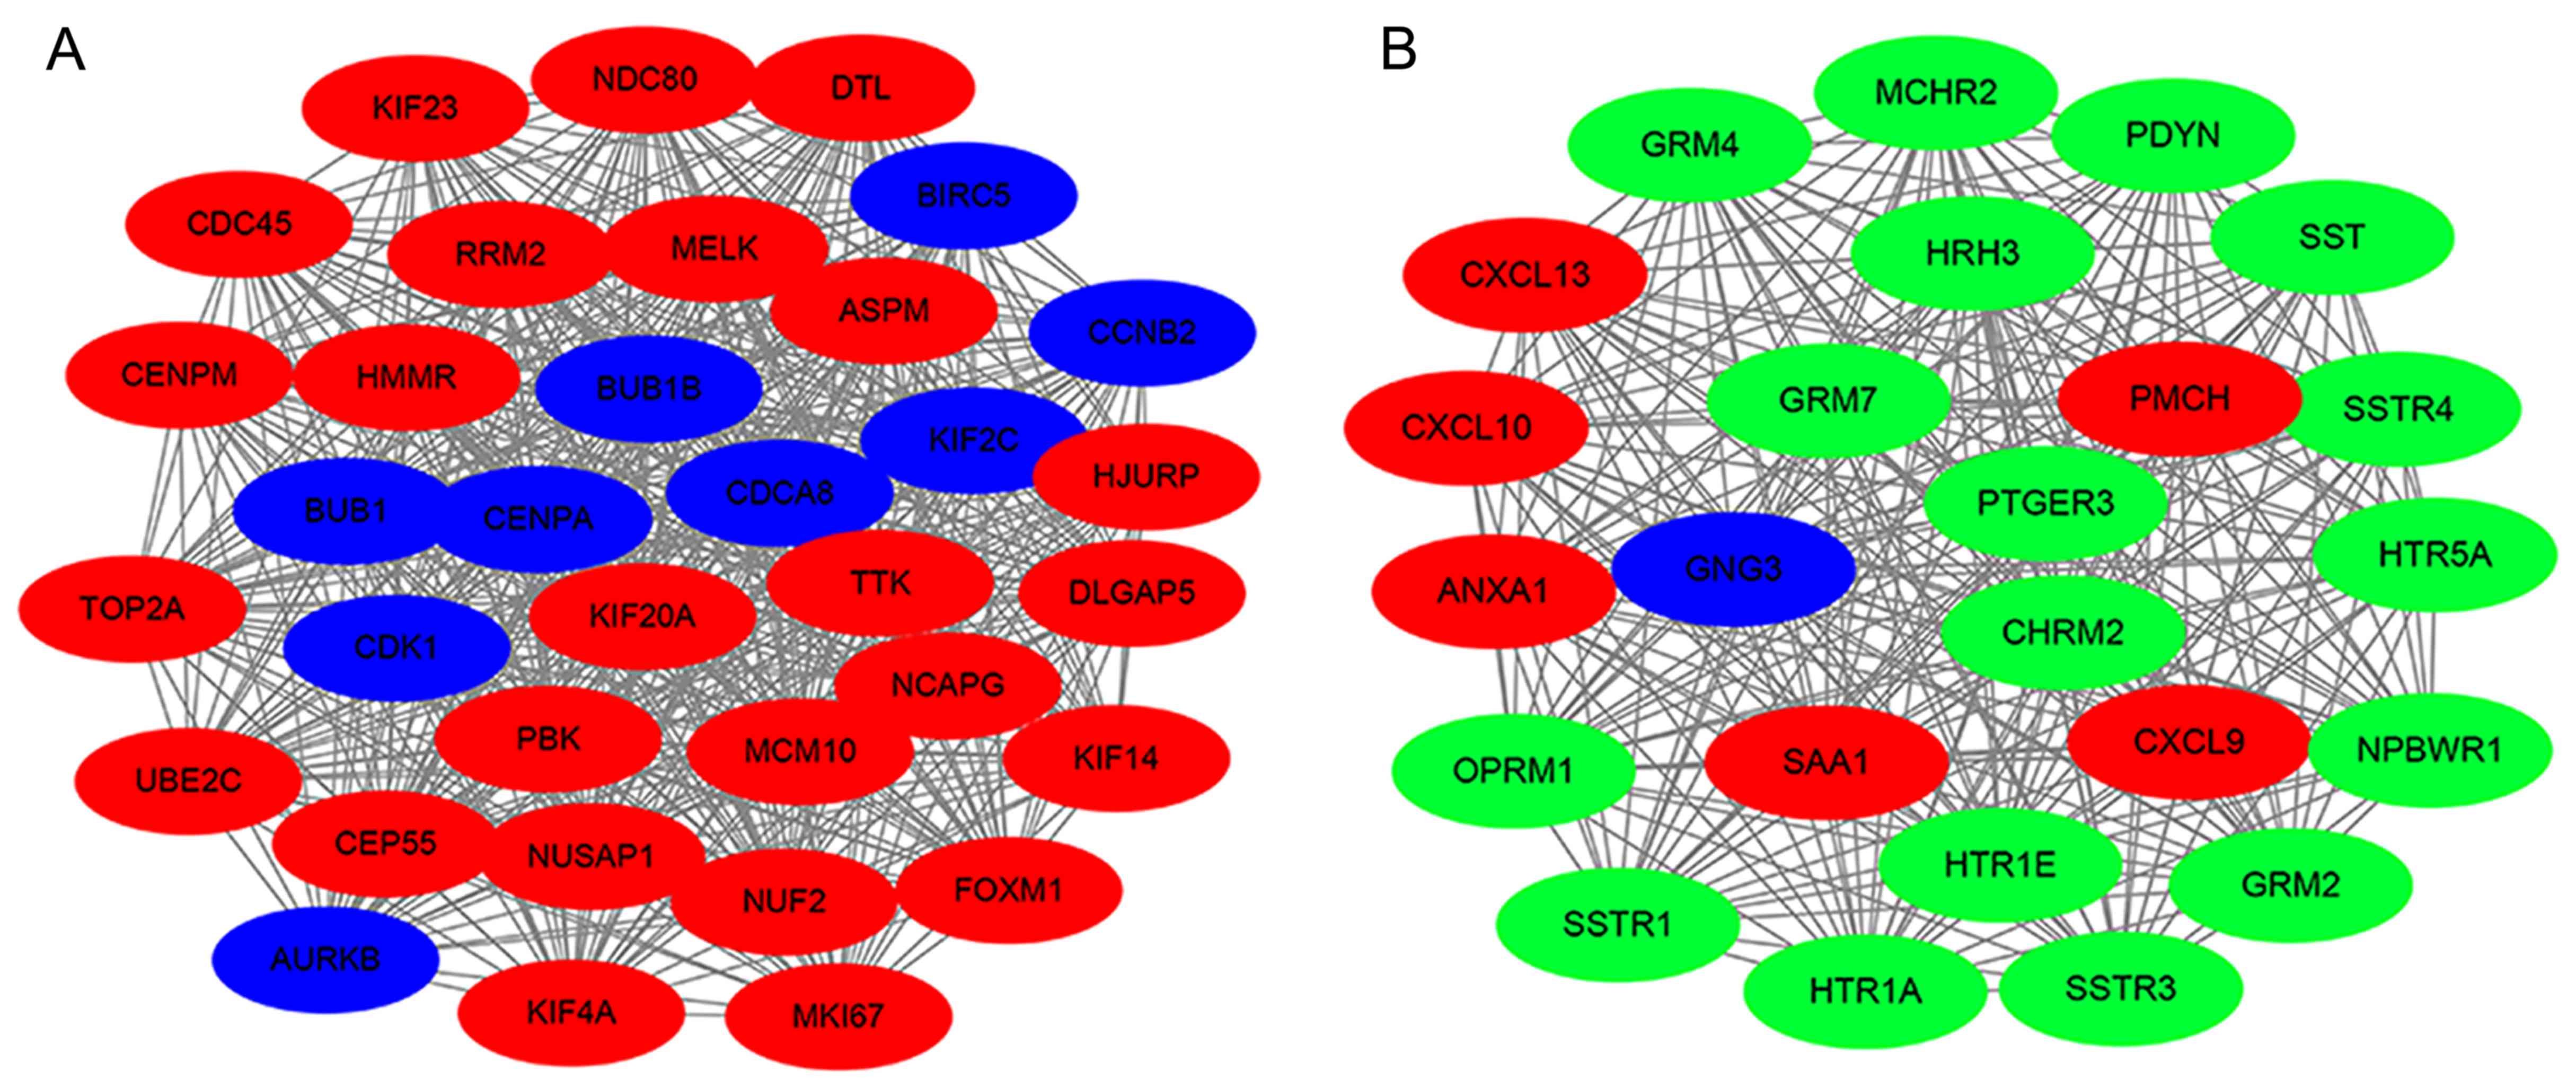
Module analysis of the PPI
network
Generally, biological networks contain several
functional modules and they may interact in various biological
process (31). In the present
study, the top two clusters were identified from the PPI network
using MCODE analysis. The most significant cluster involved 35
nodes and 572 edges, and CDK1, BUB1, BUB1B, CENPA were
highly enriched (Fig. 6A). Cluster
2 is presented in Fig. 6B,
consisting of 24 nodes and 276 edges. Specifically, the hub gene
GNG3 was enriched in cluster 2, which indicated that it may
be involved in the pathogenesis of GBM by cooperating with other
genes.
UALCAN survival analysis
UALCAN was used to analyze the OS of 169 patients
with GBM based on TCGA data. Briefly, survival analysis indicated
that the higher expression of CENPA gene was significantly
correlated with shorter OS time in GBM patients, whereas the
expression of CDK1, BUB1, BUB1B and GNG3 was not
correlated with OS (Fig. 7).
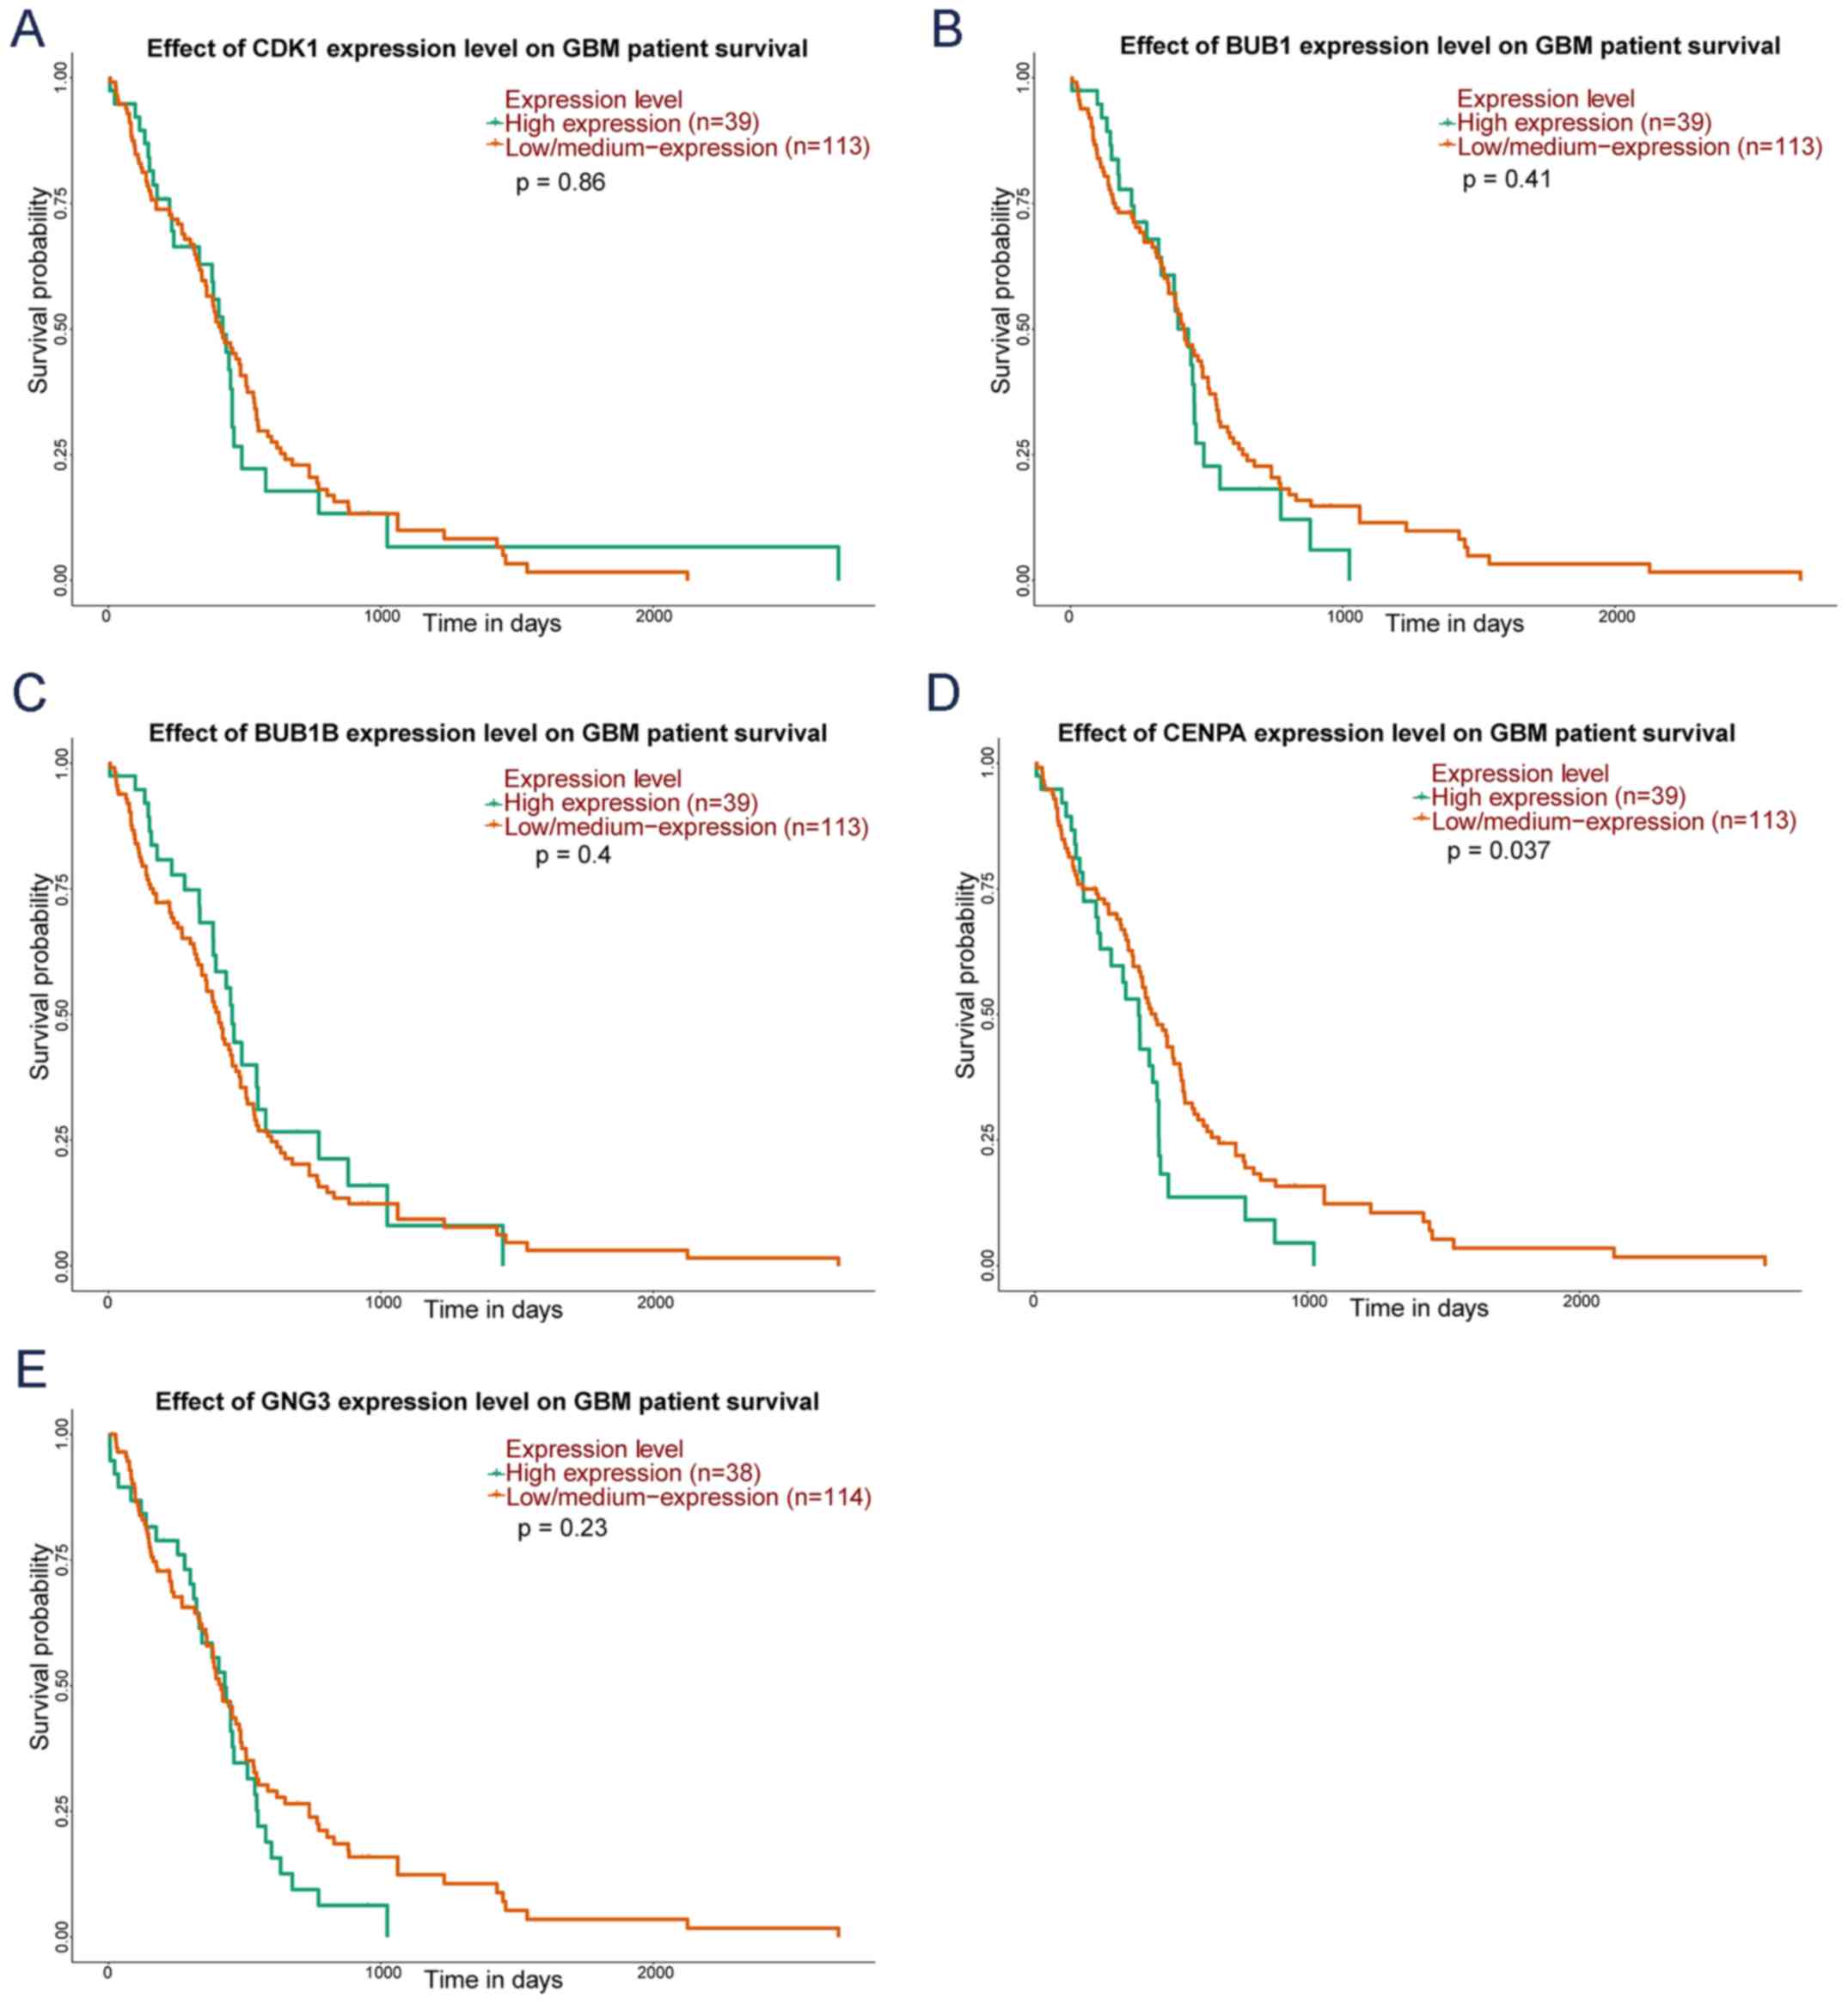 | Figure 7.Kaplan-Meier curve of five key genes
in patients with GBM. The red lines represent patients with low
gene expression, and green lines represent patients with high gene
expression. (A) CDK1, (B) BUB1, (C) BUB1B, (D)
CENPA and (E) GNG3. GBM, glioblastoma multiforme.
CDK1, cyclin dependent kinase 1; BUB1, BUB1 mitotic
checkpoint serine/threonine kinase; BUB1B, BUB1 mitotic
checkpoint serine/threonine kinase B; CENPA, centromere
protein A; GNG3, G protein subunit γ 3. |
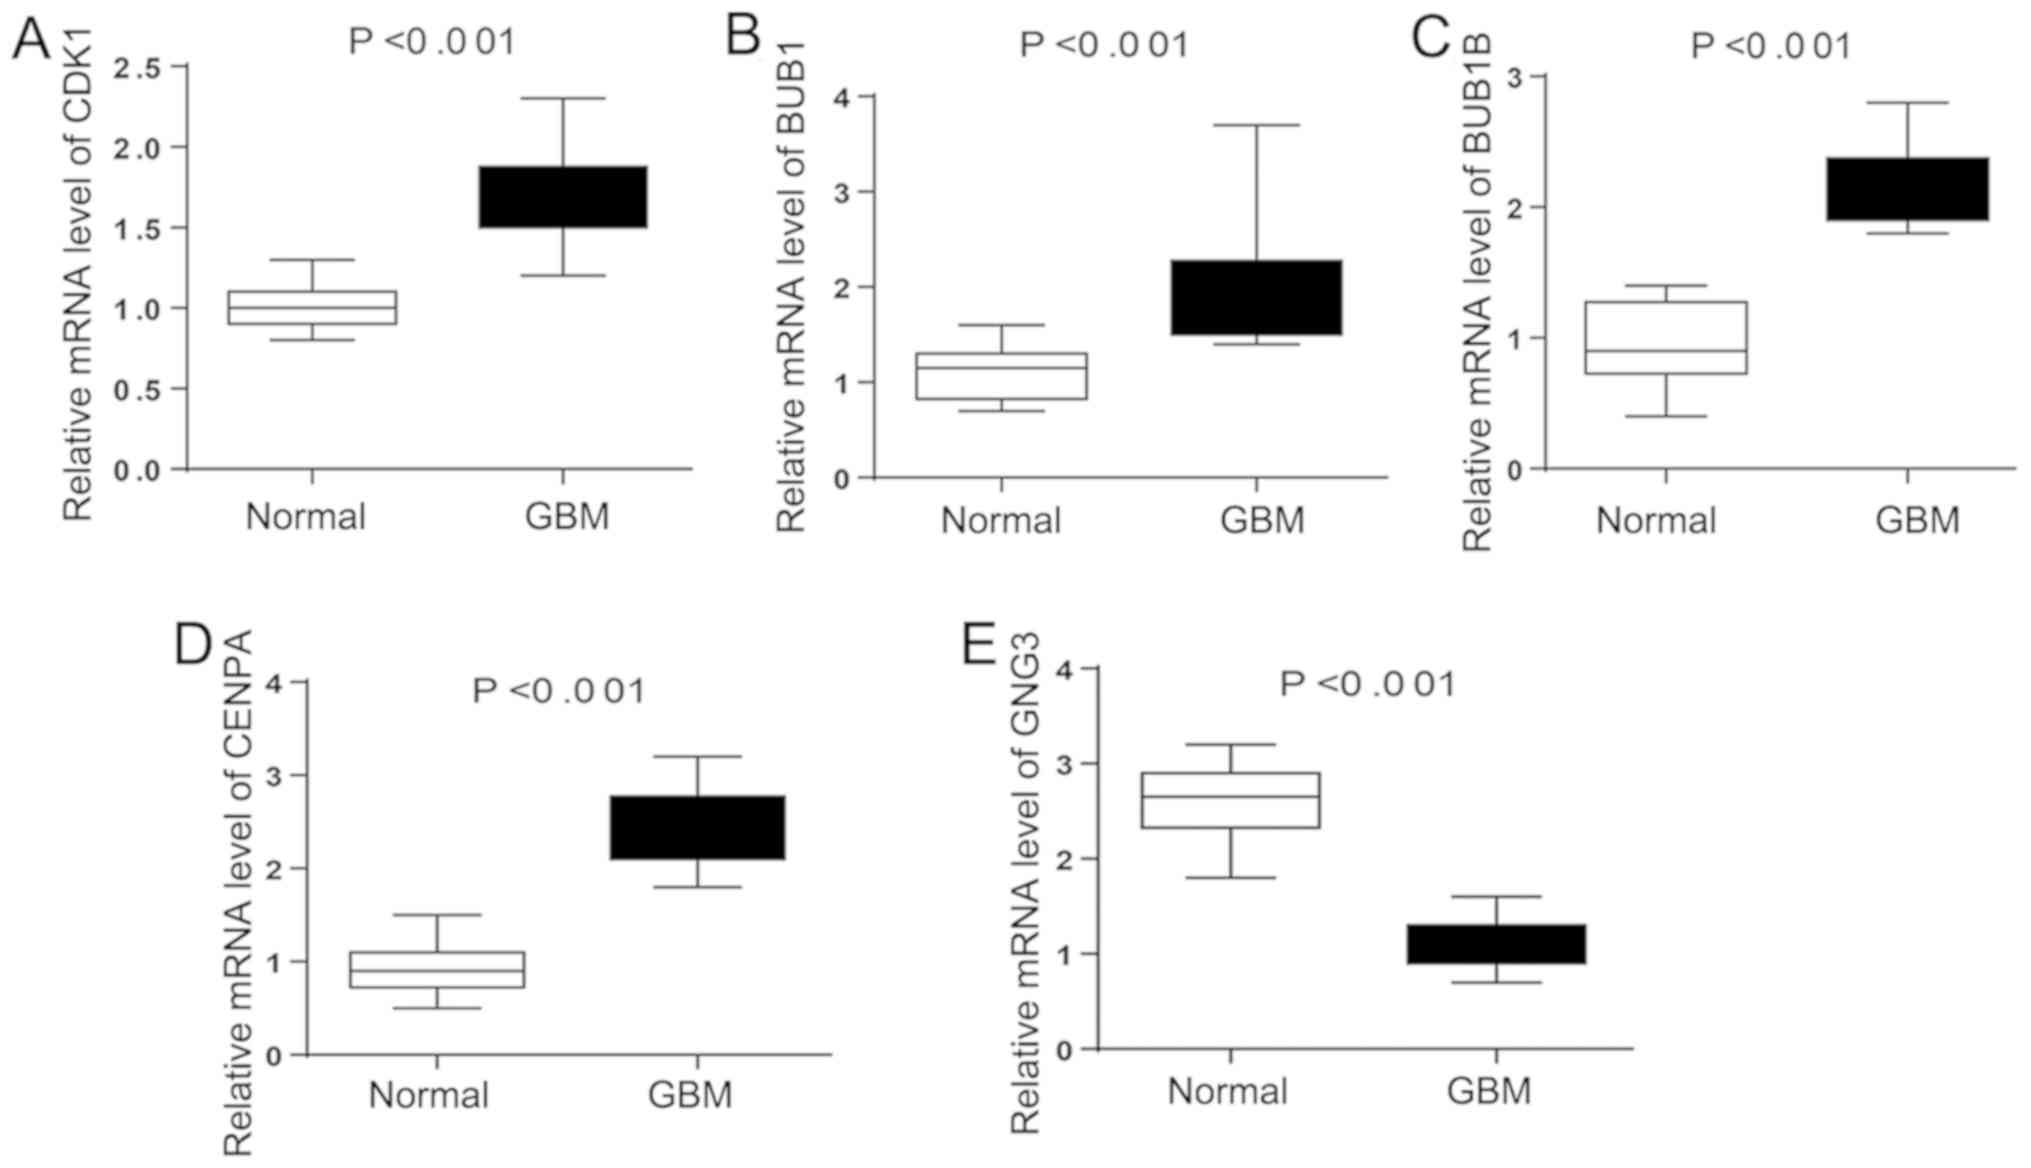
Expression of hub genes in GBM
To further verify the expression level of hub genes
in GBM samples, RT-qPCR was performed to calculate the mRNA levels
of the five hub genes identified in the present study (CDK1,
BUB1, BUB1B, CENPA and GNG3) in GBM samples. As
illustrated in Fig. 8, the
expression of CDK1, BUB1, BUB1B and CENPA were
significantly upregulated in GBM samples compared with normal
control tissues. By contrast, the expression level of GNG3
was higher in the control tissues compared with tumor tissues. The
present RT-qPCR results were in line with the aforementioned
bioinformatics analysis, suggesting that these key genes may be
linked to the molecular mechanism underlying GBM.
Discussion
Glioblastoma multiforme (GBM) is the most common
aggressive brain tumor, and is associated with a poor patient
survival rate (32). However, the
most important challenge in treating GBM is the presence of
significant intra-tumor heterogeneity (13,33,34).
Although previous studies have reported numerous potential
biomarkers associated with the progression of GBM, the potential
molecular mechanism underlying its pathogenesis has not been
comprehensively investigated (35–37).
In the present study, a total of 1,483 DEGs were identified,
containing 954 upregulated genes and 529 downregulated genes. The
present results suggested that these DEGs were primarily enriched
in cell division, mitotic nuclear division and chemical synaptic
transmission. In addition, the upregulated and downregulated genes
were related to cell cycle, p53 signaling pathway and synapse. A
PPI network was constructed and the highly connected module were
identified. After module analysis, several hub genes with higher
degree of connectivity were identified, including CDK1, BUB1,
BUB1B, CENPA and GNG3.
In the TCGA database, there were only 5 control
samples. Although it is of a smaller size when compared with the
169 GBM samples, it should not have great influence on the results
of the present study, as there was relatively little individual
difference in the control simples from different patients, whereas
the difference was much more evident in tumor samples due to
intratumoral heterogeneity between different patients.
CDK1, also named cell division control
protein 2, is an important cell cycle regulator functioning as a
serine/threonine kinase (38,39).
During G2 and early mitosis, active CDK1-cyclin complexes can
phosphorylate various downstream proteins, leading to
re-organization of the cytoskeleton, nuclear envelope breakdown and
chromosome condensation (40,41).
Previous studies have reported that downregulation of CDK1
could inhibit proliferative ability of human glioma cells, while
overexpression of CDK1 contributed to senescence escape of
the cells and promoted oncogenesis of human gliomas (42–44).
In the present study, CDK1 was also observed to be
significantly upregulated in the module analysis of the PPI network
constructed. The present results suggested that CDK1,
interacting with other genes identified in the present module
analysis, may be associated with the progression of GBM by
modulating the cell cycle.
In addition, CDK1, BUB1, BUB1B and
CENPA were also identified as key nodes in the current
study. BUB1 and BUB1B are spindle assembly checkpoint
(SAC) genes that serve as a controller of mitotic checkpoints and
chromosome segregation (32,45).
BUB1 mRNA was reported to be upregulated in glioma samples
and the expression level was positively correlated with glioma
grade (46). In addition,
BUB1B was identified to be enriched in glioblastoma cells
and associated with radio-resistance and recurrence of glioblastoma
(47,48). In accordance with these previous
studies, the present study identified that the expression levels of
both BUB1 and BUB1B in GBM samples were higher
compared with the negative controls. Collectively, accumulating
evidence suggested that BUB1 and BUB1B may exert a
significant influence on the progression of GBM by regulating
mitotic spindle assembly checkpoint and sister chromosome
segregation during mitosis. It has been previously reported that
SAC inhibition promoted the response of glioblastoma cells to
antimitotic drugs and enhanced the efficacy of tumor treating
fields, which impair mitosis by disturbing the spindle formation
(49,50). Therefore, inhibition of BUB1
or BUB1B may be a therapeutic strategy to treat GBM by
influencing SAC during the process of cell division. In addition,
CENPA, which encodes a centromere-associated protein, plays
an important role in cell division by directing the assembly of
active kinetochores (51). Failure
in this process could lead to dysfunction of chromosome
segregation, which has been found to be associated with initiation
and progression of cancer (52–54).
Notably, the present study identified a higher expression level of
CENPA in brain tissue samples from GBM patients and high
levels of CENPA were significantly associated with shorter
OS. In addition, GO enrichment analyses showed that CENPA
was involved in the biological function of sister chromatid
cohesion, nucleosome assembly and mitotic cytokinesis. The present
results suggested that CENPA gene may regulate the mitosis
of glioma cells by interacting with other genes in the cluster 1,
thus suggesting an association with pathogenesis and prognosis in
GBM. The present study identified a novel potential target molecule
in GBM, and inhibition of CENPA may be a novel potential
therapeutic strategy for GBM.
The present results showed that GNG3 may be
associated with the GABAergic synapse pathway. GNG3 is a
gene that encodes the γ subunits of G proteins (55), and the disruption of GNG3
may induce the dysfunction of the GABAB1 receptor signaling pathway
(56). Notably, a previous study
reported that switching GABA catabolism toward
γ-hydroxybutyric acid production could suppress glioblastoma cell
tumorigenic properties (57).
Therefore, it was hypothesized that low expression of GNG3
may be associated with the pathogenesis of GBM by regulating
related signaling pathways (Table
SII). However, further studies are required to confirm the role
of GNG3 in GBM.
Collectively, the present study has identified that
several hub genes (CDK1, BUB1, BUB1B, CENPA and GNG3)
were involved in the mechanism of GBM. The present results
suggested that CDK1, BUB1, BUB1B and CENPA may play
an essential role in the cell cycle pathway, leading to GBM
progression. In addition, GNG3 was found to be a potential
therapeutic target to treat GBM. The present results may provide
novel insights into the molecular mechanisms of GBM. Additional
studies investigating the hub genes identified in the present study
are required to examine their detailed function and interaction in
GBM. However, several classical molecular traits, such as IDH1
mutation status, were not analyzed with these hub genes in our
study. The authors believe that the IDH mutation analysis for these
hub genes, such as CENPA, need to be investigated in the future.
Furthermore, it is also appealing to investigate whether these hub
genes are regulated by oncogenic mutations of themselves or other
genes in the future.
Supplementary Material
Supporting Data
Acknowledgements
Not applicable.
Funding
This research was financially supported by The
Shanghai Science & Technology Research Program (grant no.
14411972200) and Shanghai Wu Mengchao Medical Science Foundation
(grant no. JJHM-2019009).
Availability of data and materials
The datasets analyzed in the present study are
available from The Cancer Genome Atlas database (https://portal.gdc.cancer.gov/).
Authors' contributions
GB and XS conceived and designed the study. YP
downloaded and analyzed the RNA-seq data. XC and MY collected the
samples. XC and MY analyzed the data. XC wrote the manuscript. All
authors read and approved the manuscript and agree to be
accountable for all aspects of the research in ensuring that the
accuracy or integrity of any part of the work are appropriately
investigated and resolved.
Ethics approval and consent to
participate
Informed consent was obtained from all patients and
the present study was approved by the Ethics Review Committee of
Shanghai Ninth People's Hospital.
Patient consent for publication
Not applicable.
Competing interests
The authors declare that they have no competing
interest.
References
|
1
|
Louis DN, Ohgaki H, Wiestler OD, Cavenee
WK, Burger PC, Jouvet A, Scheithauer BW and Kleihues P: The 2007
WHO classification of tumours of the central nervous system. Acta
Neuropathol. 114:97–109. 2007. View Article : Google Scholar : PubMed/NCBI
|
|
2
|
Louis DN, Perry A, Reifenberger G, von
Deimling A, Figarella-Branger D, Cavenee WK, Ohgaki H, Wiestler OD,
Kleihues P and Ellison DW: The 2016 World Health Organization
classification of tumors of the central nervous system: A summary.
Acta Neuropathol. 131:803–820. 2016. View Article : Google Scholar : PubMed/NCBI
|
|
3
|
Kloosterhof NK, de Rooi JJ, Kros M, Eilers
PH, Sillevis Smitt PA, van den Bent MJ and French PJ: Molecular
subtypes of glioma identified by genome-wide methylation profiling.
Gene Chromosomes Cancer. 52:665–674. 2013.
|
|
4
|
Rao SS, Lannutti JJ, Viapiano MS, Sarkar A
and Winter JO: Toward 3D biomimetic models to understand the
behavior of glioblastoma multiforme cells. Tissue Eng Part B Rev.
20:314–327. 2014. View Article : Google Scholar : PubMed/NCBI
|
|
5
|
Alifieris C and Trafalis DT: Glioblastoma
multiforme: Pathogenesis and treatment. Pharmacol Ther. 152:63–82.
2015. View Article : Google Scholar : PubMed/NCBI
|
|
6
|
Yang B, Ma YB and Chu SH: Silencing SATB1
overcomes temozolomide resistance by downregulating MGMT expression
and upregulating SLC22A18 expression in human glioblastoma cells.
Cancer Gene Ther. 25:309–316. 2018. View Article : Google Scholar : PubMed/NCBI
|
|
7
|
Doan NB, Nguyen HS, Al-Gizawiy MM, Mueller
WM, Sabbadini RA, Rand SD, Connelly JM, Chitambar CR, Schmainda KM
and Mirza SP: Acid ceramidase confers radioresistance to
glioblastoma cells. Oncol Rep. 38:1932–1940. 2017. View Article : Google Scholar : PubMed/NCBI
|
|
8
|
Martinez R, Rohde V and Schackert G:
Different molecular patterns in glioblastoma multiforme subtypes
upon recurrence. J Neurooncol. 96:321–329. 2010. View Article : Google Scholar : PubMed/NCBI
|
|
9
|
Witthayanuwat S, Pesee M, Supaadirek C,
Supakalin N, Thamronganantasakul K and Krusun S: Survival analysis
of glioblastoma multiforme. Asian Pac J Cancer Prev. 19:2613–2617.
2018.PubMed/NCBI
|
|
10
|
Herrlinger U, Tzaridis T, Mack F,
Steinbach JP, Schlegel U, Sabel M, Hau P, Kortmann RD, Krex D,
Grauer O, et al: Lomustine-temozolomide combination therapy versus
standard temozolomide therapy in patients with newly diagnosed
glioblastoma with methylated MGMT promoter (CeTeG/NOA-09): A
randomised, open-label, phase 3 trial. Lancet. 393:678–688. 2019.
View Article : Google Scholar : PubMed/NCBI
|
|
11
|
Hashemi M, Hadjighassem M, Zali A and
Hashemi J: Tumoricidal effect of human olfactory ensheathing cell
mediated suicide gene therapy in human glioblastoma cells. Mol Biol
Rep. 45:2263–2273. 2018. View Article : Google Scholar : PubMed/NCBI
|
|
12
|
Chao CN, Yang YH, Wu MS, Chou MC, Fang CY,
Lin MC, Tai CK, Shen CH, Chen PL, Chang D and Wang M: Gene therapy
for human glioblastoma using neurotropic JC virus-like particles as
a gene delivery vector. Sci Rep. 8:22132018. View Article : Google Scholar : PubMed/NCBI
|
|
13
|
Nathanson DA, Gini B, Mottahedeh J,
Visnyei K, Koga T, Gomez G, Eskin A, Hwang K, Wang J, Masui K, et
al: Targeted therapy resistance mediated by dynamic regulation of
extrachromosomal mutant EGFR DNA. Science. 343:72–76. 2014.
View Article : Google Scholar : PubMed/NCBI
|
|
14
|
Zhou K, Yao H, Zhang X, Liu J, Qi Z, Xie
X, Xu X, Zhou Y, Yu Z, Wang Z, et al: Next generation sequencing
and molecular imaging identify EGFR mutation and amplification in a
glioblastoma multiforme patient treated with an EGFR inhibitor: A
case report. Oncotarget. 8:50305–50313. 2017. View Article : Google Scholar : PubMed/NCBI
|
|
15
|
Hatanpaa KJ, Burma S, Zhao D and Habib AA:
Epidermal growth factor receptor in glioma: Signal transduction,
neuropathology, imaging, and radioresistance. Neoplasia.
12:675–684. 2010. View Article : Google Scholar : PubMed/NCBI
|
|
16
|
Ji C, Guo H, Zhang P, Kuang W, Fan Y and
Wu L: AnnexinA5 promote glioma cell invasion and migration via the
PI3K/Akt/NF-κB signaling pathway. J Neurooncol. 138:469–478. 2018.
View Article : Google Scholar : PubMed/NCBI
|
|
17
|
Siebzehnrubl FA, Silver DJ, Tugertimur B,
Deleyrolle LP, Siebzehnrubl D, Sarkisian MR, Devers KG, Yachnis AT,
Kupper MD, Neal D, et al: The ZEB1 pathway links glioblastoma
initiation, invasion and chemoresistance. EMBO Mol Med.
5:1196–1212. 2013. View Article : Google Scholar : PubMed/NCBI
|
|
18
|
Liu J, Liu D and Yang Z and Yang Z: High
LAMC1 expression in glioma is associated with poor prognosis.
OncoTargets Ther. 12:4253–4260. 2019. View Article : Google Scholar
|
|
19
|
Yates AD, Achuthan P, Akanni W, Allen J,
Allen J, Alvarez-Jarreta J, Amode MR, Armean IM, Azov AG, Bennett
R, et al: Ensembl 2020. Nucleic Acids Res. 48:D682–D688.
2020.PubMed/NCBI
|
|
20
|
Robinson MD, McCarthy DJ and Smyth GK:
edgeR: A Bioconductor package for differential expression analysis
of digital gene expression data. Bioinformatics. 26:139–140. 2010.
View Article : Google Scholar : PubMed/NCBI
|
|
21
|
Anders S, McCarthy DJ, Chen Y, Okoniewski
M, Smyth GK, Huber W and Robinson MD: Count-based differential
expression analysis of RNA sequencing data using R and
Bioconductor. Nat Protoc. 8:1765–1786. 2013. View Article : Google Scholar : PubMed/NCBI
|
|
22
|
Warnes GR, Bolker B, Bonebakker L,
Gentleman R, Huber W, Liaw A, Lumley T, Maechler M, Magnusson A,
Moeller S, et al: gplots: Various R programming tools for plotting
data. R Package Version 2.4. 2009.
|
|
23
|
Dennis G Jr, Sherman BT, Hosack DA, Yang
J, Gao W, Lane HC and Lempicki RA: DAVID: Database for Annotation,
Visualization, and Integrated Discovery. Genome Biol. 4:P32003.
View Article : Google Scholar : PubMed/NCBI
|
|
24
|
Szklarczyk D, Franceschini A, Wyder S,
Forslund K, Heller D, Huerta-Cepas J, Simonovic M, Roth A, Santos
A, Tsafou KP, et al: STRING v10: Protein-protein interaction
networks, integrated over the tree of life. Nucleic Acids Res.
43:D447–D452. 2015. View Article : Google Scholar : PubMed/NCBI
|
|
25
|
Diaz-Montana JJ, Gomez-Vela F and
Diaz-Diaz N: GNC-app: A new Cytoscape app to rate gene networks
biological coherence using gene-gene indirect relationships.
Biosystems. 166:61–65. 2018. View Article : Google Scholar : PubMed/NCBI
|
|
26
|
Shannon P, Markiel A, Ozier O, Baliga NS,
Wang JT, Ramage D, Amin N, Schwikowski B and Ideker T: Cytoscape: A
software environment for integrated models of biomolecular
interaction networks. Genome Res. 13:2498–2504. 2003. View Article : Google Scholar : PubMed/NCBI
|
|
27
|
Chin CH, Chen SH, Wu HH, Ho CW, Ko MT and
Lin CY: cytoHubba: Identifying hub objects and sub-networks from
complex interactome. BMC Syst Biol. 8 (Suppl 4):S112018. View Article : Google Scholar
|
|
28
|
Bandettini WP, Kellman P, Mancini C,
Booker OJ, Vasu S, Leung SW, Wilson JR, Shanbhag SM, Chen MY and
Arai AE: MultiContrast delayed enhancement (MCODE) improves
detection of subendocardial myocardial infarction by late
gadolinium enhancement cardiovascular magnetic resonance: A
clinical validation study. J Cardiovasc Magn Reson. 14:832012.
View Article : Google Scholar : PubMed/NCBI
|
|
29
|
Chandrashekar DS, Bashel B, Balasubramanya
SAH, Creighton CJ, Ponce-Rodriguez I, Chakravarthi BVSK and
Varambally S: UALCAN: A Portal for Facilitating Tumor Subgroup Gene
Expression and Survival Analyses. Neoplasia. 19:649–658. 2017.
View Article : Google Scholar : PubMed/NCBI
|
|
30
|
Livak KJ and Schmittgen TD: Analysis of
relative gene expression data using real-time quantitative PCR and
the 2(-Delta Delta C(T)) method. Methods. 25:402–408. 2001.
View Article : Google Scholar : PubMed/NCBI
|
|
31
|
Li L, Chen X and Chen Z: Identification of
key candidate genes in dairy cow in response to escherichia coli
mastitis by bioinformatical analysis. Front Genet. 10:12512019.
View Article : Google Scholar : PubMed/NCBI
|
|
32
|
Watkins S and Sontheimer H: Unique biology
of gliomas: Challenges and opportunities. Trends Neurosci.
35:546–556. 2012. View Article : Google Scholar : PubMed/NCBI
|
|
33
|
Teng J, da Hora CC, Kantar RS, Nakano I,
Wakimoto H, Batchelor TT, Chiocca EA, Badr CE and Tannous BA:
Dissecting inherent intratumor heterogeneity in patient-derived
glioblastoma culture models. Neuro Oncol. 19:820–832.
2017.PubMed/NCBI
|
|
34
|
Bonavia R, Inda MM, Cavenee WK and Furnari
FB: Heterogeneity maintenance in glioblastoma: A social network.
Cancer Res. 71:4055–4060. 2011. View Article : Google Scholar : PubMed/NCBI
|
|
35
|
Xiao S, Yang Z, Lv R, Zhao J, Wu M, Liao Y
and Liu Q: miR-135b contributes to the radioresistance by targeting
GSK3β in human glioblastoma multiforme cells. PLoS One.
9:e1088102014. View Article : Google Scholar : PubMed/NCBI
|
|
36
|
Zhu J, Ye J, Zhang L, Xia L, Hu H, Jiang
H, Wan Z, Sheng F, Ma Y, Li W, et al: Differential expression of
circular RNAs in glioblastoma multiforme and its correlation with
prognosis. Transl Oncol. 10:271–279. 2017. View Article : Google Scholar : PubMed/NCBI
|
|
37
|
Song YC, Lu GX, Zhang HW, Zhong XM, Cong
XL, Xue SB, Kong R, Li D, Chang ZY, Wang XF, et al: Proteogenomic
characterization and integrative analysis of glioblastoma
multiforme. Oncotarget. 8:97304–97312. 2017. View Article : Google Scholar : PubMed/NCBI
|
|
38
|
Fourest-Lieuvin A, Peris L, Gache V,
Garcia-Saez I, Juillan-Binard C, Lantez V and Job D: Microtubule
regulation in mitosis: Tubulin phosphorylation by the
cyclin-dependent kinase Cdk1. Mol Biol Cell. 17:1041–1050. 2006.
View Article : Google Scholar : PubMed/NCBI
|
|
39
|
Malumbres M and Barbacid M: Cell cycle,
CDKs and cancer: A changing paradigm. Nat Rev Cancer. 9:153–166.
2009. View Article : Google Scholar : PubMed/NCBI
|
|
40
|
Malumbres M and Barbacid M: Mammalian
cyclin-dependent kinases. Trends Biochem Sci. 30:630–641. 2005.
View Article : Google Scholar : PubMed/NCBI
|
|
41
|
Nigg EA: Mitotic kinases as regulators of
cell division and its checkpoints. Nat Rev Mol Cell Biol. 2:21–32.
2001. View Article : Google Scholar : PubMed/NCBI
|
|
42
|
Li W, Liu J, Fu W, Zheng X, Ren L, Liu S,
Wang J, Ji T and Du G: 3-O-acetyl-11-keto-β-boswellic acid exerts
anti-tumor effects in glioblastoma by arresting cell cycle at G2/M
phase. J Exp Clin Cancer Res. 37:1322018. View Article : Google Scholar : PubMed/NCBI
|
|
43
|
Song Z, Pan Y, Ling G, Wang S, Huang M,
Jiang X and Ke Y: Escape of U251 glioma cells from
temozolomide-induced senescence was modulated by CDK1/survivin
signaling. Am J Transl Res. 9:2163–2180. 2017.PubMed/NCBI
|
|
44
|
Chen H, Huang Q, Dong J, Zhai DZ, Wang AD
and Lan Q: Overexpression of CDC2/CyclinB1 in gliomas, and CDC2
depletion inhibits proliferation of human glioma cells in vitro and
in vivo. BMC Cancer. 8:292008. View Article : Google Scholar : PubMed/NCBI
|
|
45
|
de Voer RM, Geurts van Kessel A, Weren RD,
Ligtenberg MJ, Smeets D, Fu L, Vreede L, Kamping EJ, Verwiel ET,
Hahn MM, et al: Germline mutations in the spindle assembly
checkpoint genes BUB1 and BUB3 are risk factors for colorectal
cancer. Gastroenterology. 145:544–547. 2013. View Article : Google Scholar : PubMed/NCBI
|
|
46
|
Bie L, Zhao G, Cheng P, Rondeau G,
Porwollik S, Ju Y, Xia XQ and McClelland M: The accuracy of
survival time prediction for patients with glioma is improved by
measuring mitotic spindle checkpoint gene expression. PLoS One.
6:e256312011. View Article : Google Scholar : PubMed/NCBI
|
|
47
|
Ma Q, Liu Y, Shang L, Yu J and Qu Q: The
FOXM1/BUB1B signaling pathway is essential for the tumorigenicity
and radioresistance of glioblastoma. Oncol Rep. 38:3367–3375.
2017.PubMed/NCBI
|
|
48
|
Lee E, Pain M, Wang H, Herman JA, Toledo
CM, DeLuca JG, Yong RL, Paddison P and Zhu J: Sensitivity to
BUB1B inhibition defines an alternative classification of
glioblastoma. Cancer Res. 77:5518–5529. 2017. View Article : Google Scholar : PubMed/NCBI
|
|
49
|
Tannous BA, Kerami M, Van der Stoop PM,
Kwiatkowski N, Wang J, Zhou W, Kessler AF, Lewandrowski G, Hiddingh
L, Sol N, et al: Effects of the selective MPS1 inhibitor MPS1-IN-3
on glioblastoma sensitivity to antimitotic drugs. J Natl Cancer
Inst. 105:1322–1331. 2013. View Article : Google Scholar : PubMed/NCBI
|
|
50
|
Kessler AF, Frombling GE, Gross F, Hahn M,
Dzokou W, Ernestus RI, Löhr M and Hagemann C: Effects of tumor
treating fields (TTFields) on glioblastoma cells are augmented by
mitotic checkpoint inhibition. Cell Death Discov. 4:122018.
View Article : Google Scholar : PubMed/NCBI
|
|
51
|
De Rop V, Padeganeh A and Maddox PS:
CENP-A: The key player behind centromere identity, propagation, and
kinetochore assembly. Chromosoma. 121:527–538. 2012. View Article : Google Scholar : PubMed/NCBI
|
|
52
|
Tomonaga T, Matsushita K, Yamaguchi S,
Oohashi T, Shimada H, Ochiai T, Yoda K and Nomura F: Overexpression
and mistargeting of centromere protein-A in human primary
colorectal cancer. Cancer Res. 63:3511–3516. 2003.PubMed/NCBI
|
|
53
|
Rajput AB, Hu N, Varma S, Chen CH, Ding K,
Park PC, Chapman JA, Sengupta SK, Madarnas Y, Elliott BE and
Feilotter HE: Immunohistochemical assessment of expression of
centromere protein-A (CENPA) in Human invasive breast cancer.
Cancers. 3:4212–4227. 2011. View Article : Google Scholar : PubMed/NCBI
|
|
54
|
Li YM, Liu XH, Cao XZ, Wang L and Zhu MH:
Expression of centromere protein A in hepatocellular carcinoma.
Zhonghua Bing Li Xue Za Zhi. 36:175–178. 2007.(In Chinese).
PubMed/NCBI
|
|
55
|
Downes GB, Copeland NG, Jenkins NA and
Gautam N: Structure and mapping of the G protein gamma3 subunit
gene and a divergently transcribed novel gene, gng3lg. Genomics.
53:220–230. 1998. View Article : Google Scholar : PubMed/NCBI
|
|
56
|
Schwindinger WF, Giger KE, Betz KS,
Stauffer AM, Sunderlin EM, Sim-Selley LJ, Selley DE, Bronson SK and
Robishaw JD: Mice with deficiency of G protein gamma3 are lean and
have seizures. Mol Cell Biol. 24:7758–7768. 2004. View Article : Google Scholar : PubMed/NCBI
|
|
57
|
El-Habr EA, Dubois LG, Burel-Vandenbos F,
Bogeas A, Lipecka J, Turchi L, Lejeune FX, Coehlo PL, Yamaki T,
Wittmann BM, et al: A driver role for GABA metabolism in
controlling stem and proliferative cell state through GHB
production in glioma. Acta Neuropathol. 133:645–660. 2017.
View Article : Google Scholar : PubMed/NCBI
|