Introduction
The size and shape of a lesion in colorectal cancer
(CRC) are believed to be connected directly to clinical phenotype
and to serve as predictors of malignant behavior (1,2). Early
superficial CRC lesions can be classified as elevated (polypoid and
non-polypoid) or depressed (3,4).
Polypoid lesions grow above the surface of the mucosa and the
volume of the polypoid component appears to be correlated with
malignant behavior. Non-polypoid lesions may grow flat or slightly
elevated, eventually progressing, into polypoid lesions or lateral
spreading tumors. Finally, depressed lesions (0-IIc, 0-IIc+IIa,
0-IIa+IIc), which comprise only 2.3% of all superficial lesions
(5), warrant particular attention
due to the difficulty of detection and removal by fiberscope
(6,7). Since depressed-type lesions are
frequently located in the right colon, they can be difficult to
detect. Moreover, depressed lesions, independent of size, have been
associated with an increased risk of rapid progression to cancer,
as shown in endoscopy and pathology units in Japan (4,5,8,9).
Depressed-type lesions and tumors, such as earlier phase lesions
(0-IIc, 0-IIc+IIa, 0-IIa+IIc) and/or advanced tumors (types 2 and
3), invade and metastasize to lymph nodes and other distant organs
and indicate a poorer prognosis than do type 1 tumors.
Microarray analysis of RNA from the cancer cells of
144 CRC cases revealed that the fibronectin 1 (FN1) gene is
significantly associated with tumor shape in CRC. FN1 is a
glycoprotein that is present in a soluble dimeric form in the
plasma, and in a dimeric or multimeric form at the cell surface and
in the extracellular matrix (10).
It is involved in cell adhesion and migration processes including
embryogenesis, wound healing, blood coagulation, host defense and
metastasis. The gene has 3 regions that are subject to alternative
splicing, with the potential to produce 20 transcript variants.
However, the full-length nature of some of these variants has not
been determined.
In the present study, we performed a comprehensive
analysis to identify genes that determine tumor shape (11). Evaluation of changes in the
expression patterns of these genes may allow physicians to make a
precise, non-invasive diagnosis of depressed-type lesions in early
CRC. The correlation between FN1 expression and tumor shape
was validated by quantitative real-time reverse transcription
polymerase chain reaction (qRT-PCR) before single nucleotide
polymorphism (SNP) analysis was performed to identify polymorphisms
in the FN1 coding region that could be used as predictors of
tumor shape (1) in CRC.
Materials and methods
CRC patients
The study group comprised 146 patients with primary
CRC. The patients ranged in age from 32 to 96 years, with an
average age of 66 years. They underwent operations at major
hospitals in Japan: Kyushu University, Kitazato University, Tokyo
Medical and Dental University, National Defense University, Mie
University, Takano Hospital, National Cancer Center and Osaka
University from 2004 to 2009. None of the patients received
preoperative treatments such as radiation or chemotherapy.
Immediately after surgical resection, tumor samples (T) were
carefully removed from primary cancerous lesions for cell isolation
using laser microdissection (LMD). Clinicopathological patient data
were obtained from clinical records. Histopathological assessments
were made using the Japanese Classification of Colorectal
Carcinoma, 7th edition.
Collection of CRC cells
Tissues from the 146 CRC patients were collected for
LMD using the Leica Laser Microdissection System (Leica
Microsystems, Wetzlar, Germany). In brief, 5-μm frozen sections
were fixed in 70% ethanol for 30 sec, stained with hematoxylin and
eosin and dehydrated as follows: 5 sec each in 70, 95 and 100%
ethanol and a final 5 min in xylene. The sections were air-dried,
then microdissected with the LMD system. Target cells, at least 100
cells/section, were excised and bound to transfer film for total
DNA extraction.
Total RNA extraction and first-strand
cDNA synthesis
CRC tissue specimens or cultured cell lines at
subconfluency were homogenized, and total RNA was extracted using
the modified acid-guanidine-phenol-chloroform method. Total RNA
(8.0 μg) was reverse transcribed to cDNA using M-MLV RT (Invitrogen
Corporation, Carlsbad, CA, USA).
qRT-PCR
The sequences for FN1 mRNA were: FN1,
sense primer, 5′-GAACTATGATGCCGACCAGAA-3′ and antisense primer,
5′-GGTTGTGCAGATTTCCTCGT-3′. Glyceraldehyde-3-phosphate
dehydrogenase (GAPDH) was used as an internal control and
GAPDH primers were: sense primer
5′-TTGGTATCGTGGAAGGACTCTA-3′ and antisense primer,
5′-TGTCATATTTGGCAGGTT-3′. Real-time monitoring of PCR reactions was
performed using the LightCycler system (Roche Applied Science,
Indianapolis, IN, USA) and SYBR-Green I dye (Roche Diagnostics,
Tokyo, Japan). Monitoring was performed according to the
manufacturer’s instructions. In brief, a master mixture containing
1 μl of cDNA, 2 μl of DNA Master SYBR-Green I mix, 50 ng of primers
and 24 μl of 25 mM MgCl2 was prepared on ice, and the
final volume was adjusted to 20 μl with water. After the reaction
mixture was loaded into glass capillary tubes, qRT-PCR was
performed with the following cycling conditions: initial
denaturation at 95°C for 10 min, followed by 45 cycles of 95°C for
10 sec, annealing at 60°C for 10 sec and extension at 72°C for 10
sec. After amplification, products were subjected to a temperature
gradient from 65° to 95°C at 0.2°C/sec, under continuous
fluorescence monitoring, to produce a melting curve for analysis of
primer specificity.
Expression array analysis
For microarray expression analysis, we used a
commercially available Whole Human Genome Oligo DNA Microarray kit
(Agilent Technologies, Santa Clara, CA, USA). A list of genes on
this cDNA microarray is available from http://www.chem.agilent.com/scripts/generic.asp?lpage=5175&indcol=Y&prodcol=Y&prodcol=N&indcol=Y&prodcol=N.
Cyanine (Cy)-labeled cRNA was prepared using T7 linear
amplification as described in the Agilent Low RNA Input Fluorescent
Linear Amplification Kit Manual (Agilent Technologies). Labeled
cRNA was fragmented and hybridized to an oligonucleotide microarray
(Whole Human Genome 4×44K Agilent G4112F). Fluorescence intensities
were determined with an Agilent DNA Microarray Scanner and were
analyzed using G2567AA Feature Extraction Software version A.7.5.1
(Agilent Technologies), which uses locally weighted linear
regression curve fit (LOWESS) normalization. This microarray study
followed the MIAME guidelines issued by the Microarray Gene
Expression Data group. Further analyses were performed using
GeneSpring version 7.3 (Silicon Genetics, San Carlos, CA, USA).
Evaluation of representative SNPs in the
FN1 coding region
Genomic DNA was extracted from the peripheral blood
of 64 patients with primary CRC using a QIAamp DNA Mini kit
according to the manufacturer’s protocol (Qiagen, Valencia, CA,
USA). SNPs in the exonic and intronic regions of FN1 were
evaluated simultaneously using an Affymetrix genome-wild SNP array
to determine the association between FN1 expression and the
genotype of each SNP in the FN-1 gene: rs6707530, rs11651,
rs7594168, rs10498037, rs33996776, rs1250214, rs7568287,
rs10201850, rs41347752, rs1250204, rs7588661, rs2577302, rs1968510,
rs34255697, rs10172425, rs7572169, rs2372545, rs1250264,
rs12105173, rs10199059, rs1437799, rs1250270, rs11693652,
rs7567647, rs1898536, rs10202483, rs1250247, rs1250233, rs6753702
and rs1250252. However, rs2372545 and rs1250264 were excluded due
to low-quality data. The Ethics Committee of each institute
approved this project.
Results
Differential expression of FN-1 in cells
isolated from CRC primary tumors
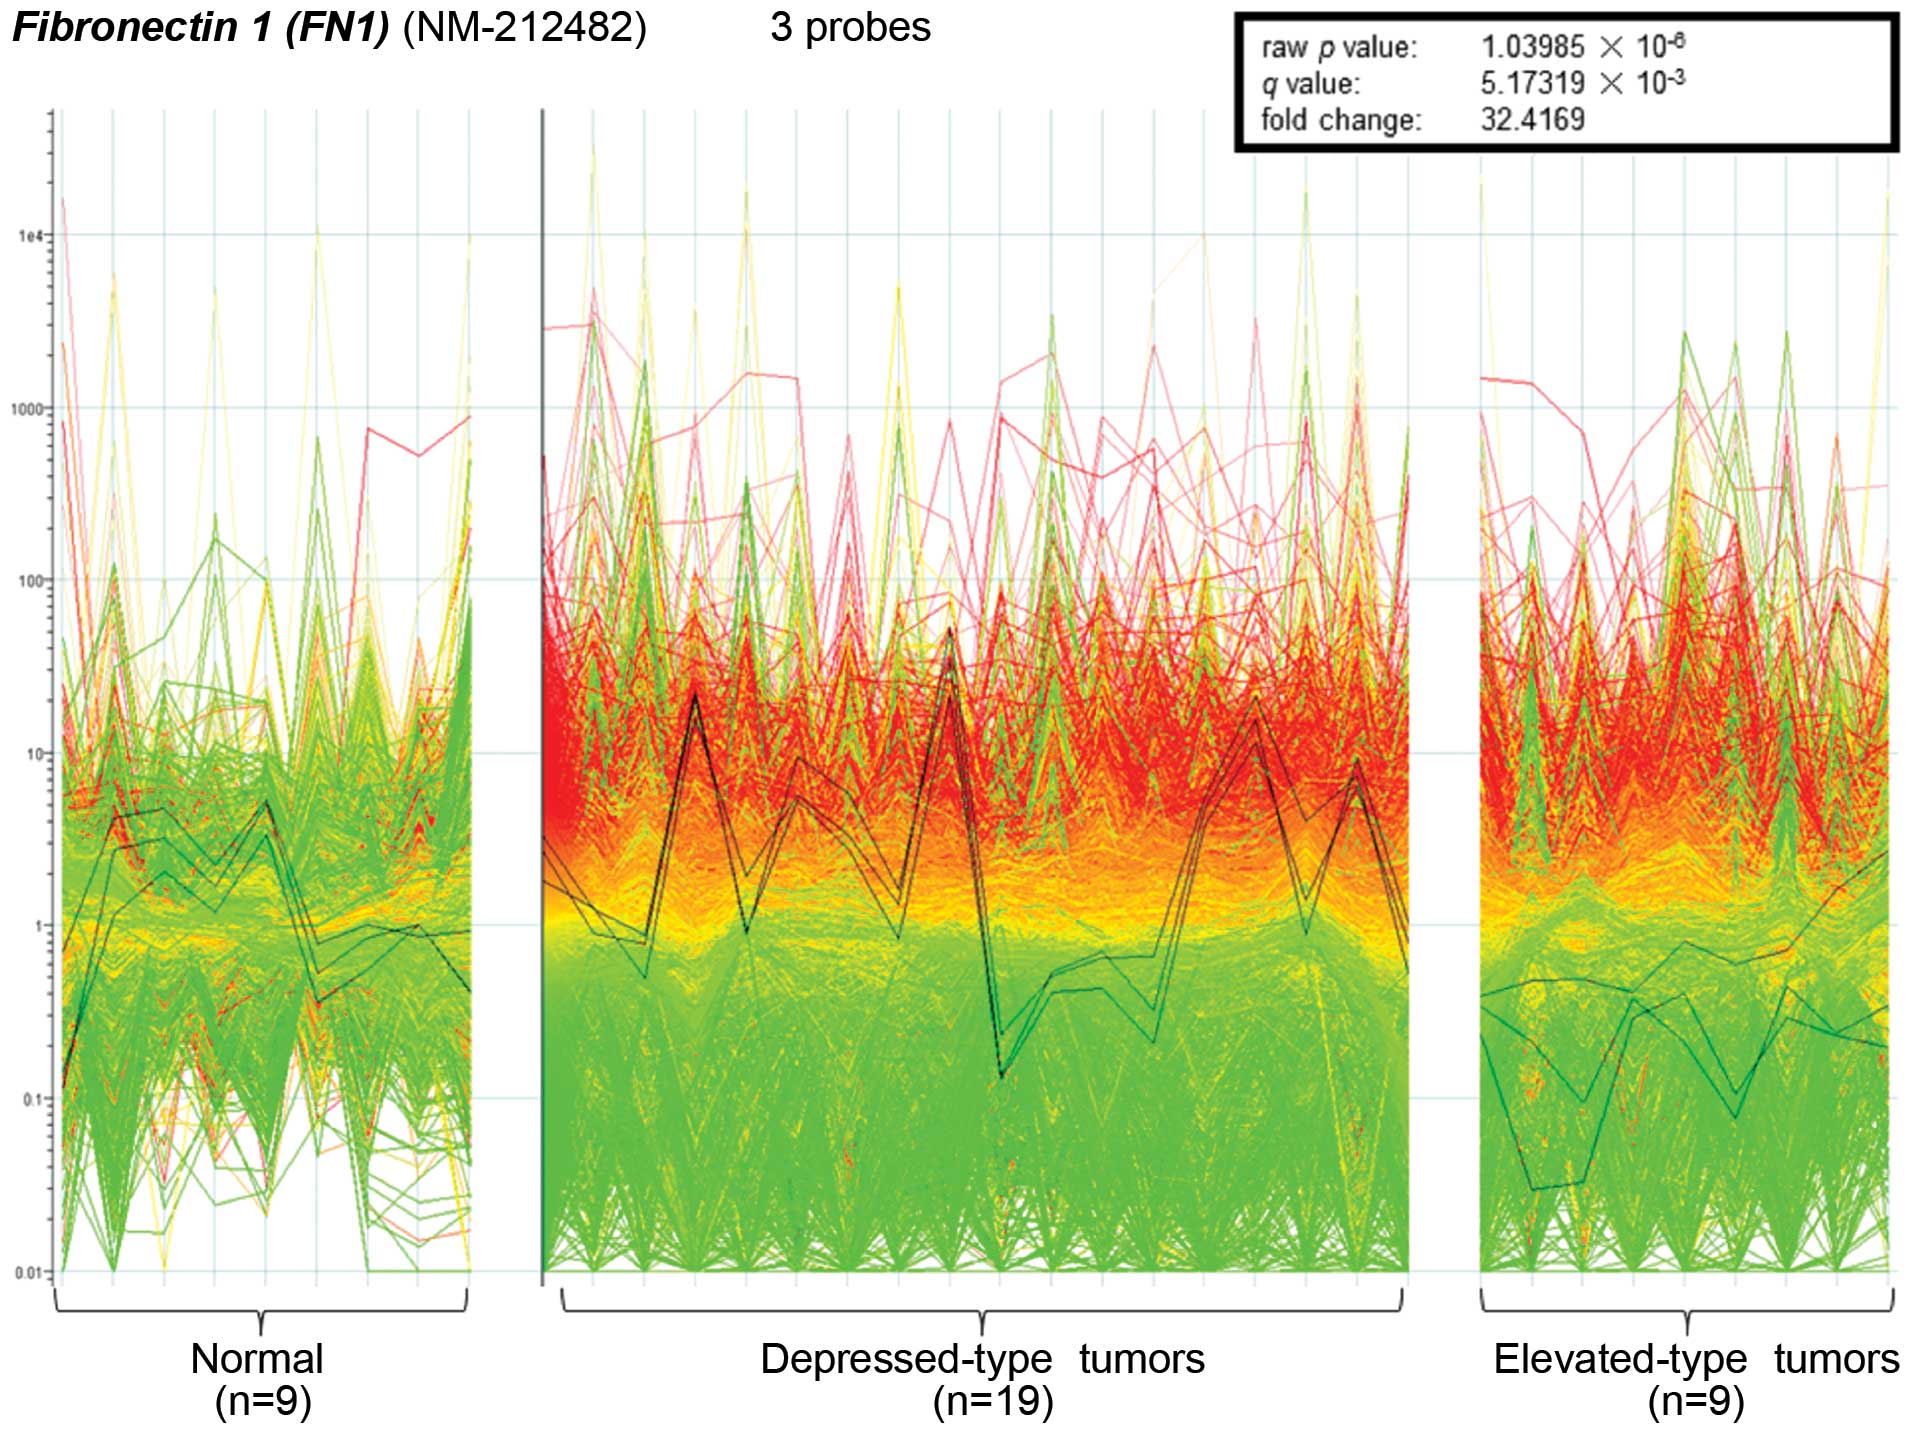
Microarray analysis revealed a significant
difference in the expression of the FN1 gene between
depressed-type tumors and lesions (0-IIb, 0-IIc, 0-IIa+IIc,
0-IIc+IIa, type 2 and type 3 tumors) and elevated-type tumors
(0-Ip, 0-Isp, 0-Is, 0-IIa and type 1 tumors). The microarray
contained three probes for FN1, all of which were
significantly upregulated in depressed-type lesions (n=129)
compared to elevated-type tumors (n=17). The 3 probes were also
used to validate these findings in representative samples of
depressed (n=19) and elevated (n=9) tumors and normal tissues
(n=9). The 19 depressed tumors showed significantly higher
expression than the other groups (raw p-value,
1.03985×10⁻⁶; q-value, 5.17319×10⁻³;
fold-change, 32.4169; Fig. 1). In
comparison to that of normal samples, the average expression of
FN1 in depressed type lesions was upregulated, while
expression in elevated-type lesions was downregulated.
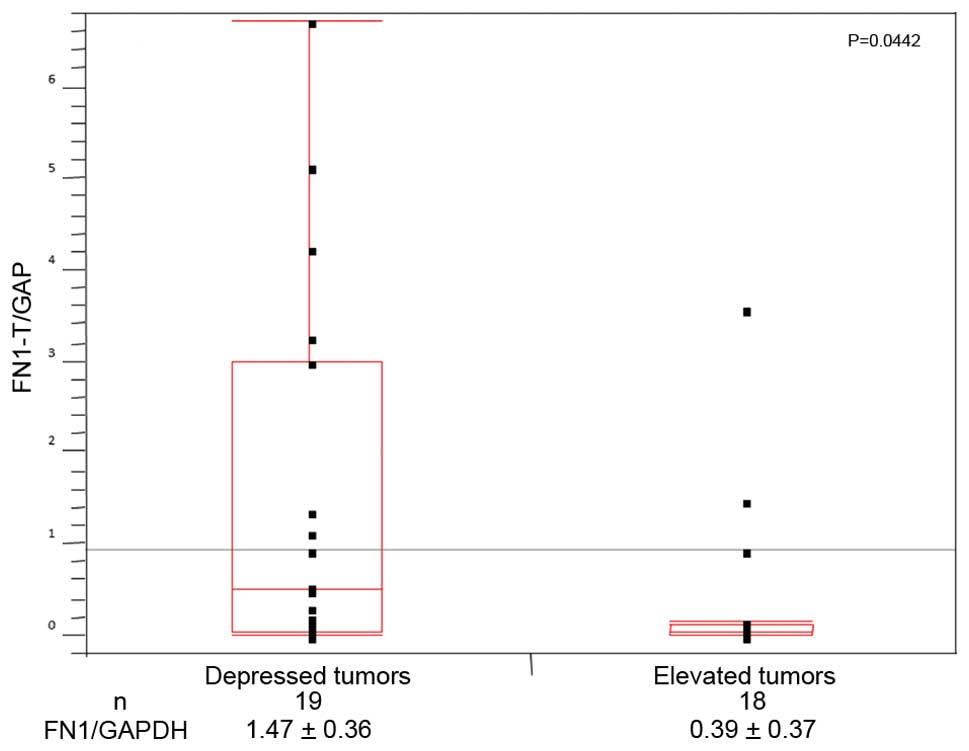
qRT-PCR supported the finding that the expression of
FN1 in the subgroup of depressed tumors (19 tumors;
1.47±0.36) was significantly higher (p<0.05) than that in the
subgroup of elevated tumors (n=18; 0.39±0.37; Fig. 2).
Clinicopathological significance of FN1
in CRC cases
In addition to tumor shape, 2 other
clinicopathological factors were associated with FN1
expression (Table I). Higher
expression was observed in larger tumors (>5 cm; n=71) than in
smaller tumors (n=75; p=0.0024). There was also a significant
difference in FN1 expression between lymphatic permeation
negative (n=65; 4.38±0.24) and positive (n=61; 3.70±0.22) tumors
(p=0.036).
 | Table IClinicopathologic significance of the
expression of fibronectin-1/GAPDH in CRC cases. |
Table I
Clinicopathologic significance of the
expression of fibronectin-1/GAPDH in CRC cases.
| Clinicopathologic
analysis | N | Fibronectin-1/GAPDH
log | P-value |
|---|
| Gender |
| Male | 82 | 4.27+0.28 | NS |
| Female | 64 | 3.67+0.25 | |
| Location of
tumor |
| Rectum | 52 | 4.40+0.27 | NS |
| Proximal colon | 43 | 3.57+0.30 | |
| Distal colon | 51 | 3.97+0.28 | |
| Size of tumor
(cm) |
| Large (>5) | 71 | 4.51+0.23 | 0.0024 |
| Small (<5) | 75 | 3.53+0.22 | |
| Type of tumora |
| Depressed | 129 | 4.16+0.17 | 0.0098 |
| Elevated | 17 | 2.84+0.47 | |
| Histologic
differentiationb |
| Well | 82 | 4.02+1.92 | NS |
| Mod | 61 | 4.03+2.11 | |
| Poor | 2 | 2.76+0.13 | |
| Muc | 1 | 3.62 | |
| Depth of tumor
invasion |
|
pTis-pT1(pM-pSM) | 8 | 2.92+0.70 | NS |
| pT2 (pMP) | 19 | 4.25+0.46 | |
| pT3 (pSS/pA) | 88 | 4.12+0.21 | |
|
pT4(pSE-PSO/pAI) | 31 | 3.82+0.36 | |
| Lymphatic
permeation |
| Negative | 65 | 4.38+0.24 | 0.036 |
| Positive | 81 | 3.70+0.22 | |
| Venous
permeation |
| Negative | 54 | 4.15+0.27 | NS |
| Positive | 91 | 3.93+0.21 | |
| Lymph node
metastasis |
| Negative | 75 | 4.01+0.23 | NS |
| Positive | 70 | 3.98+0.24 | |
| Peritoneal
dissemination |
| Negative | 140 | 4.00+0.17 | NS |
| Positive | 6 | 3.933+0.81 | |
| Liver metastasis |
| Negative | 126 | 4.01+0.18 | NS |
| Positive | 20 | 3.98+0.45 | |
| Dukes |
| A | 21 | 3.86+0.44 | NS |
| B | 49 | 4.09+0.29 | |
| C | 53 | 4.09+0.28 | |
| D | 23 | 3.77+0.42 | |
FN1 expression is associated with 1
SNP
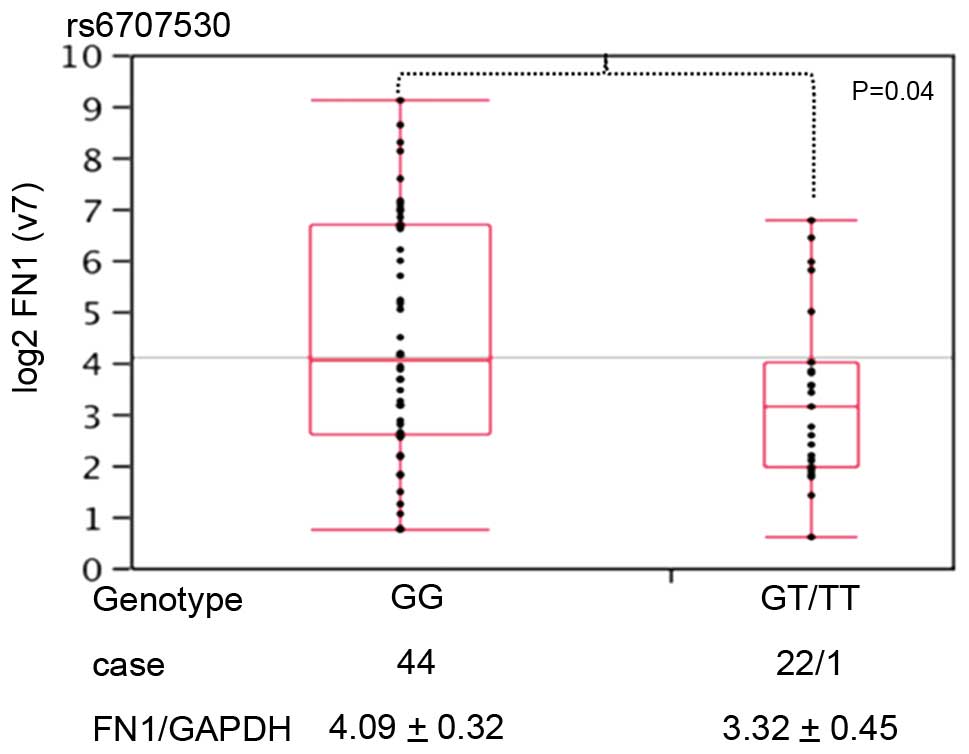
Of the 30 SNPs in the FN1 region, rs6707530
was associated with tumor shape in CRC (Fig. 3). The expression of FN1/GAPDH
was higher in CRC samples with a GG genotype (n=44; 4.09±0.32) at
this locus rather than a GT or TT genotype (n=23; 3.32±0.45).
Discussion
The tumorigenesis of depressed tumors progresses
along a different pathway from the conventional path for elevated
tumors that was advocated by Vogelstein et al (4). It is believed that malignant cells in
serrated and adenomatous lesions proliferate and grow laterally and
top-down from the surface of the lesion (1–3).
However, little is known about how the molecular biology of certain
cancer cells is determined. In the present study, we focused on
clarifying the mechanism responsible for the differentiation of the
shapes of malignant cells. In order to do this, we extracted cancer
cells from primary tumor tissues, avoiding contamination with
interstitial cells or non-malignant cells with the use of LMD.
Microarray analysis following the extraction of total RNA and
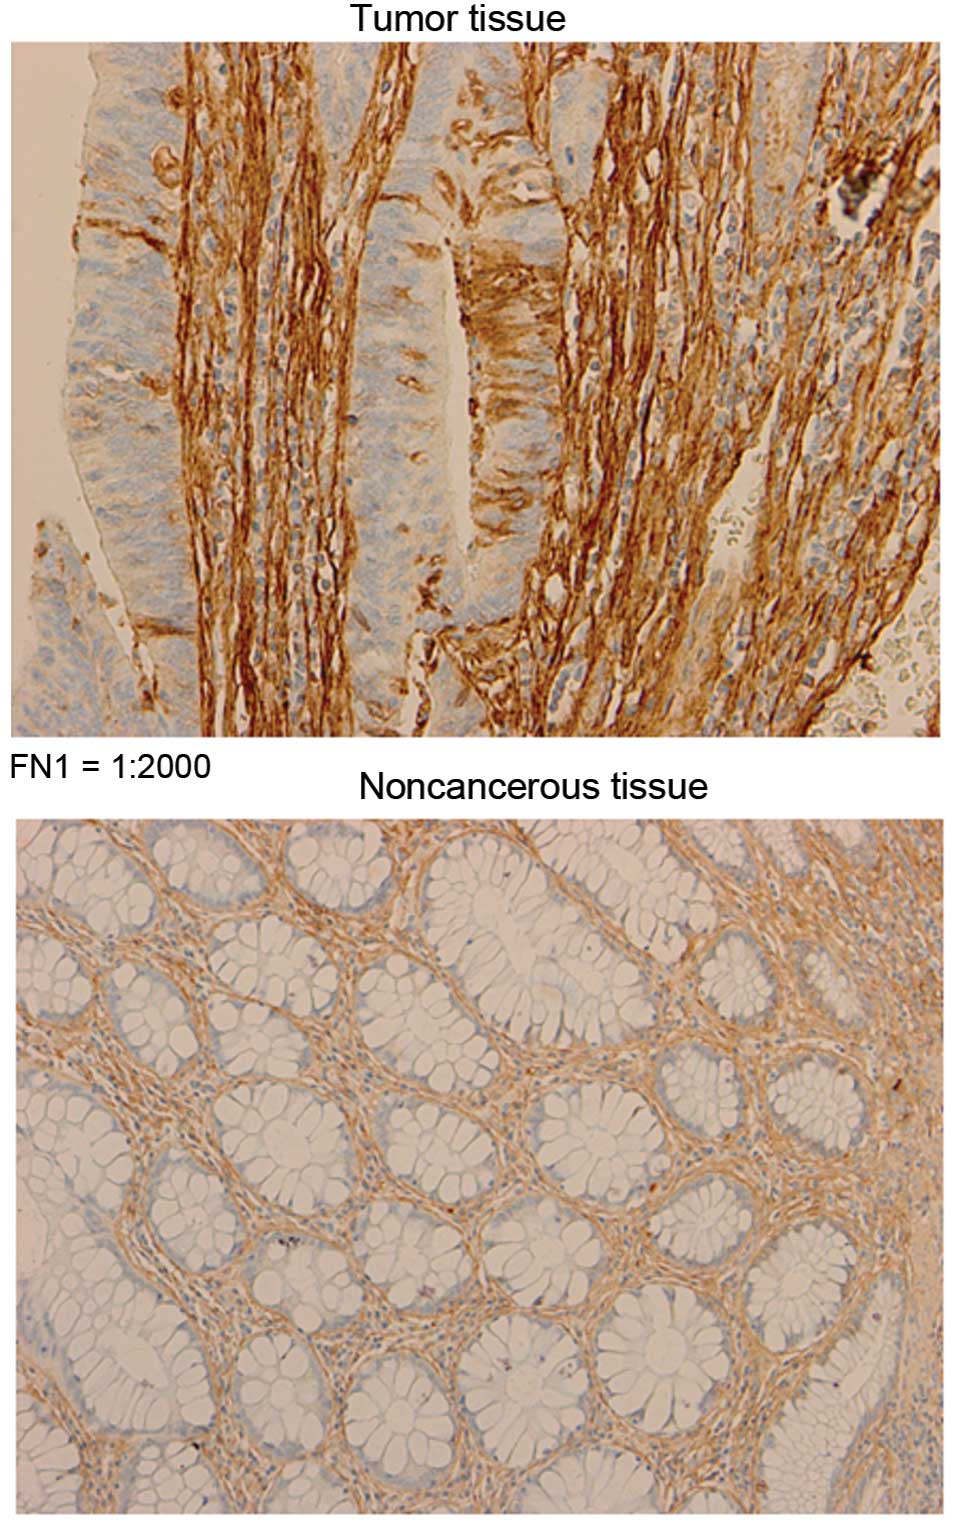
purified mRNA identified 1 gene, FN1 (10). FN1 was more highly expressed
in the interstitial tissues than in the superficial glands in the
section (Fig. 4). We propose that
the abundant expression of FN1 may allow for the generation
of traction forces through its surface receptors. However, further
in vitro and in vivo studies are required to answer
this question.
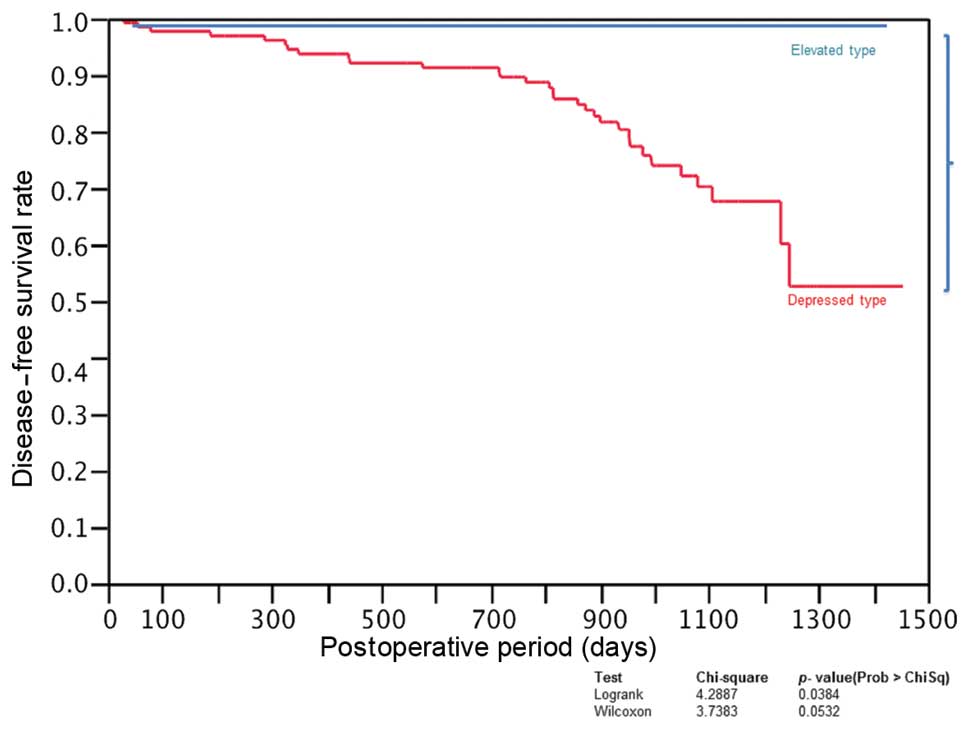
CRC characterized by depressed tumors has a higher
incidence of recurrence than CRC cases characterized by elevated
tumors (Fig. 5). Considering
practical clinical applications, reliable markers that can be used
to predict tumor shape may facilitate the early diagnosis of
malignancy prior to a colonoscopy. In the present study, we
identified 1 SNP in FN1 that was significantly associated
with tumor shape.
In conclusion, we found that the majority of CRC
cases with depressed tumors had a higher frequency of elevated
FN1 expression. In addition, we could predict the presence
of depressed tumors by evaluation of 1 SNP (rs6707530) in the
FN1 region in germline DNA from peripheral blood. This
discovery will beneficial in the clinical setting, providing a
method for the early diagnosis of depressed-type tumors by colon
fiberscope.
References
|
1
|
Jass JR, Baker K, Zlobec I, et al:
Advanced colorectal polyps with the molecular and morphological
features of serrated polyps and adenomas: concept of a ‘fusion’
pathway to colorectal cancer. Histopathology. 49:121–131.
2006.PubMed/NCBI
|
|
2
|
Jass JR, Biden KG, Cummings MC, et al:
Characterisation of a subtype of colorectal cancer combining
features of the suppressor and mild mutator pathways. J Clin
Pathol. 52:455–460. 1999. View Article : Google Scholar : PubMed/NCBI
|
|
3
|
Snover DC, Jass JR, Fenoglio-Preiser C and
Batts KP: Serrated polyps of the large intestine: a morphologic and
molecular review of an evolving concept. Am J Clin Pathol.
124:380–391. 2005. View Article : Google Scholar : PubMed/NCBI
|
|
4
|
Vogelstein B, Fearon ER, Hamilton SR, et
al: Genetic alterations during colorectal-tumor development. N Engl
J Med. 319:525–532. 1988. View Article : Google Scholar : PubMed/NCBI
|
|
5
|
Kudo S, Lambert R, Allen JI, et al:
Nonpolypoid neoplastic lesions of the colorectal mucosa.
Gastrointest Endosc. 68(Suppl 4): S3–S47. 2008. View Article : Google Scholar : PubMed/NCBI
|
|
6
|
Kudo S, Kashida H, Tamura S and Nakajima
T: The problem of ‘flat’ colonic adenoma. Gastrointest Endosc Clin
N Am. 7:87–98. 1997.
|
|
7
|
Kudo S, Tamura S, Hirota S, et al: The
problem of de novo colorectal carcinoma. Eur J Cancer.
31A:1118–1120. 1995. View Article : Google Scholar : PubMed/NCBI
|
|
8
|
The Paris endoscopic classification of
superficial neoplastic lesions: esophagus, stomach, and colon:
November 30 to December 1, 2002. Gastrointest Endosc. 58(Suppl 6):
S3–S43. 2003. View Article : Google Scholar : PubMed/NCBI
|
|
9
|
Update on the Paris classification of
superficial neoplastic lesions in the digestive tract. Endoscopy.
37:570–578. 2005. View Article : Google Scholar : PubMed/NCBI
|
|
10
|
Goossens K, Van Soom A, Van Zeveren A,
Favoreel H and Peelman LJ: Quantification of fibronectin 1 (FN1)
splice variants, including two novel ones, and analysis of
integrins as candidate FN1 receptors in bovine preimplantation
embryos. BMC Dev Biol. 9:12009. View Article : Google Scholar : PubMed/NCBI
|
|
11
|
Sato Y, Yoshizato T, Shiraishi Y, et al:
Integrated molecular analysis of clear-cell renal cell carcinoma.
Nat Genet. 45:860–867. 2013. View
Article : Google Scholar : PubMed/NCBI
|