Introduction
Pancreatic cancer (PC) is the fourth leading cause
of cancer mortality, with a 5-year survival rate of <5%
(1); and even for patients who have
undergone radical surgery, the 5-year survival rate is a dismal
15–23% (2), with a rate of
recurrence within 1 year up to 54% (3). Therefore, an exploration of the
underlying mechanisms and identification of novel prognostic
markers in order to develop new therapeutic strategies for PC are
urgently required.
MicroRNAs (miRNAs), a class of short non-coding RNA
molecules that range in size from 19 to 25 nucleotides, have been
proposed as promising biomarkers of early cancer detection and as
accurate prognosis indicators, as well as targets for more
efficient treatment (4,5). miRNAs have important roles in
regulating the translation of numerous genes and the degradation of
mRNAs through base pairing to partly complementary sites,
predominantly in the 3′-untranslated region (UTR) (6,7).
Numerous studies have demonstrated that miRNAs serve important
roles in the regulation of tumor biology (8–10).
Model biomarkers should be easily detectable and correlate closely
with the clinical outcome, and miRNAs are candidates that may match
these criteria.
High-throughput technologies have been employed to
identify differences in miRNA and mRNA expression levels between
normal and cancerous tissues, and they are increasingly valued as
promising tools in medical oncology with a range of clinical
applications, i.e., from molecular diagnosis to the molecular
classification of cancers, from patient stratification to prognosis
prediction, and from novel drug target discovery to tumor response
prediction (11–13). Numerous expression profiling studies
on PC carcinogenesis have been performed during the last decade
using microarray technology, which has revealed hundreds of
differentially expressed genes (DEGs) and/or differentially
expressed miRNAs (DEMs) to be involved in different pathways and/or
biological processes (BPs). Given that independent comparative
analyses of the DEGs and DEMs have revealed only a relatively
limited reliability for discriminating cancerous from normal tissue
(14), it is therefore necessary to
conduct meta-analyses to obtain more convincing results. To meet
this aim, in the present study DEMs were screened and applied in
order to identify a 5-microRNA signature that could be used as a
biomarker for PC in The Cancer Genome Atlas (TCGA)-pancreatic
adenocarcinoma (PAAD) miRNA sequence datasets using least absolute
shrinkage and selection operator (LASSO) (15) regression analysis. Furthermore,
weighted gene co-expression network analysis (WGCNA) (16), rather than significance analysis of
microarrays (SAM), was used to identify tumor-associated genes.
Finally, associations between DEMs and tumor-associated genes were
constructed using the Search Tool for the Retrieval of Interacting
Genes/Proteins (STRING) (17)
database, and visualized using the Cytoscape open source
bioinformatics software platform (18).
Materials and methods
Search strategy and data collection,
preprocessing, normalization and integrated analysis
A thorough search of the available literature was
performed in the Gene Expression Omnibus (GEO) (https://www.ncbi.nlm.nih.gov/gds) and
ArrayExpress electronic databases (https://www.ebi.ac.uk/arrayexpress/) between January
2007 and October 2017 using the following terms: ‘[(microRNA OR
miRs OR miR OR miRNA) AND (pancreatic OR pancreas)] AND (tumor OR
carcinoma OR neoplasm OR cancer)’. Bai and Shuai independently
carried out this procedure, and any discrepancies were resolved by
mutual discussion.
The inclusion criteria were as follows: i) Original
experimental studies that screened for different miRNAs between
tumor tissue and normal tissue/adjacent non-tumor tissue in humans;
and ii) each dataset contained at least 5 PC samples and 5 normal
samples.
The following were the exclusion criteria: i)
Duplicated or overlapping studies/datasets; ii) single sample
studies and certain platforms with various datasets; iii)
laboratory studies/datasets on cell lines, or at the animal level;
iv) non-microarray studies/datasets; and v) sequence datasets.
All datasets were extracted using the ArrayExpress
and GEOquery packages (19),
normalized individually on the base-2 logarithm using the Robust
Multi-Array Average and Linear Models for Microarray (LIMMA)
algorithm (20) packages, and
annotated by converting different probe IDs into gene IDs. All
miRNA names were standardized according to miRBase version 17 via
miRBase Tracker (21). Any probes
that did not map to a gene ID were removed as viral miRNAs or
non-miRNA probes. Subsequently, the MetaDE package (https://cran.r-project.org/src/contrib/Archive/MetaDE/)
was applied to integrate the above 11 datasets (data not shown),
and filter thresholds were set at 10%, with nPermutation (the
number of random permutations to conduct) set at 300. A P-value and
false discovery rate (FDR) of the DEMs <0.01 were considered to
indicate statistically significant values.
Validation of DEMs by reverse
transcription-quantitative polymerase chain reaction (RT-qPCR)
To validate the results of the integrated
bioinformatics analysis, 25 pairs of fresh PC and adjacent
non-cancerous pancreatic tissues were collected and examined by
experienced pathologists at the Union Hospital, Wuhan between April
1 and July 1, 2018. Written informed consent was obtained from all
patients or their guardians. The tissue samples were frozen
immediately and stored in liquid nitrogen following their surgical
resection. Total RNA was extracted using the Qiagen
RNeasy® kit (Qiagen GmbH, Hilden, Germany) and
subsequently reverse-transcribed into cDNA using an oligo-dT primer
and SuperScript II reverse transcriptase (Invitrogen®;
Thermo Fisher Scientific, Inc., Waltham, MA, USA). Levels of the
miRNAs were quantified by RT-qPCR using SYBR® Premix Ex
Taq™ reagent (Takara Bio, Inc., Otsu, Japan) and the ABI7500
real-time PCR system (Applied Biosystems®; Thermo Fisher
Scientific, Inc.): Denaturation at 94°C for 5 min, followed by 36
cycles of denaturation at 94°C for 35 sec, annealing at 56°C for 30
sec, and then extension at 72°C for 35 sec. Relative expression
levels were normalized against U6 RNA, and calculated using the
2−∆∆Cq method (22).
Integrated-signature miRNA analysis of
TCGA
In order that the screened DEMs may be used to
predict the carcinogenesis of PC, the predicted performance of the
DEMs in classifying non-tumor and tumor tissues was estimated based
on the TCGA-PAAD miRNA sequence datasets using receiver operating
characteristic (ROC) curves. For selection of the significant
combined DEMs, the TCGA-PAAD miRNA sequence expression profile data
were assessed by applying a LASSO penalized regression analysis
method with 10-fold cross-validation to predict tumor and non-tumor
tissue. The best regression model was generated when the minimum Cp
value was chosen. A risk score was generated using the sum of the
microRNA expression values weighted by the coefficients from the
LASSO regression. Subsequently, the associations between the risk
score and the clinical features were estimated. LASSO regression
analysis was performed using a ‘lars’ package based on R software
(15). TCGA-PAAD matrix data were
extracted using the TCGAbiolinks (23) package.
Weighted gene co-expression network
construction and identification of the PC carcinogenesis
module
It is necessary to identify the significant coding
genes associated with carcinogenesis of PC prior to the
construction of miRNA-mRNA networks. The GSE41368 dataset was
therefore selected to construct the scale-free gene co-expression
networks with the WGCNA software package. The expression matrix,
containing 20,284 genes and 18 samples, was extracted and
normalized using the GEOquery and LIMMA packages, as described
above. Subsequently, WGCNA was conducted according to the process
proposed by Langfelder et al (16).
The dynamic decision-making tree, node-splitting
method and cluster analysis of squared Euclidean distance were used
to screen for module eigengenes involved in these clinical traits,
particularly those associated with the progression and
carcinogenesis of PC. Spearman's correlation analysis was performed
to confirm the object module, and the module that had the highest
Spearman's correlation coefficient was defined as the
carcinogenesis module.
Gene set enrichment analysis
(GSEA)
To investigate the functions of these gene
signatures, Gene Ontology (GO) enrichment analysis based on the GO
database was performed, and further assessment of the signaling
pathways involved was carried out according to an analysis based on
the Kyoto Encyclopedia of Genes and Genomes (KEGG) database. Genes
from the carcinogenesis module were applied to the Database for
Annotation, Visualization, and Integrated Discovery (DAVID) in
order to investigate the biochemical processes and pathways that
may be involved in the occurrence and development of the
carcinogenesis of PC. Significant categories were identified
according to the P-value: The threshold of P<0.05 and a minimum
number of genes for the corresponding term >2 were considered
significant for a category.
miRNA-mRNA network analysis and
protein-protein interaction (PPI) network and sub-network
analysis
Since DEMs and significant mRNAs involved in the
carcinogenesis of PC were identified in the present study, and
considering that miRNAs seldom accomplish their functions
independently, it was important to identify the interactions of
these miRNAs and proteins by researching larger functional groups
of miRNAs and proteins (24). The
interactions between DEMs and their predicted screened targets were
visualized using the Cytoscape open source bioinformatics software
platform (18). miRWalk2.0
(25) was utilized to predict the
target genes of DEMs, and only the predicted targets obtained
simultaneously from miRWalk2.0, TargetScan6.2 (26), miRanda (27) and RNA22 (28) were selected for subsequent PPI
analysis. The STRING database was used to annotate functional
interactions between genes of the carcinogenesis module, and
visualization of the PPI network was also conducted using
Cytoscape, version 3.4.0, based on annotation information. A node
degree >4 was selected as the threshold.
Results
Integrated analysis of the 11 miRNA
expression datasets identified 14 DEMs, 11 of which give rise to
statistical significance in the validation test
In total, 64,376 records were identified from the
GEO and ArrayExpress databases, respectively. According to the
selection criteria, the majority of the preliminarily included
entries were eliminated on account of duplicated data,
inappropriate article type or inadequate information. Finally, a
total of 11 observational studies consisting of 719 cases were
retained for subsequent pooling calculation (E-TABM-664,
E-MTAB-753, GSE24279, GSE31568, GSE32678, GSE34052, GSE41369,
GSE43796, GSE53325, GSE59856, and GSE60978) (data not shown). The
study sample sizes ranged from 11 to 250. All the eligible
microarray datasets were shown to satisfy the MIAME (or minimum
information about a microarray experiment) principle (29). The selection workflow of all
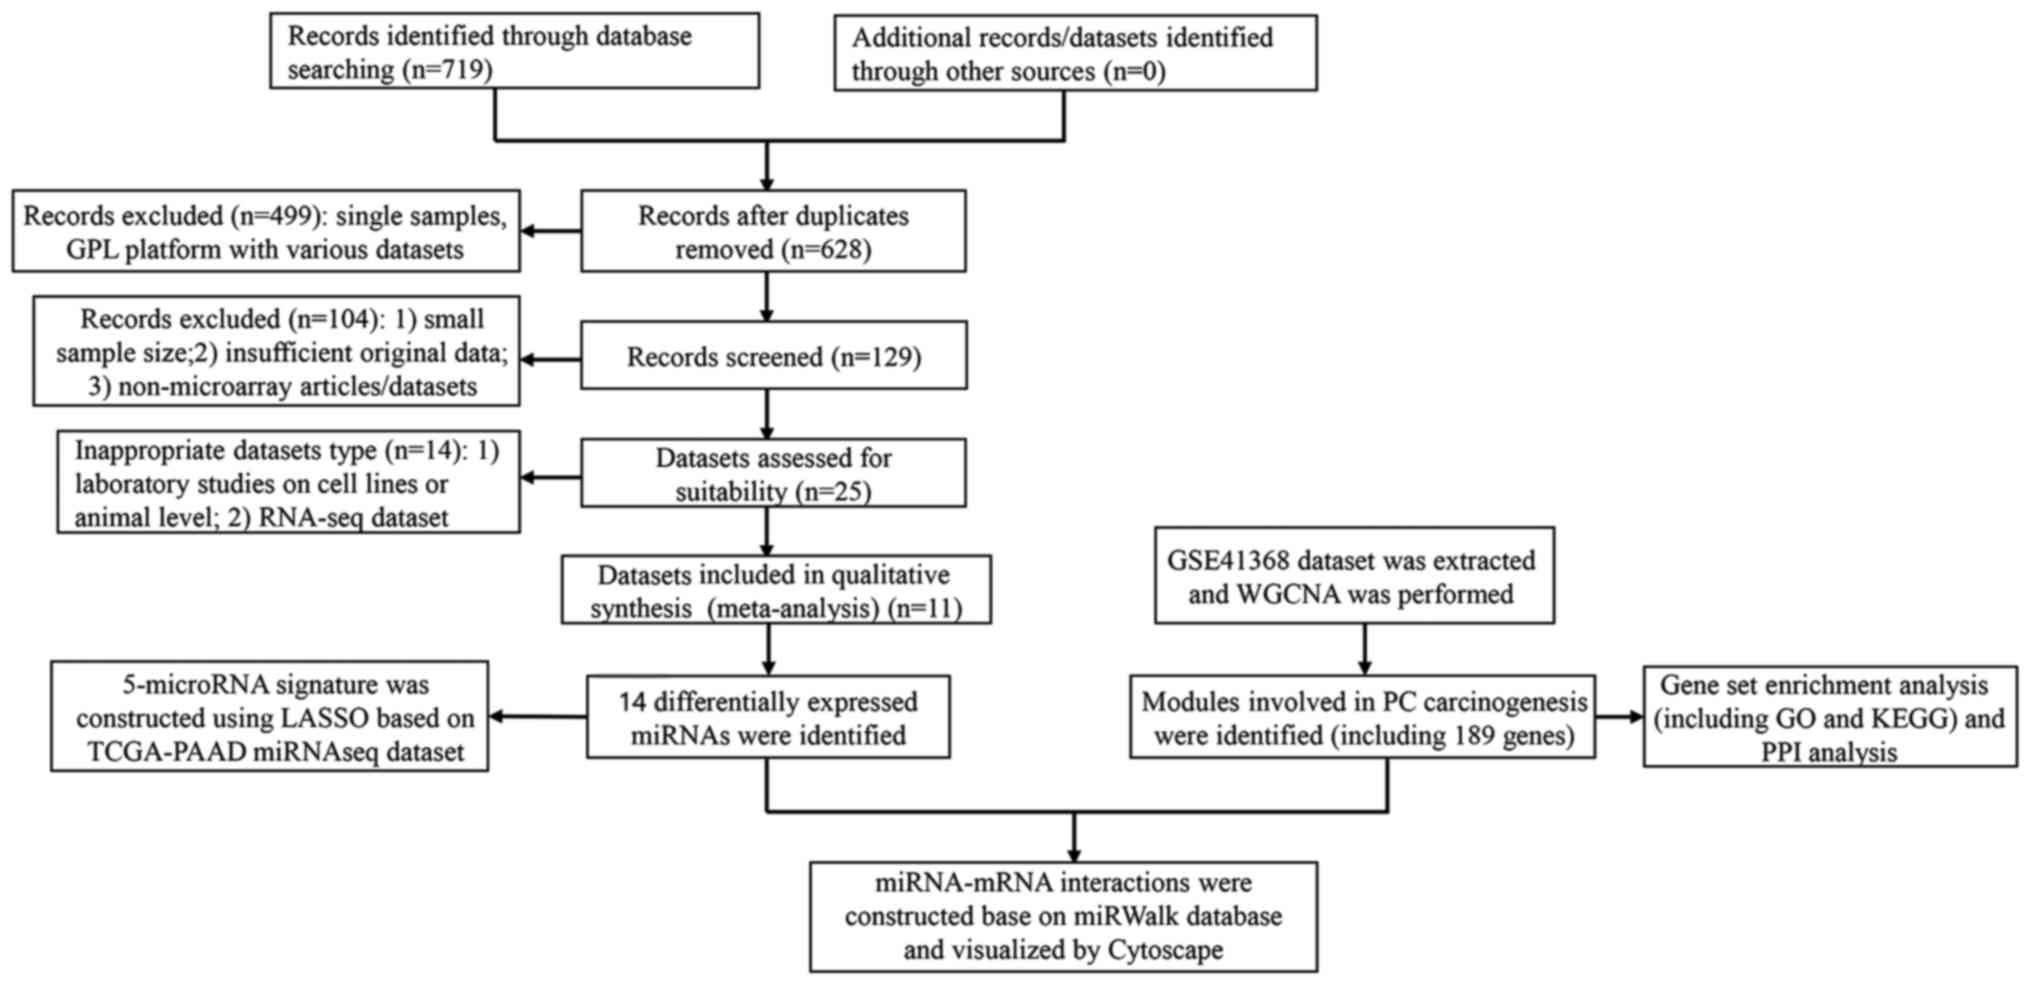
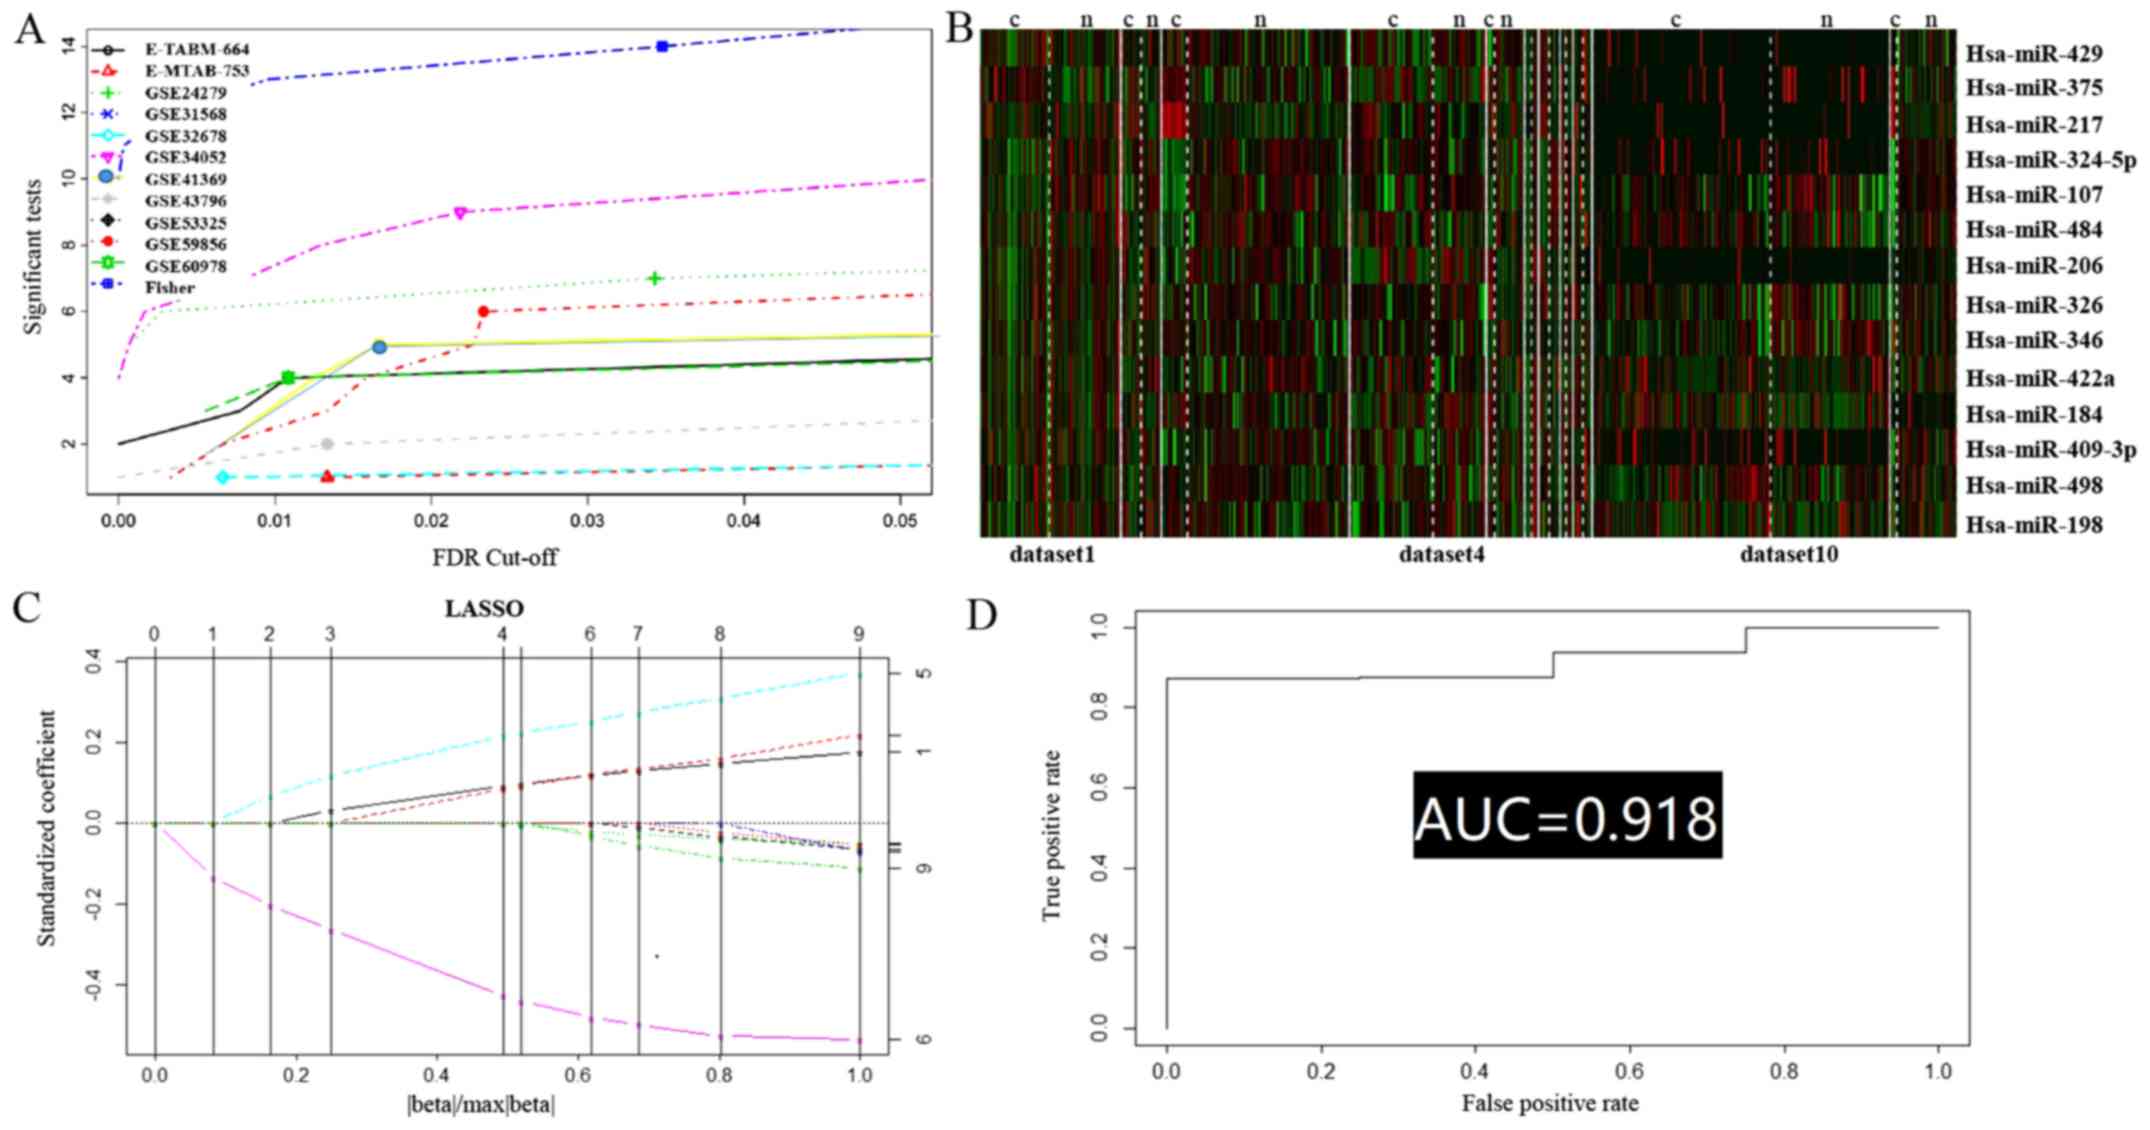
eligible studies in the present meta-analysis is shown in Fig. 1.
In the present meta-analysis, Fisher's method
summarizing the -log(P-value) across studies was applied to merge
the datasets, and 300 permutations were conducted to eliminate any
significant influence of the large number of samples; furthermore,
small expression intensities and small variation (i.e.,
non-informative) genes were filtered according to the mean and
standard deviation (10%). After having combined the effect size, a
total of 14 DEMs were identified (Table
I and Fig. 2A and B).
 | Table I.Integrated analysis of 11 miRNA
expression datasets that identified 14 significantly deregulated
miRNAs. |
Table I.
Integrated analysis of 11 miRNA
expression datasets that identified 14 significantly deregulated
miRNAs.
| miRNA | Fisher | P-value | FDR |
|---|
| hsa-miR-107 | 204.9924 | 1.00E-20 | 4.40E-20 |
| hsa-miR-375 | 243.8859 | 1.00E-20 | 4.40E-20 |
| hsa-miR-484 | 85.89779 | 1.00E-20 | 4.40E-20 |
| hsa-miR-324-5p | 153.3753 | 1.00E-20 | 4.40E-20 |
| hsa-miR-217 | 154.1077 | 1.00E-20 | 4.40E-20 |
| hsa-miR-429 | 60.76476 | 0.000303 | 0.000952 |
| hsa-miR-184 | 59.9386 | 0.000303 | 0.000952 |
| hsa-miR-422a | 55.78436 | 0.000568 | 0.001376 |
| hsa-miR-498 | 54.68656 | 0.000606 | 0.001481 |
| hsa-miR-409-3p | 54.95649 | 0.000606 | 0.001481 |
| hsa-miR-326 | 53.68486 | 0.000758 | 0.001667 |
| hsa-miR-206 | 50.65474 | 0.002424 | 0.004848 |
| hsa-miR-198 | 45.70564 | 0.008939 | 0.016389 |
| hsa-miR-346 | 40.49565 | 0.02803 | 0.047436 |
The 14 most deregulated DEMs from the integrated
microarray meta-analysis were analyzed by RT-qPCR. Of the 14 DEMs,
11 were revealed to be differentially expressed in PC compared with
the para-tumor controls (hsa-miR-107, hsa-miR-375, hsa-miR-484,
hsa-miR-324-5p, hsa-miR-217, hsa-miR-429, hsa-miR-498,
hsa-miR-409-3p, hsa-miR-326, hsa-miR-346, and hsa-miR-422a) (data
not shown).
Construction of the miRNA signature to
predict PC
The TCGA-PAAD miRNA sequence data were downloaded,
and the reads per kilobase per million mapped reads (RPKM)
expression matrix was extracted. The expression data of 8 out of 11
of the above DEMs were selected for the following regression
analysis, after the removal of miRNAs whose expression level
equaled 0 RPKM in any sample. Upon applying the LASSO regression
formula (Fig. 2C), the performance
of the 5 identified miRNAs in the PC classification was estimated
using ROC curve analysis. The combined miRNA panel using the LASSO
regression model provided a high classification accuracy of PC
[area under the curve (AUC)=0.918] (Fig. 2D); risk score=8.34e−6 ×
hsa.mir.429+6.69e−9 × hsa.mir.375-9.97e−7 ×
hsa.mir.217+7.43e−5 × hsa.mir.107-4.68e−4 ×
hsa.mir.484. hsa.mir.n=log2 (expression of
hsa.mir.n).
Clinical features of patients
associated with the risk score
The risk score was calculated based on the above
formula for each of the observations, and the ones whose risk
scores were greater than the median were assigned to the high-risk
group, whereas the others were assigned to the low-risk group. The
association between the clinical characteristics of the patients
and the risk score is shown in Table
II. In the present study, a higher risk score was associated
with male gender (P=0.00067) and dead vital status (P=0.022), which
was in agreement with the 5-miRNA signature diagnosis of PC;
however, age, history of alcohol consumption, anatomic site,
diabetes history, pancreatitis history and race did not reveal any
significance with the risk score.
| Table II.Relationship of the miRNA risk score
to clinical parameters in the pancreatic cancer patients. |
Table II.
Relationship of the miRNA risk score
to clinical parameters in the pancreatic cancer patients.
|
|
| miRNA score |
|
|---|
|
|
|
|
|
|---|
|
Characteristics | Total | High | Low | P-value |
|---|
| Age (years) | 178 |
|
| 0.098 |
| ≥65
(median) |
| 42 | 54 |
|
|
<65 |
| 47 | 35 |
|
| History of alcohol
consumption | 166 |
|
| 0.23 |
|
Yes |
| 54 | 48 |
|
| No |
| 27 | 37 |
|
| Anatomic site | 178 |
|
| 0.717 |
| Head of
pancreas |
| 71 | 68 |
|
|
Non-head |
| 18 | 21 |
|
| Race | 178 |
|
| 0.82 |
|
White |
| 77 | 79 |
|
|
Non-white |
| 12 | 10 |
|
| Sex | 177 |
|
| 0.00067 |
|
Male |
| 60 | 37 |
|
|
Female |
| 28 | 52 |
|
| History of
diabetes | 146 |
|
| 1 |
|
Yes |
| 18 | 19 |
|
| No |
| 55 | 54 |
|
| History of
pancreatitis | 142 |
|
| 1 |
|
Yes |
| 7 | 7 |
|
| No |
| 65 | 63 |
|
| Vital status | 177 |
|
| 0.022 |
|
Alive |
| 51 | 67 |
|
|
Dead |
| 37 | 22 |
|
Co-expression network construction and
identification of carcinogenesis modules
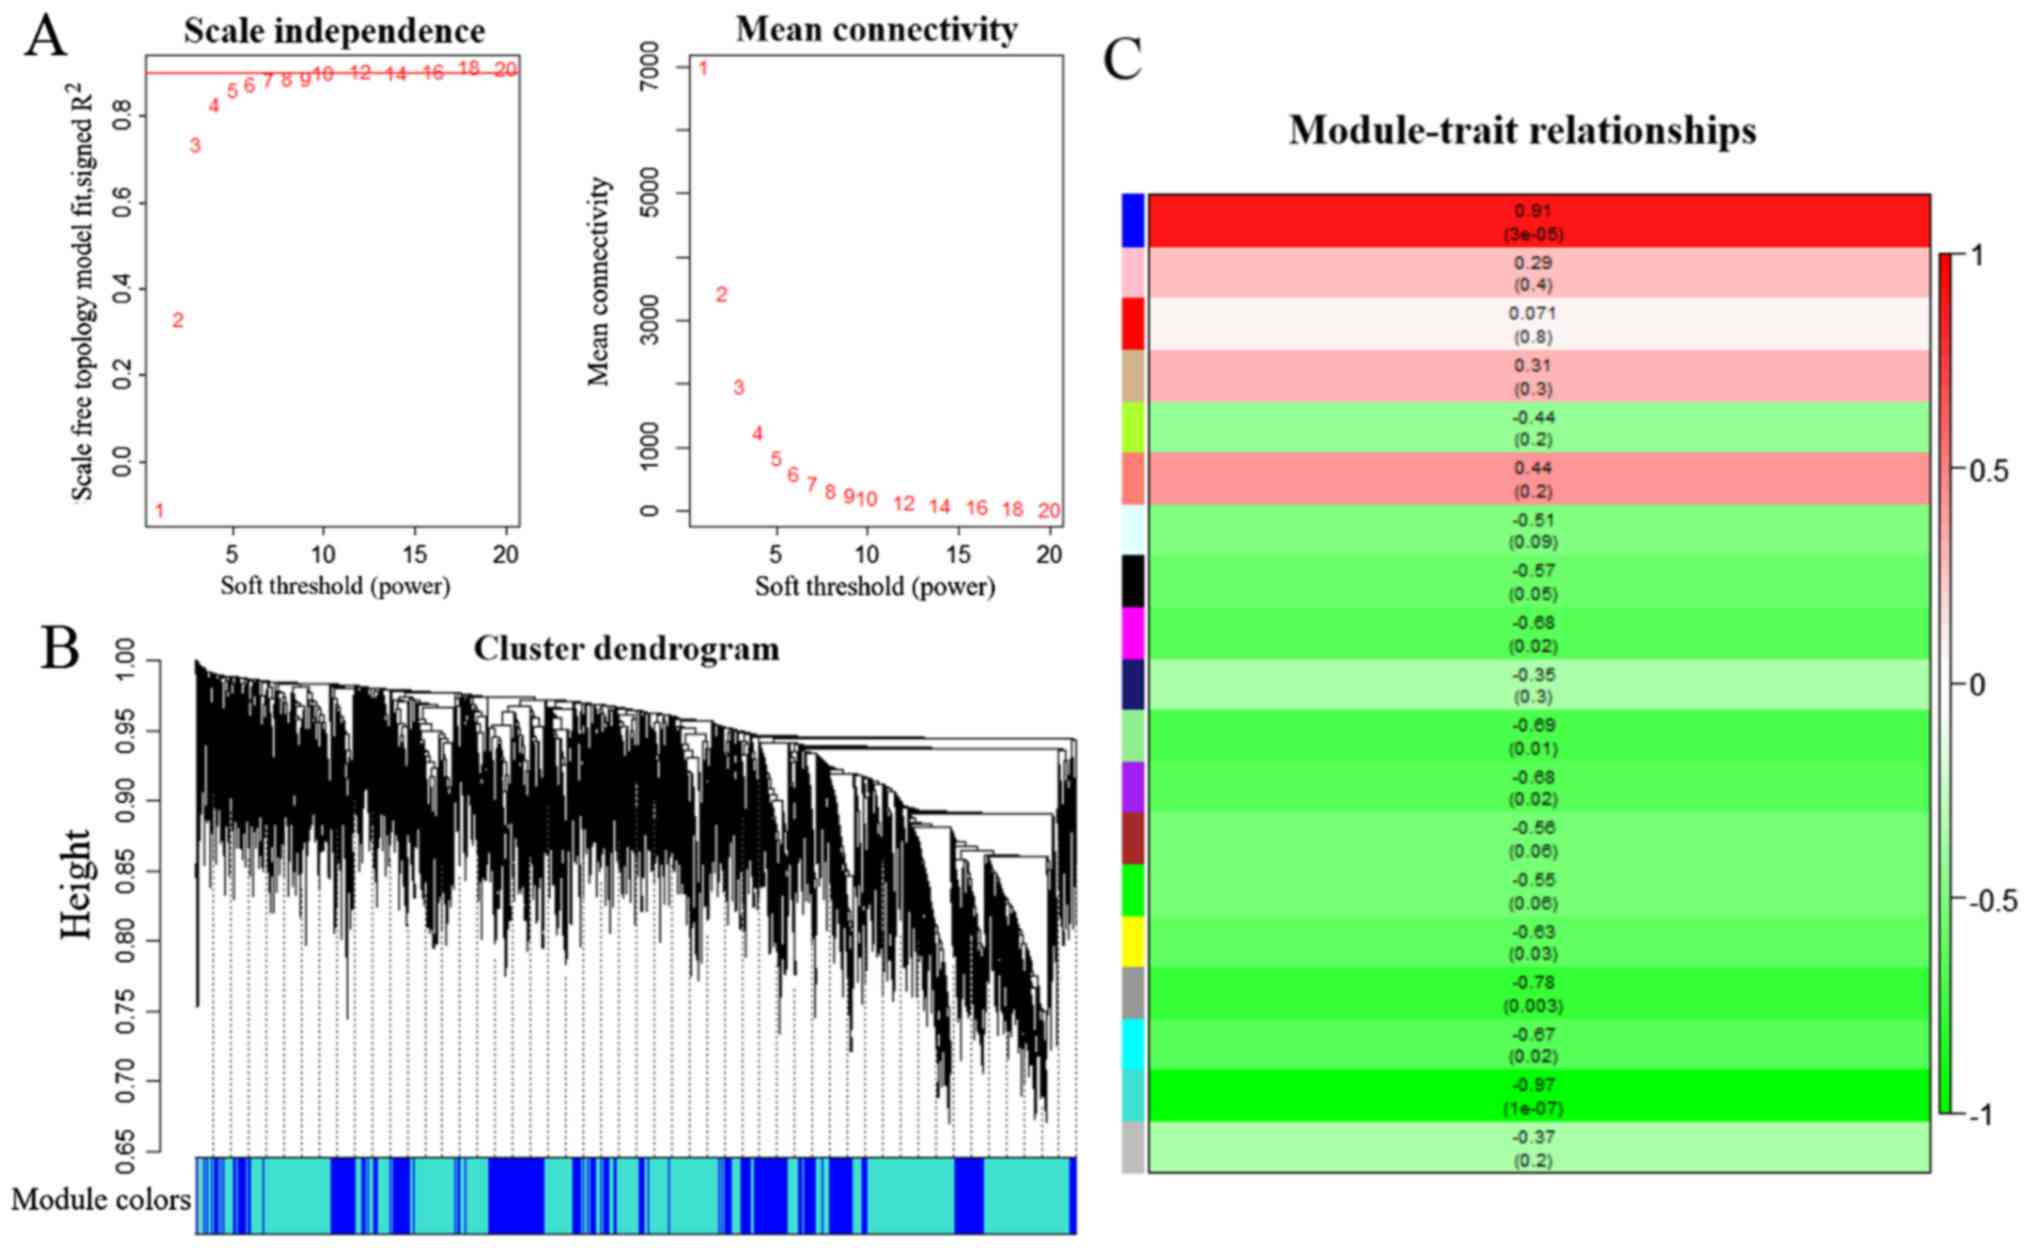
A total of 20,284 genes from the GSE41368 dataset
were included to construct co-expression networks via WGCNA, after
elimination of genes using the method described above in the
Materials and methods section. Following selection of the desired
samples, the connections between the genes in the gene network were
shown to be in line with a scale-free network distribution, where
the soft-threshold power β was set at 18 (Fig. 3A). The dynamic tree cut method
identified modules with similar expression profiles. After the
highly similar modules had been merged, a total of 18 co-expressed
modules were identified, ranging from 148 to 7,255 genes, whereas
the ‘gray’ module was reserved for genes that were not co-expressed
(Fig. 3B).
In this type of analysis, it is important to
identify modules that have the most significant associations with
carcinogenesis of PC. In the present study, the turquoise (189
genes) module yielded the most significant negative Pearson's
correlation coefficient (PCC) with the PC carcinogenesis (r=−0.97;
P=1e−07) (Fig. 3C).
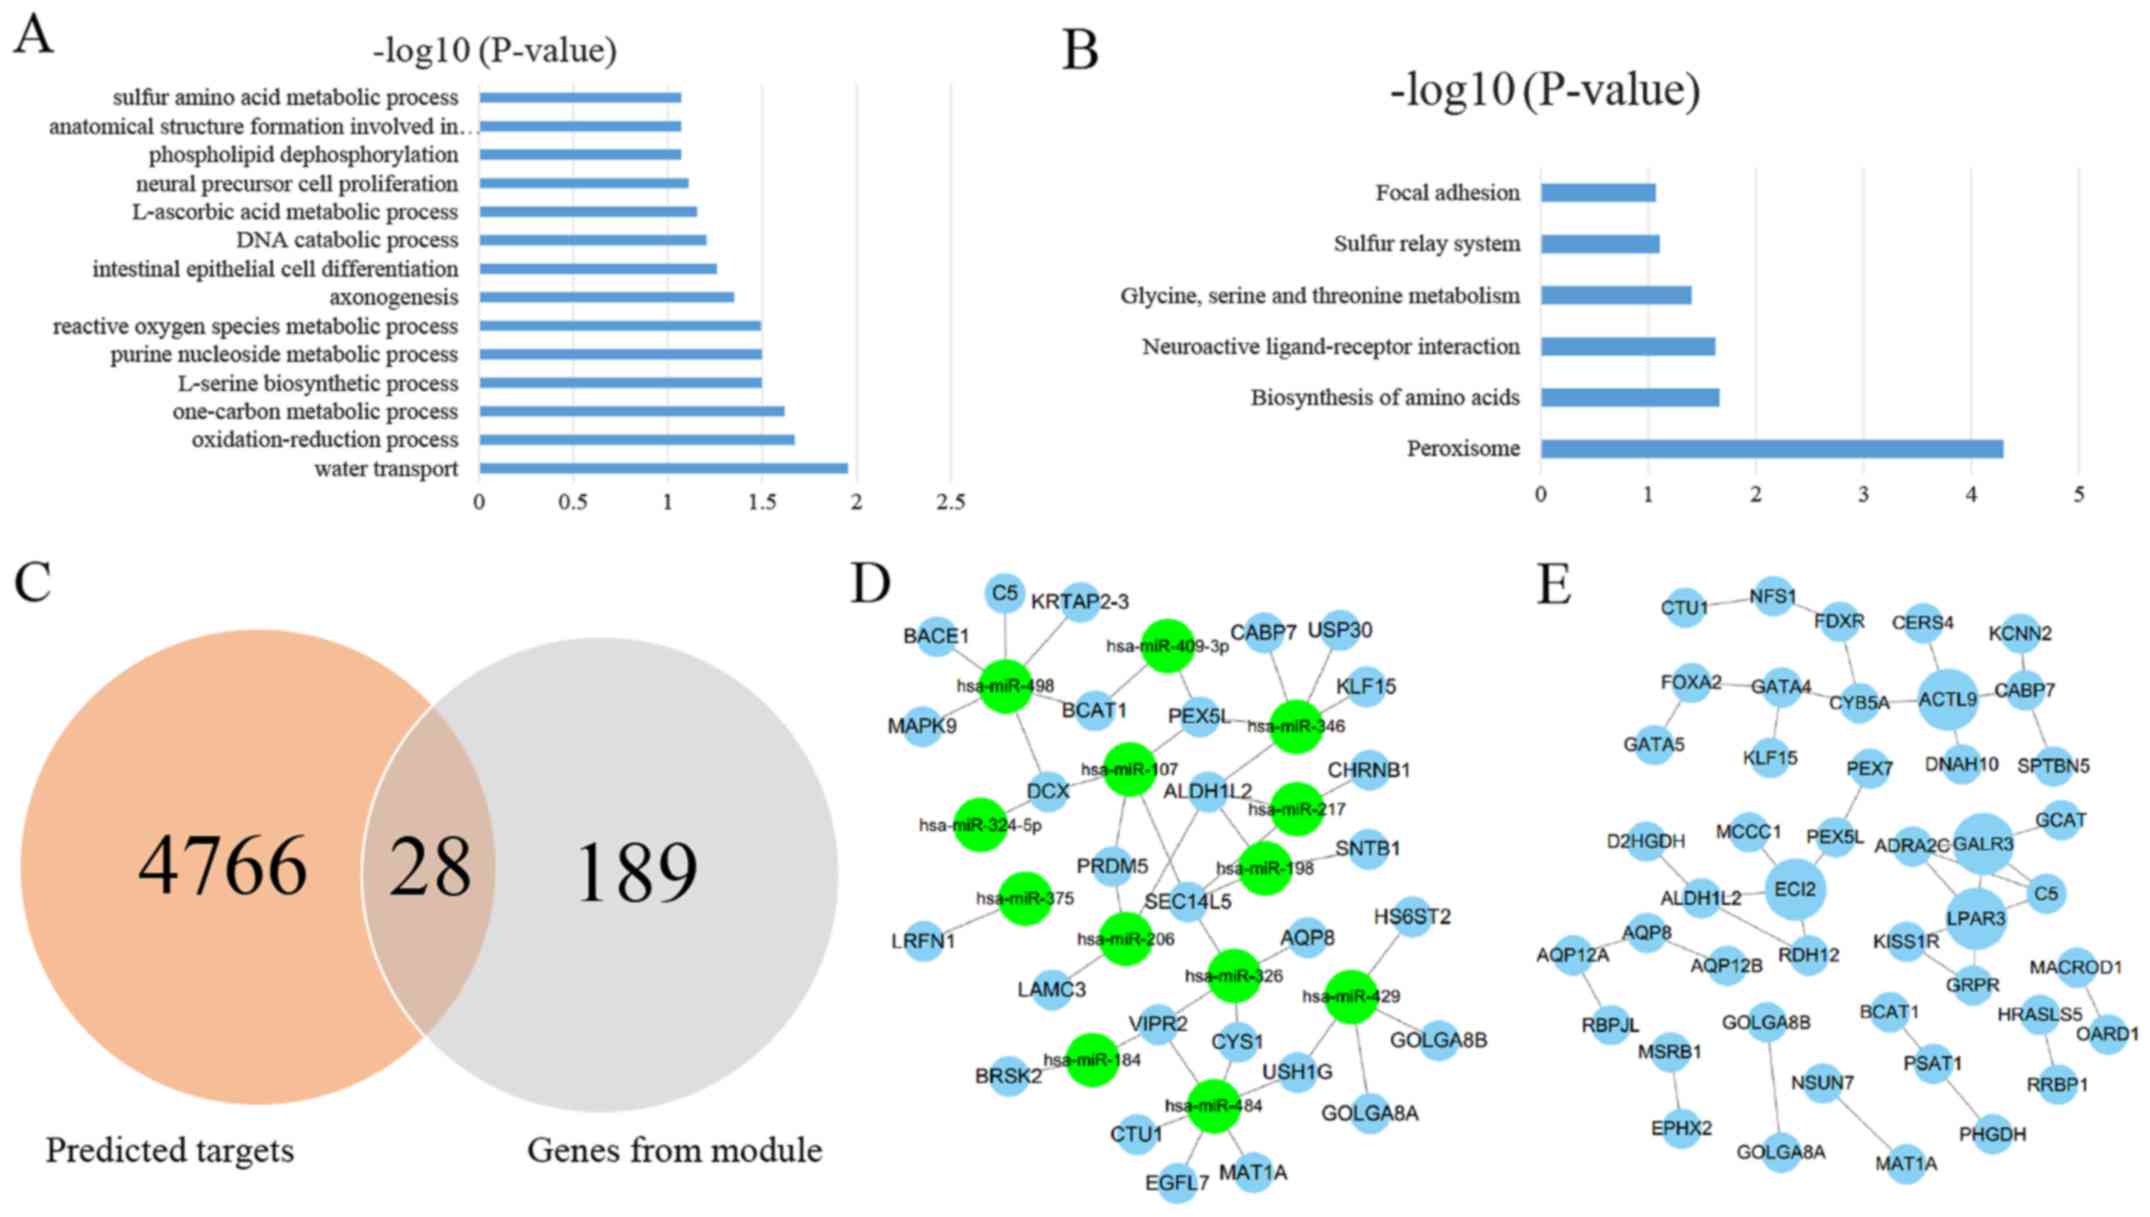
GO and KEGG analysis
A total of 189 genes from the turquoise module were
screened for GSEA. According to the GO analysis, 14 significant
enrichments of these top gene signatures were identified, which
belonged to the GO BP category. The most significant terms of BP
were ‘water transport’, ‘oxidation-reduction process’, and
‘one-carbon metabolic process’. All the GO terms of BP based on the
P-value are shown in Fig. 4A.
Pathway analysis based on the KEGG database revealed
that these genes were significantly enriched in 6 terms (Fig. 4B). The most significant terms of
KEGG were ‘peroxisome’, ‘biosynthesis of amino acids’, and
‘neuroactive ligand-receptor interaction’.
miRNA-mRNA and PPI network
analysis
A total of 4,766 genes were predicted by using the
above 4 algorithms based on the 14 screened DEMs. A total of 28
genes were held in common between those predicted targets and 189
screened genes (Fig. 4C).
Subsequently, 14 DEMs and 28 predicted screened targets containing
44 interactions were used to construct miRNA-mRNA networks
(Fig. 4D), indicating that those
miRNA-mRNA interactions may exert key roles in the carcinogenesis
of PC.
The STRING tool was used to obtain the PPI
associations of the 189 screened genes, and only interactions with
a combined score >0.4 were selected to construct networks
(Fig. 4E). According to the
annotation information from the STRING database, 4 hub genes were
identified: ACTL9 (actin-like 9), ECI2 (enoyl-CoA Δ-isomerase 2),
GALR3 (galanin receptor 3), and LPAR3 (lysophosphatidic acid
receptor 3).
Discussion
PC is a deadly type of cancer, and its occurrence
and mortality have been rising worldwide in recent years. The
etiology of PC is unclear due to conflicting evidence, although
smoking, obesity and over-consumption of fatty foods are considered
to be changeable risk factors (30,31);
other unchangeable risk factors include chronic pancreatitis and PC
family history (32,33). Understanding the molecular mechanism
of PC is of critical importance for diagnosis and treatment.
Numerous studies have defined, in part, the microRNA signatures
that distinguish patients with PC from normal patients (34), and many microRNAs fulfill their role
in PC carcinogenesis by binding to the 3′-UTR of mRNA sequences
(35). In the present study, 11
miRNA microarray datasets were integrated to screen for significant
DEMs, and the GSE41368 expression matrix was subjected to WGCNA in
parallel to identify hub modules associated with carcinogenesis.
Subsequently, miRNA-mRNA and PPI interactions were constructed to
clarify the possible mechanism of PC carcinogenesis, thereby
indicating a possible direction for future clinical research.
High-throughput microarray technology has become a
popular tool for performing large-scale comparative analyses of
gene expression profiles. With the accumulation of bioinformatic
data, combining information from numerous similar, already existing
studies can improve the reliability and generalizability of
results. However, direct combination among heterogeneous datasets
is not possible due to the complicated experimental variables
embedded in array experiments. Therefore, it is necessary to choose
a suitable meta-analysis technique in order to reach convincing
conclusions. In the present study, Fisher's inverse Chi-square
method based on the MetaDE package was applied to combine the
P-values from independent datasets, which is regarded as the most
comprehensive approach for meta-analysis of two-class gene
expression microarrays (29). As a
result, 14 significant DEMs were identified on the condition that
P<0.01 and FDR<0.01. Subsequently, clinical samples were
collected to perform validation tests, whereupon the majority (11
out of 14) of the DEMs yielded statistically significant results, a
finding that was in conformity with our expectation that more
reliable results tend to be obtained from integrated
meta-analyses.
Increasing evidence has shown that certain miRNAs
have critical roles in PC development, and may therefore have
potential clinical value in diagnosis, treatment and prognosis
evaluation for PC carcinogenesis (36,37).
Therefore, TCGA-PAAD miRNA datasets were applied to construct a
LASSO regressive model for PC prediction. The LASSO algorithm has
numerous advantages compared with ordinary linear regression
(38). A linear combination of 5
miRNAs was validated as an independent predictor for PC
carcinogenesis. This signature demonstrated significant diagnostic
performance not only in vital status, but also in gender
discrimination. The 5-miRNA signature permitted an early diagnosis
to be made and precautionary measures in time to be taken, which
could prevent further deterioration of the PC. Furthermore, each of
the 5 DEMs have been previously reported to serve roles in
carcinogenesis (39–42). The results of the present study have
helped to corroborate the potential role for miRNAs in the
molecular pathogenesis and clinical progression of PC, thereby
highlighting the potential of miRNA profiling to improve clinical
diagnosis in patients with PC.
Since neither miRNAs nor genes are able to mediate
the development of PC independently, it is necessary to identify
comprehensive miRNA-mRNA interactions that potentially mediate the
pathogenesis of PC. The majority of the studies published
previously have solely focused on miRNAs and/or genes to clarify
the mechanism of carcinogenesis; only a few of them have identified
either DEMs or DEGs independently via a high-throughput method
(43,44). Few studies have combined the miRNA
expression profiles with those pertaining to mRNAs to explore the
potential mechanism. Therefore, the present study was performed to
comprehensively identify the most likely miRNA-mRNA interactions,
and to elucidate their complex regulatory networks. One notable
feature that distinguished the present study from similarly
performed studies is that WGCNA was chosen rather than SAM
(45) to identify the genes that
were most closely associated with PC carcinogenesis, for WGCNA
includes not only DEGs, but also those genes that are not
significantly differentially expressed, but still have a key role
in carcinogenesis.
In the present study, a total of 44 miRNA-mRNA pairs
containing 14 dysregulated miRNAs and their 28 target mRNAs were
identified. Among the 14 DEMs and 4 hub genes, it was demonstrated
that miR-429 is associated with a poor outcome and inhibits
pancreatic ductal adenocarcinoma growth by targeting the
serine/threonine-protein kinase, TANK-binding kinase 1 (TBK1)
(39). Yang et al observed
that deregulation of miR-375 inhibited cancer proliferation
migration and chemosensitivity in PC through an association with
homeobox B3 (HOXB3) (40).
Similarly, chronic pancreatitis and PC were found to demonstrate an
active epithelial-mesenchymal transition profile that is regulated
by the miR-217-sirtuin 1 pathway (41), and epigenetic silencing of miR-107
was found to regulate cyclin-dependent kinase 6 expression in PC
(42). In addition, active
Yes-associated protein (YAP) promoted PC cell motility, invasion
and tumorigenesis in a mitotic phosphorylation-dependent manner
through LPAR3 (46). Unexpectedly,
no gene interactions have been confirmed up to this point. Whether
those interactions serve a common role remains unclear, and further
experimental validation is required to determine their role in PC
carcinogenesis. With the exception of LPAR3, the three other hub
genes (ACTL9, ECI2, and GALR3) have been comparatively less well
studied in medical science in general, let alone in the oncology
field. Exploring gene signatures to predict PC therefore will
require further effort.
To the best of our knowledge, differently from other
studies, this is the first one performed to date that has utilized
the MetaDE package and WGCNA simultaneously to construct miRNA-mRNA
interactions to clarify the mechanism of carcinogenesis of PC. The
MetaDE package enables the combination of multiple datasets, rather
than a single dataset. Similarly, WGCNA takes into consideration
all the genes that may exert roles in pathogenesis. More credible
results are available with the use of these two tools. However,
apart from the promising results thus obtained, limitations with
this method do exist, and future applications should be considered.
First, only one TCGA-PAAD miRNA sequence dataset and one gene
dataset (GSE41368) were enrolled in the present study, which meant
that our sample size and sample type were not sufficient to draw
entirely reliable conclusions, even though WGCNA was performed.
Secondly, other types of molecule, including long non-coding RNAs
(lncRNAs) and small interfering RNAs (siRNAs), were not included,
which would have enabled a more comprehensive coverage to elucidate
the mechanism of PC development. Nevertheless, there were still a
number of useful advantages associated with the present
comprehensive bioinformatic analysis. The major importance of this
study is that it not only provided novel directions for clinical
research, but it also provided a way to study the problem itself in
clinical practice.
In conclusion, pooled analysis of PC miRNA raw
microarrays was performed, and a 5-miRNA signature according to the
TCGA-PAAD dataset was identified to predict the occurrence of PC
against non-tumor tissue. Furthermore, 44 miRNA-mRNA interactions
based on 14 DEMs and 28 tumor-associated genes were constructed to
illustrate the potential mechanism of PC carcinogenesis. In
addition, 14 GO functions and 6 KEGG pathways were significantly
enriched, based on 189 tumor-associated genes. Further large-scale,
well-designed and multi-center research studies should be conducted
to confirm these findings prior to the application of any
predictions, as well as elucidation of the carcinogenesis mechanism
of PC.
Acknowledgements
We sincerely appreciate what our team members have
accomplished for these experiments and the accomplishment is the
fruit of great effort. The information integrated into this section
is correct.
Funding
The present study was supported by grants from the
National Key Basic Research Program of China (no. 2015CB5540007),
the National Natural Science Foundation of China (nos. 81472740,
81101825, 81572413, 81600401 and 81702397), and the Hubei
Provincial Natural Science Foundation of China (no.
2017CFB474).
Availability of data and materials
The analyzed datasets generated during the study are
available from the corresponding author on reasonable request.
Authors' contributions
Conceptualization of the study was undertaken by XM,
RT and LL. Data collection was performed by JB and XS. Formal
analysis of the data was accomplished by XM and HC. Funding
acquisition was conducted by CW and KT. Investigation of the study
design was undertaken by XM and RT. Research methodology was
designed by XM and LL. Project administration was carried out by
KT. Software and analysis was undertaken by XM, RT and ZL.
Supervision was undertaken by HC, JB, XS, ZL and CW. Visual images
were designed by XM, and XM wrote the original draft of the
manuscript. Further review and editing were carried out by JB, XS,
CW and KT. All authors read and approved the manuscript and agree
to be accountable for all aspects of the research in ensuring that
the accuracy or integrity of any part of the work are appropriately
investigated and resolved.
Ethics approval and consent to
participate
This study was approved by the Ethics Committee of
Union Hospital, Tongji Medical College, Huazhong University of
Science and Technology in compliance with the Helsinki Declaration
of 1964 and later versions. Written informed consent was obtained
from all the patients prior to their inclusion in the study. This
article does not contain any animal studies performed by any of the
authors.
Patient consent for publication
Not applicable.
Competing interests
The authors declare that there are no competing
interests.
References
|
1
|
Jemal A, Siegel R, Ward E, Murray T, Xu J
and Thun MJ: Cancer statistics, 2007. CA Cancer J Clin. 57:43–66.
2007. View Article : Google Scholar : PubMed/NCBI
|
|
2
|
Simianu VV, Zyromski NJ, Nakeeb A and
Lillemoe KD: Pancreatic cancer: Progress made. Acta Oncol.
49:407–417. 2010. View Article : Google Scholar : PubMed/NCBI
|
|
3
|
Hartwig W, Werner J, Jäger D, Debus J and
Büchler MW: Improvement of surgical results for pancreatic cancer.
Lancet Oncol. 14:e476–e485. 2013. View Article : Google Scholar : PubMed/NCBI
|
|
4
|
Costello E, Greenhalf W and Neoptolemos
JP: New biomarkers and targets in pancreatic cancer and their
application to treatment. Nat Rev Gastroenterol Hepatol. 9:435–444.
2012. View Article : Google Scholar : PubMed/NCBI
|
|
5
|
Du Y, Liu M, Gao J and Li Z: Aberrant
microRNAs expression patterns in pancreatic cancer and their
clinical translation. Cancer Biother Radiopharm. 28:361–369. 2013.
View Article : Google Scholar : PubMed/NCBI
|
|
6
|
Gregory RI, Chendrimada TP, Cooch N and
Shiekhattar R: Human RISC couples microRNA biogenesis and
posttranscriptional gene silencing. Cell. 123:631–640. 2005.
View Article : Google Scholar : PubMed/NCBI
|
|
7
|
Yates LA, Norbury CJ and Gilbert RJ: The
long and short of microRNA. Cell. 153:516–519. 2013. View Article : Google Scholar : PubMed/NCBI
|
|
8
|
Baer C, Claus R and Plass C: Genome-wide
epigenetic regulation of miRNAs in cancer. Cancer Res. 73:473–477.
2013. View Article : Google Scholar : PubMed/NCBI
|
|
9
|
Singh R and Mo YY: Role of microRNAs in
breast cancer. Cancer Biol Ther. 14:201–212. 2013. View Article : Google Scholar : PubMed/NCBI
|
|
10
|
Song S and Ajani JA: The role of microRNAs
in cancers of the upper gastrointestinal tract. Nat Rev
Gastroenterol Hepatol. 10:109–118. 2013. View Article : Google Scholar : PubMed/NCBI
|
|
11
|
Bustin SA and Dorudi S: Gene expression
profiling for molecular staging and prognosis prediction in
colorectal cancer. Expert Rev Mol Diagn. 4:599–607. 2004.
View Article : Google Scholar : PubMed/NCBI
|
|
12
|
Kulasingam V and Diamandis EP: Strategies
for discovering novel cancer biomarkers through utilization of
emerging technologies. Nat Clin Pract Oncol. 5:588–599. 2008.
View Article : Google Scholar : PubMed/NCBI
|
|
13
|
Nannini M, Pantaleo MA, Maleddu A, Astolfi
A, Formica S and Biasco G: Gene expression profiling in colorectal
cancer using microarray technologies: Results and perspectives.
Cancer Treat Rev. 35:201–209. 2009. View Article : Google Scholar : PubMed/NCBI
|
|
14
|
Lascorz J, Hemminki K and Försti A:
Systematic enrichment analysis of gene expression profiling studies
identifies consensus pathways implicated in colorectal cancer
development. J Carcinog. 10:72011. View Article : Google Scholar : PubMed/NCBI
|
|
15
|
Lu Y, Zhou Y, Qu W, Deng M and Zhang C: A
Lasso regression model for the construction of microRNA-target
regulatory networks. Bioinformatics. 27:2406–2413. 2011. View Article : Google Scholar : PubMed/NCBI
|
|
16
|
Langfelder P and Horvath S: WGC NA An R
package for weighted correlation network analysis. BMC
Bioinformatics. 9:5592008. View Article : Google Scholar : PubMed/NCBI
|
|
17
|
Franceschini A, Szklarczyk D, Frankild S,
Kuhn M, Simonovic M, Roth A, Lin J, Minguez P, Bork P, von Mering C
and Jensen LJ: STRING v9.1: Protein-protein interaction networks,
with increased coverage and integration. Nucleic Acids Res.
41:D808–D815. 2013. View Article : Google Scholar : PubMed/NCBI
|
|
18
|
Smoot ME, Ono K, Ruscheinski J, Wang PL
and Ideker T: Cytoscape 2.8: New features for data integration and
network visualization. Bioinformatics. 27:431–432. 2011. View Article : Google Scholar : PubMed/NCBI
|
|
19
|
Davis S and Meltzer PS: GE Oquery A bridge
between the Gene Expression Omnibus (GEO) and BioConductor.
Bioinformatics. 23:1846–1847. 2007. View Article : Google Scholar : PubMed/NCBI
|
|
20
|
Diboun I, Wernisch L, Orengo CA and
Koltzenburg M: Microarray analysis after RNA amplification can
detect pronounced differences in gene expression using limma. BMC
Genomics. 7:2522006. View Article : Google Scholar : PubMed/NCBI
|
|
21
|
Haunsberger SJ, Connolly NM and Prehn JH:
miRNAmeConverter: An R/bioconductor package for translating mature
miRNA names to different miRBase versions. Bioinformatics.
33:592–593. 2017.PubMed/NCBI
|
|
22
|
Livak KJ and Schmittgen TD: Analysis of
relative gene expression data using real-time quantitative PCR and
the 2(-Delta Delta C(T)) method. Methods. 25:402–408. 2001.
View Article : Google Scholar : PubMed/NCBI
|
|
23
|
Colaprico A, Silva TC, Olsen C, Garofano
L, Cava C, Garolini D, Sabedot TS, Malta TM, Pagnotta SM,
Castiglioni I, et al: TCGAbiolinks: An R/Bioconductor package for
integrative analysis of TCGA data. Nucleic Acids Res. 44:e712016.
View Article : Google Scholar : PubMed/NCBI
|
|
24
|
Srihari S and Leong HW: Temporal dynamics
of protein complexes in PPI networks: A case study using yeast cell
cycle dynamics. BMC Bioinformatics. 13((Suppl 17)):
S162012.PubMed/NCBI
|
|
25
|
Dweep H, Gretz N and Sticht C: miRWalk
database for miRNA-target interactions. Methods Mol Biol.
1182:289–305. 2014. View Article : Google Scholar : PubMed/NCBI
|
|
26
|
Friedman RC, Farh KK, Burge CB and Bartel
DP: Most mammalian mRNAs are conserved targets of microRNAs. Genome
Res. 19:92–105. 2009. View Article : Google Scholar : PubMed/NCBI
|
|
27
|
Betel D, Koppal A, Agius P, Sander C and
Leslie C: Comprehensive modeling of microRNA targets predicts
functional non-conserved and non-canonical sites. Genome Biol.
11:R902010. View Article : Google Scholar : PubMed/NCBI
|
|
28
|
Kertesz M, Iovino N, Unnerstall U, Gaul U
and Segal E: The role of site accessibility in microRNA target
recognition. Nat Genet. 39:1278–1284. 2007. View Article : Google Scholar : PubMed/NCBI
|
|
29
|
Ramasamy A, Mondry A, Holmes CC and Altman
DG: Key issues in conducting a meta-analysis of gene expression
microarray datasets. PLoS Med. 5:e1842008. View Article : Google Scholar : PubMed/NCBI
|
|
30
|
Yuan C, Morales-Oyarvide V, Babic A, Clish
CB, Kraft P, Bao Y, Qian ZR, Rubinson DA, Ng K, Giovannucci EL, et
al: Cigarette smoking and pancreatic cancer survival. J Clin Oncol.
35:1822–1828. 2017. View Article : Google Scholar : PubMed/NCBI
|
|
31
|
Carreras-Torres R, Johansson M, Gaborieau
V, Haycock PC, Wade KH, Relton CL, Martin RM, Davey Smith G and
Brennan P: The role of obesity, type 2 diabetes, and metabolic
factors in pancreatic cancer: A mendelian randomization study. J
Natl Cancer Inst. 109:92017. View Article : Google Scholar
|
|
32
|
Guerra C, Collado M, Navas C, Schuhmacher
AJ, Hernández-Porras I, Cañamero M, Rodriguez-Justo M, Serrano M
and Barbacid M: Pancreatitis-induced inflammation contributes to
pancreatic cancer by inhibiting oncogene-induced senescence. Cancer
Cell. 19:728–739. 2011. View Article : Google Scholar : PubMed/NCBI
|
|
33
|
Molina-Montes E, Gomez-Rubio P, Márquez M,
Rava M, Löhr M, Michalski CW, Molero X, Farré A, Perea J, Greenhalf
W, et al: Risk of pancreatic cancer associated with family history
of cancer and other medical conditions by accounting for smoking
among relatives. Int J Epidemiol. 47:473–483. 2018. View Article : Google Scholar : PubMed/NCBI
|
|
34
|
Tanday S: Biomarkers in blood could help
to detect pancreatic cancer. Lancet Oncol. 15:e1082014. View Article : Google Scholar : PubMed/NCBI
|
|
35
|
Li L, Li Z, Kong X, Xie D, Jia Z, Jiang W,
Cui J, Du Y, Wei D, Huang S and Xie K: Down-regulation of
microRNA-494 via loss of SMAD4 increases FOXM1 and β-catenin
signaling in pancreatic ductal adenocarcinoma cells.
Gastroenterology. 147:485–497.e18. 2014. View Article : Google Scholar : PubMed/NCBI
|
|
36
|
Liu R, Chen X, Du Y, Yao W, Shen L, Wang
C, Hu Z, Zhuang R, Ning G, Zhang C, et al: Serum microRNA
expression profile as a biomarker in the diagnosis and prognosis of
pancreatic cancer. Clin Chem. 58:610–618. 2012. View Article : Google Scholar : PubMed/NCBI
|
|
37
|
Schultz NA, Werner J, Willenbrock H,
Roslind A, Giese N, Horn T, Wøjdemann M and Johansen JS: MicroRNA
expression profiles associated with pancreatic adenocarcinoma and
ampullary adenocarcinoma. Mod Pathol. 25:1609–1622. 2012.
View Article : Google Scholar : PubMed/NCBI
|
|
38
|
Avalos M, Pouyes H, Grandvalet Y, Orriols
L and Lagarde E: Sparse conditional logistic regression for
analyzing large-scale matched data from epidemiological studies: A
simple algorithm. BMC Bioinformatics. 16((Suppl 6)): S12015.
View Article : Google Scholar : PubMed/NCBI
|
|
39
|
Song B, Zheng K, Ma H, Liu A, Jing W, Shao
C, Li G and Jin G: miR-429 determines poor outcome and inhibits
pancreatic ductal adenocarcinoma growth by targeting TBK1. Cell
Physiol Biochem. 35:1846–1856. 2015. View Article : Google Scholar : PubMed/NCBI
|
|
40
|
Yang D, Yan R and Zhang X, Zhu Z, Wang C,
Liang C and Zhang X: Deregulation of MicroRNA-375 inhibits cancer
proliferation migration and chemosensitivity in pancreatic cancer
through the association of HOXB3. Am J Transl Res. 8:1551–1559.
2016.PubMed/NCBI
|
|
41
|
Deng S, Zhu S, Wang B, Li X, Liu Y, Qin Q,
Gong Q, Niu Y, Xiang C, Chen J, et al: Chronic pancreatitis and
pancreatic cancer demonstrate active epithelial-mesenchymal
transition profile, regulated by miR-217-SIRT1 pathway. Cancer
Lett. 355:184–191. 2014. View Article : Google Scholar : PubMed/NCBI
|
|
42
|
Lee KH, Lotterman C, Karikari C, Omura N,
Feldmann G, Habbe N, Goggins MG, Mendell JT and Maitra A:
Epigenetic silencing of MicroRNA miR-107 regulates cyclin-dependent
kinase 6 expression in pancreatic cancer. Pancreatology. 9:293–301.
2009. View Article : Google Scholar : PubMed/NCBI
|
|
43
|
Mao Y, Shen J, Lu Y, Lin K, Wang H, Li Y,
Chang P, Walker MG and Li D: RNA sequencing analyses reveal novel
differentially expressed genes and pathways in pancreatic cancer.
Oncotarget. 8:42537–42547. 2017. View Article : Google Scholar : PubMed/NCBI
|
|
44
|
Bloomston M, Frankel WL, Petrocca F,
Volinia S, Alder H, Hagan JP, Liu CG, Bhatt D, Taccioli C and Croce
CM: MicroRNA expression patterns to differentiate pancreatic
adenocarcinoma from normal pancreas and chronic pancreatitis. JAMA.
297:1901–1908. 2007. View Article : Google Scholar : PubMed/NCBI
|
|
45
|
Lin D, Shkedy Z, Burzykowski T, Ion R,
Göhlmann HW, Bondt AD, Perer T, Geerts T, Van den Wyngaert I and
Bijnens L: An investigation on performance of Significance Analysis
of Microarray (SAM) for the comparisons of several treatments with
one control in the presence of small-variance genes. Biom J.
50:801–823. 2008. View Article : Google Scholar : PubMed/NCBI
|
|
46
|
Yang S, Zhang L, Purohit V, Shukla SK,
Chen X, Yu F, Fu K, Chen Y, Solheim J, Singh PK, et al: Active YAP
promotes pancreatic cancer cell motility, invasion and
tumorigenesis in a mitotic phosphorylation-dependent manner through
LPAR3. Oncotarget. 6:36019–36031. 2015. View Article : Google Scholar : PubMed/NCBI
|