Introduction
Bladder cancer is the tenth most commonly diagnosed
carcinoma, with an estimated 549,000 new cases and 200,000 deaths
reported globally in 2018 (1).
Approximately 75% newly diagnosed cases present with disease
confined to the mucosa, namely non-muscle invasive bladder cancer
(NMIBC), with a favorable long-term survival but a higher relapse
rate after transurethral resection of bladder tumor (TURBT) and
intravesical therapy. However, 10–15% of patients with NMIBC still
suffer from disease progression to the deadlier muscle invasive
bladder cancer (MIBC), the 5-year survival of which is often
<50% (2–4). The undesirable outcome of bladder
cancer is partly due to inadequate knowledge of the biological
mechanisms of disease recurrence and progression. Thus,
identification and development of novel molecular biomarkers based
on genomic profiling are needed for predicting disease progression
and improving prognosis of patients diagnosed as bladder cancer at
a very early stage.
Rapidly emerging high-throughput sequencing
technology has revealed genomic profiling and epigenetic
alternations of diseases, which have provided significant insight
into the molecular characteristics of various human cancers. Since
the progressive accumulation of epigenetic variations can drive the
tumorigenesis and development of bladder cancer, a genetic
disorder, a series of array-based gene signatures has been
established to better predict the risk of recurrence and
progression and distinguish the prognosis of patients with bladder
cancer beyond clinicopathologic parameters (5–7).
However, few studies have focused on disease progression and
prognosis of patients with NMIBC simultaneously. Establishing
related gene markers is of great significance for clinical
decision-makers in diagnosis and treatment selection.
In the present study, we aimed to explore and
establish a multigene signature for predicting the risk of muscle
invasion and survival prognosis in patients with bladder cancer by
analyzing the transcriptome profiles using the Gene Expression
Omnibus (GEO) data. A robust 13-mRNA signature was constructed with
the use of univariate Cox regression analysis and the Least
Absolute Shrinkage and Selection Operator logistic regression
method (LASSO). The diagnostic and prognostic value of this
mRNA-based risk score model was further validated using an
independent microarray of GEO as well as The Cancer Genome Atlas
(TCGA) cohort. In addition, to better assess its clinical
significance, we also constructed a predictive nomogram with other
clinicopathologic factors and compared the performance between the
13-gene model and other published biomarkers regarding prediction
of progression to MIBC. Gene set enrichment analysis (GSEA) was
later performed to identify underlying biological functions and
molecular mechanisms associated with the occurrence and development
of bladder cancer. Finally, hub genes identified from the
co-expression network of the 13 genes were detected using
experimental reverse transcriptase-quantitative polymerase chain
reaction (RT-qPCR), and we found that CTHRC1 may be a novel
potential biomarker in the prediction of the progression and
survival of patients with bladder cancer.
Materials and methods
Data collection
The mRNA expression profile matrix files of GSE13507
and GSE120736 were downloaded from the GEO database (https://www.ncbi.nlm.nih.gov/geo/). GSE13507
performed on the platform of Illumina human-6 v2.0 expression
beadchip contained 68 normal bladder tissues and 188 bladder cancer
tissues (8). GSE120736 calculated
on the platform of Illumina HumanHT-12 V4.0 expression beadchip
contained 145 bladder cancer tissues. Only progression-free and
recurrence-free primary NMIBC and those with NMIBC with progression
were enrolled in our study; thus 98 samples from GSE13507 (67
non-progressive and 31 progressive) and 83 samples from GSE120736
(67 non-progressive and 16 progressive) were selected for further
analysis.
The mRNA sequencing expression profile and clinical
data of patients with bladder cancer were obtained from the Cancer
Genome Atlas (TCGA) data portal (https://gdc-portal.nci.nih.gov/). The inclusion
criteria were set as follows: i) Diagnosis of bladder cancer; ii)
the samples were recorded with complete RNAseq data; iii) the
samples were recorded with detailed clinicopathological data
including pathological stage, grade, overall survival (OS),
recurrence-free survival (RFS) and corresponding follow-up time
information. In total, 279 cases of bladder cancer were included
for further study. In addition, our research follows the access
rules and publication guidelines of TCGA.
Preprocessing of microarray data and
differentially expressed mRNA screening
Raw microarray datasets from GEO database were
normalized using Robust Multichip Average (RMA) and transformed to
Log2 pattern for processed signals. Probes were annotated by using
the Affymetrix annotation files (9). Then, the differentially expressed
genes (DEGs) between primary NMIBC and progressive NMIBC specimens
from training set (GSE13507) were screened with the use of DESeq R
package. When adjusted P-value <0.05 and |Log2 (FC)|>1, the
genes were regarded as DEGs, the expression profiles of which are
listed in Table SI.
Development and validation of the gene
signature
Univariate Cox regression analysis was utilized to
investigate the prognosis-related DEGs. The gene was considered
significant when P-value <0.05, and 47 candidates qualified,
through which the LASSO Cox regression was employed to build mRNAs
signature model for prediction of disease progression and
prognosis. The optimal value of the penalty parameter λ was
determined via 10-times cross-validations. 13-mRNA model was then
constructed based on the optimal λ value and the risk score for
each patient was calculated according to the expression of genes
and corresponding weighted coefficient. The samples in each cohort
were classified into a high-risk group and low-risk group based on
the optimum cut-off value determined using the X-tile software
(version 3.6.1, Yale University).
Construction of predictive
nomogram
The predictive nomogram based on mRNAs signature and
clinical related factors was plotted using ‘rms’ package of R
software (version 3.5.1). Calibration curve was plotted to assess
the performance of the nomogram. In the calibration graph,
nomogram-predicted progression and observed outcome were presented
on the x-axis and y-axis, respectively; the 45-degree dotted line
indicated the ideal prediction.
Gene set enrichment analysis
(GSEA)
To identify 13 mRNAs-related biological processes
and pathways, GSEA was performed using TCGA dataset including 279
patients with bladder cancer divided into high- and low-risk groups
according to the cut-off value, and executed using GSEA software
3.0 from the Broad Institute (10).
The Hallmark gene sets (h.all.v6.1.symbols.gmt) representing
specific well-defined biological processes and the gene sets of
canonical pathways (c2.all.v6.0.symbols.gmt) were obtained from the
Molecular Signatures Database (http://software.broadinstitute.org/gsea/msigdb/index.jsp).
Gene set permutations were performed 1,000 times for each analysis
to obtain normalized enrichment score (NES) used for sorting
pathways enriched in each phenotype. A result was regarded as
significant when nominal P-value <0.05 and false discovery rate
(FDR)<0.2.
Proteins network construction
Analysis of 13 gene-related networks was performed
using GeneMANIA (http://www.genemania.org/), a website-based database
and tool for predicting interactions and functions of genes and
gene sets on the basis of multiple networks (11). To screen hub genes in regulatory
network, node degree and betweenness were considered for analysis
of protein-protein interaction from a Cytoscape plugin. The
interaction networks for the gene signature were rebuilt and
visualized by Cytoscape (ver. 3.5.1).
Collection of clinical samples
Twelve NMIBC tissues and 12 MIBC tissues were
collected from patients diagnosed as primary bladder cancer between
September, 2017 and October, 2018 in the Department of Urology of
the First Affiliated Hospital of Chongqing Medical University. Once
we obtained the specimens, they were frozen and stored at −80°C
until used for RNA extraction. However, another 49 paraffin
sections of bladder cancer (including 34 MIBC and 15 NMIBC tissues)
were obtained from the Department of Pathology of Chongqing Medical
University (specimens were collected from January, 2015 to
December, 2017) for detection of proteins by immunohistochemistry
assay. Notably, there was no cross-over between the two groups of
patients. The study was approved by the Ethics Committees of the
First Affiliated Hospital of Chongqing Medical University and
informed consent was obtained from each patient involved.
RNA isolation and reverse
transcriptase-quantitative polymerase chain reaction (RT-qPCR)
Total RNA was extracted from bladder cancer tissues
using TRIzol reagent (Invitrogen; Thermo Fisher Scientific, Inc.,)
according to the manufacturer's instructions. Complementary DNA
(cDNA) was synthesized using 1 µg of total RNA and the PrimeScript
RT reagent kit (Takara). RT-qPCR was performed using SYBR-Green
assay (Takara) and executed by ABI 7500 Real-Time PCR system
(Applied Biosystems). Gene expression was normalized to β-actin.
Primers used for mRNAs (Invitrogen; Thermo Fisher Scientific,
Inc.,) are summarized in Table
SII. Relative quantification values of mRNAs were calculated
with the use of the 2−ΔΔCq method (12). In addition, bladder cancer cells
were also used for the isolation of RNA for RT-qPCR.
Immunohistochemistry (IHC)
The protocol of immunohistochemical staining was as
previously described (13).
Briefly, sections of formalin-fixed paraffin-embedded (FFPE) were
deparaffinized and rehydrated, immersed in sodium citrate buffer
for antigen retrieval, incubated with 3% H2O2
to remove endogenous peroxidase activity, blocked with normal goat
serum, incubated with anti-CTHRC1 (Abcam, ab85739) at 4°C
overnight, incubated with biotinylated goat anti-mouse IgG and
streptavidin-biotin-conjugated horseradish peroxidase (HRP) at
37°C. Then signals were visualized using a diaminobenzidine kit
(ZSGB-BIO) and slides were counterstained with hematoxylin. The IHC
scores were assessed by two experienced pathologists and calculated
based on the staining intensity and extent; the score criterion was
described specifically in previous study (13).
Cell culture
Human bladder cancer cell lines (5637 and TCCSUP)
were purchased from the American Type Culture Collection (ATCC).
The 5637 and TCCSUP cells were cultured in RPMI-1640 medium
(Corning) with 10% fetal bovine serum (FBS), 100 mg/ml penicillin
and 100 mg/ml streptomycin at 37°C in 5% CO2.
Cell transfection
Transfections were performed using Lipofectamine
2000 (Invitrogen; Thermo Fisher Scientific, Inc.,) according to the
manufacturer's protocol. The 5637 and TCCSUP cells were seeded in
6-well plates at density of 1×10⁶ cells/well and
cultured at 37°C with 5% CO2 for 24 h. Cells were
transfected with CTHRC1 siRNAs (siRNA-1: Sense,
5′-GCCAAUGGCAUUCCGGGUATT-3′; Antisense,
5′-UACCCGGAAUGCCAUUGGCTT-3′. siRNA-2: Sense,
5′-CCUCUUCCCAUUGAAGCUATT-3′; Antisense,
5′-UAGCUUCAAUGGGAACAGGTT-3′.) or negative control siRNA (Sense,
5′-UUCUCCGAACGUGUCACGUTT-3′; Antisense,
5′-ACGUGACACGUUCGGAGAATT-3′) (GenePharma Inc.) at a concentration
of 50 nM for 4 h. After 48 h, the treated cells were collected for
subsequent experiments.
Cell migration assay
Cell migration assay was detected using Transwell
chambers (Corning Inc.). After transfection with siRNA for 48 h,
5637 and TCCSUP cells were digested with trypsin and suspended
(5×10⁵ cells/ml) with serum-free RPMI-1640 medium. Cell
suspension (200 µl) was added to the upper chamber, and 700 µl
RPMI-1640 medium containing 10% FBS was added to the lower chamber.
After 48 h, the migrated cells were fixed with 4% paraformaldehyde
and stained with 0.1% crystal violet for 15 min each at room
temperature. Subsequently, the cells from five random fields were
counted under a microscope (×100 magnification; Leica Microsystems
GmbH).
Statistical analysis
Statistical analyses were carried out using R
software (version 3.5.1), SPSS software (version 22; SPSS Inc.) and
Graphpad 5.0. LASSO Cox regression analysis was conducted in the
discovery dataset using the ‘glmnet’ package. Comparisons between
the two groups were examined using the two-tailed Student's t-test.
The prediction accuracy of the model was analyzed by receiver
operating characteristic (ROC) or time-dependent ROC and evaluated
by area under curve (AUC). The survival difference between high-
and low-risk groups was assessed by the Kaplan-Meier curve and
compared by the log-rank test. The prognosis significance of
mRNA-based signature was analyzed by univariate and multivariate
Cox proportional hazard regression model. One-way analysis of
variance (ANOVA) was used for comparisons among multiple groups,
followed by the Newman-Keuls post hoc test. P<0.05 was regarded
as statistically significant.
Results
Preparation of bladder cancer
datasets
Two gene expression datasets (GSE13507 and
GSE120736) with disease progression information about patients with
NMIBC were screened for establishing and validation of the model
after a thorough search of the GEO database. A total of 279 cases
of bladder cancer samples with complete survival data were
downloaded from TCGA database for prognostic verification. The
baseline data of these cohorts are summarized in Table I.
 | Table I.Summary of baseline characteristics
of patients with bladder cancer in the three datasets. |
Table I.
Summary of baseline characteristics
of patients with bladder cancer in the three datasets.
| Characteristic | GSE13507
(n=98) | GSE120736
(n=83) | TCGA (n=279) |
|---|
| Age |
|
|
|
|
≤65 | 42 | N/A | 171 |
|
>65 | 56 | N/A | 108 |
| Sex |
|
|
|
|
Male | 82 | 71 | 213 |
|
Female | 16 | 12 | 66 |
| Grade |
|
|
|
|
Low | 69 | 35 | 15 |
|
High | 29 | 48 | 262 |
|
Unkown | 0 | 0 | 2 |
| Tumor stage |
|
|
|
| Ta | 20 | 34 | 2 |
|
T1 | 58 | 33 | 2 |
|
T2 | 7 | 5 | 107 |
|
T3–4 | 13 | 11 | 164 |
| Tx | 0 | 0 | 4 |
| Lymph node
stage |
|
|
|
|
N0 | 94 | N/A | 202 |
|
N1–3 | 3 | N/A | 75 |
| Nx | 1 | N/A | 2 |
| Progression |
|
|
|
| No | 67 | 67 | N/A |
|
Yes | 31 | 16 | N/A |
| Recurrence |
|
|
|
| No | 67 | 67 | 212 |
|
Yes | 31 | 16 | 67 |
| Survival
status |
|
|
|
|
Alive | 54 | N/A | 194 |
|
Deceased | 44 | N/A | 85 |
| Mean follow-up time
(month) | 51.9 | N/A | 24.9 |
Development of a 13-mRNA-based
classifier
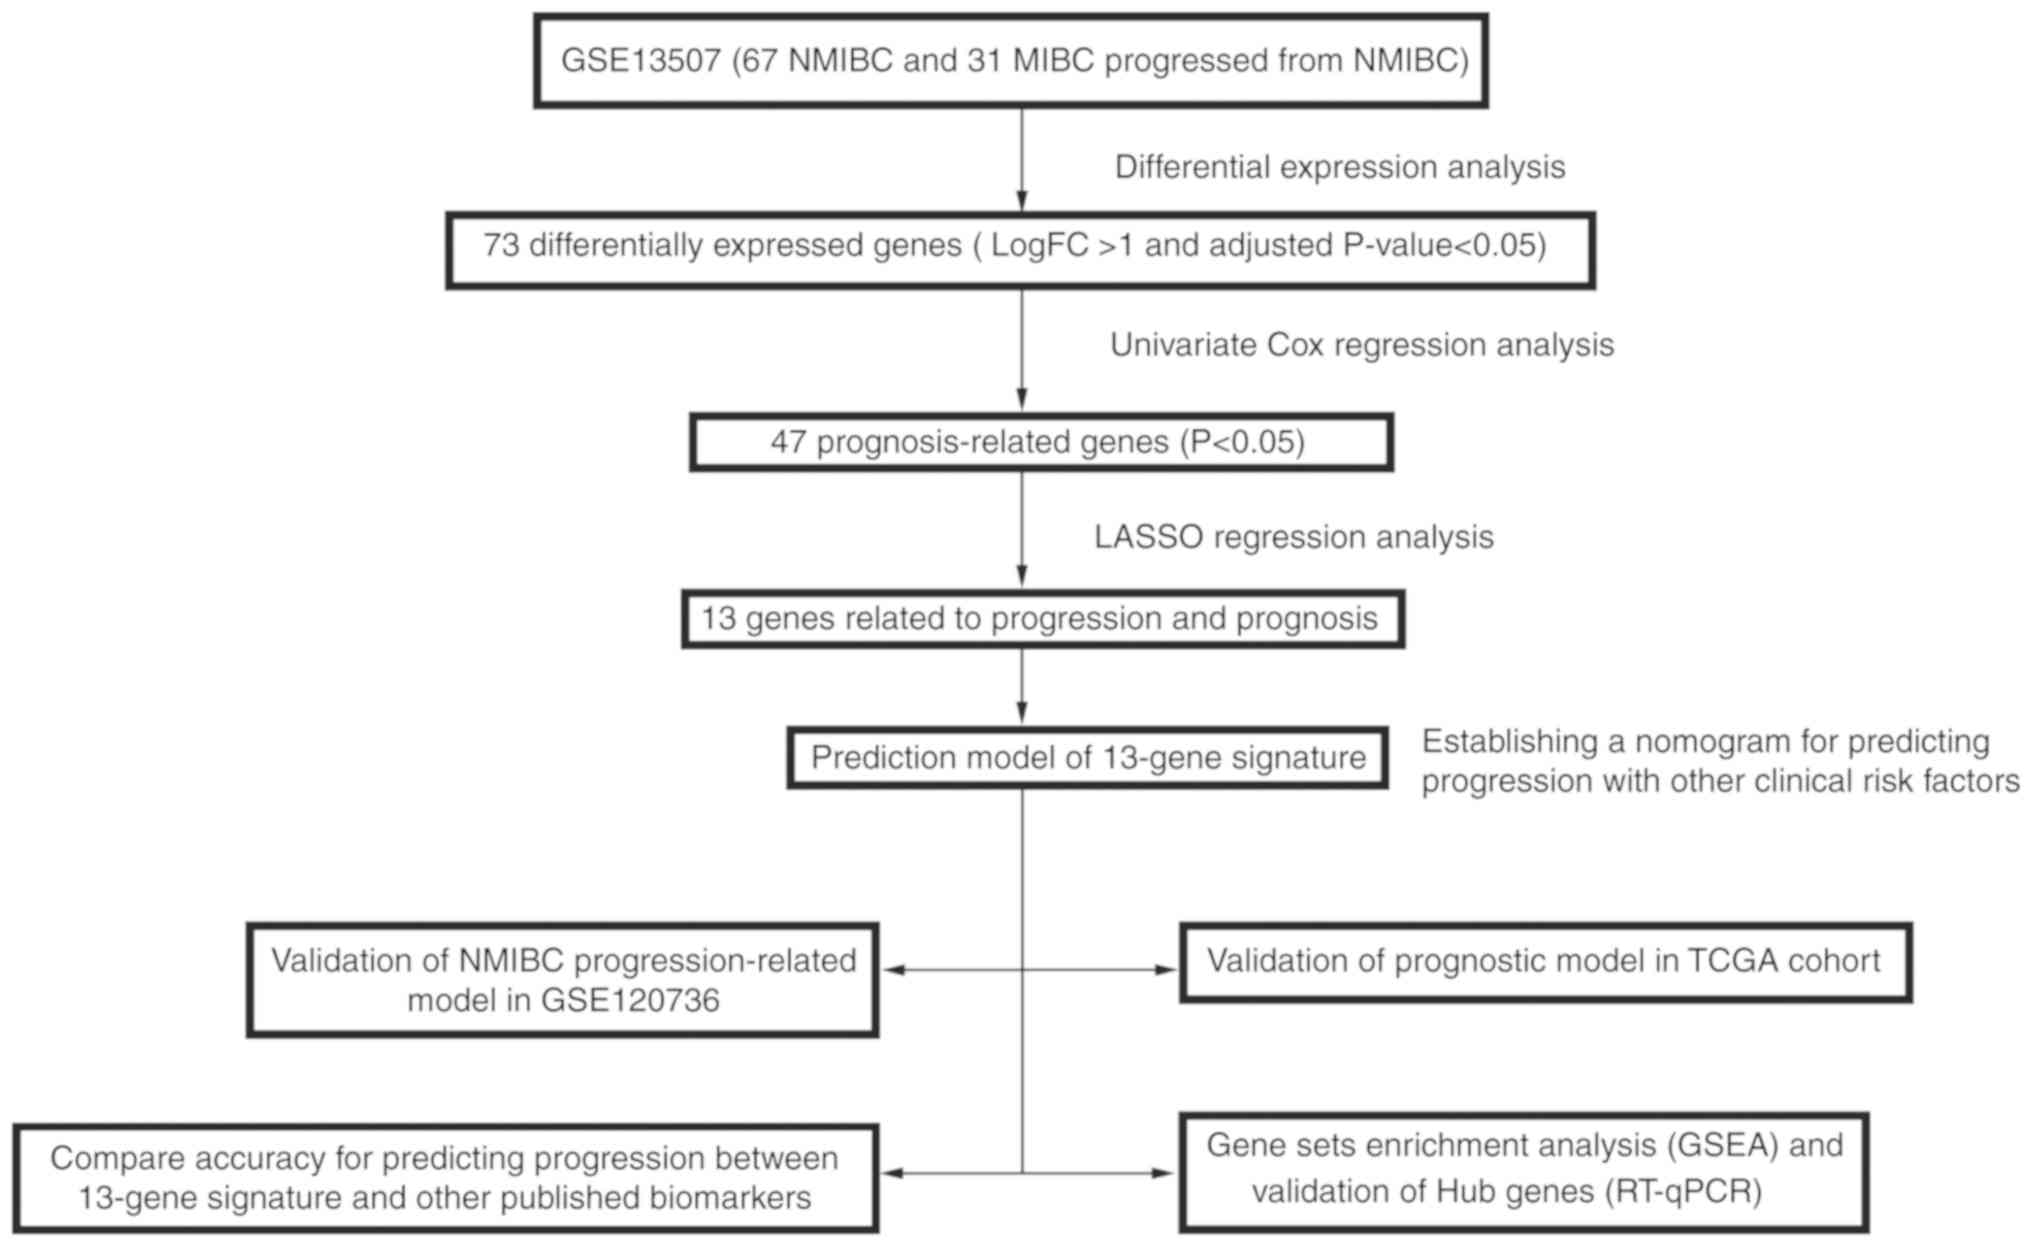
A detailed flow-chart of the procedure of analysis
is depicted in Fig. 1 to aid in
better understanding the study. GSE13507 dataset (with 67 patients
with confined NMIBC and 31 patients with progressive NMIBC) was
used to construct the training cohort, the samples in which were
divided into a non-progressive group and a progressive group.
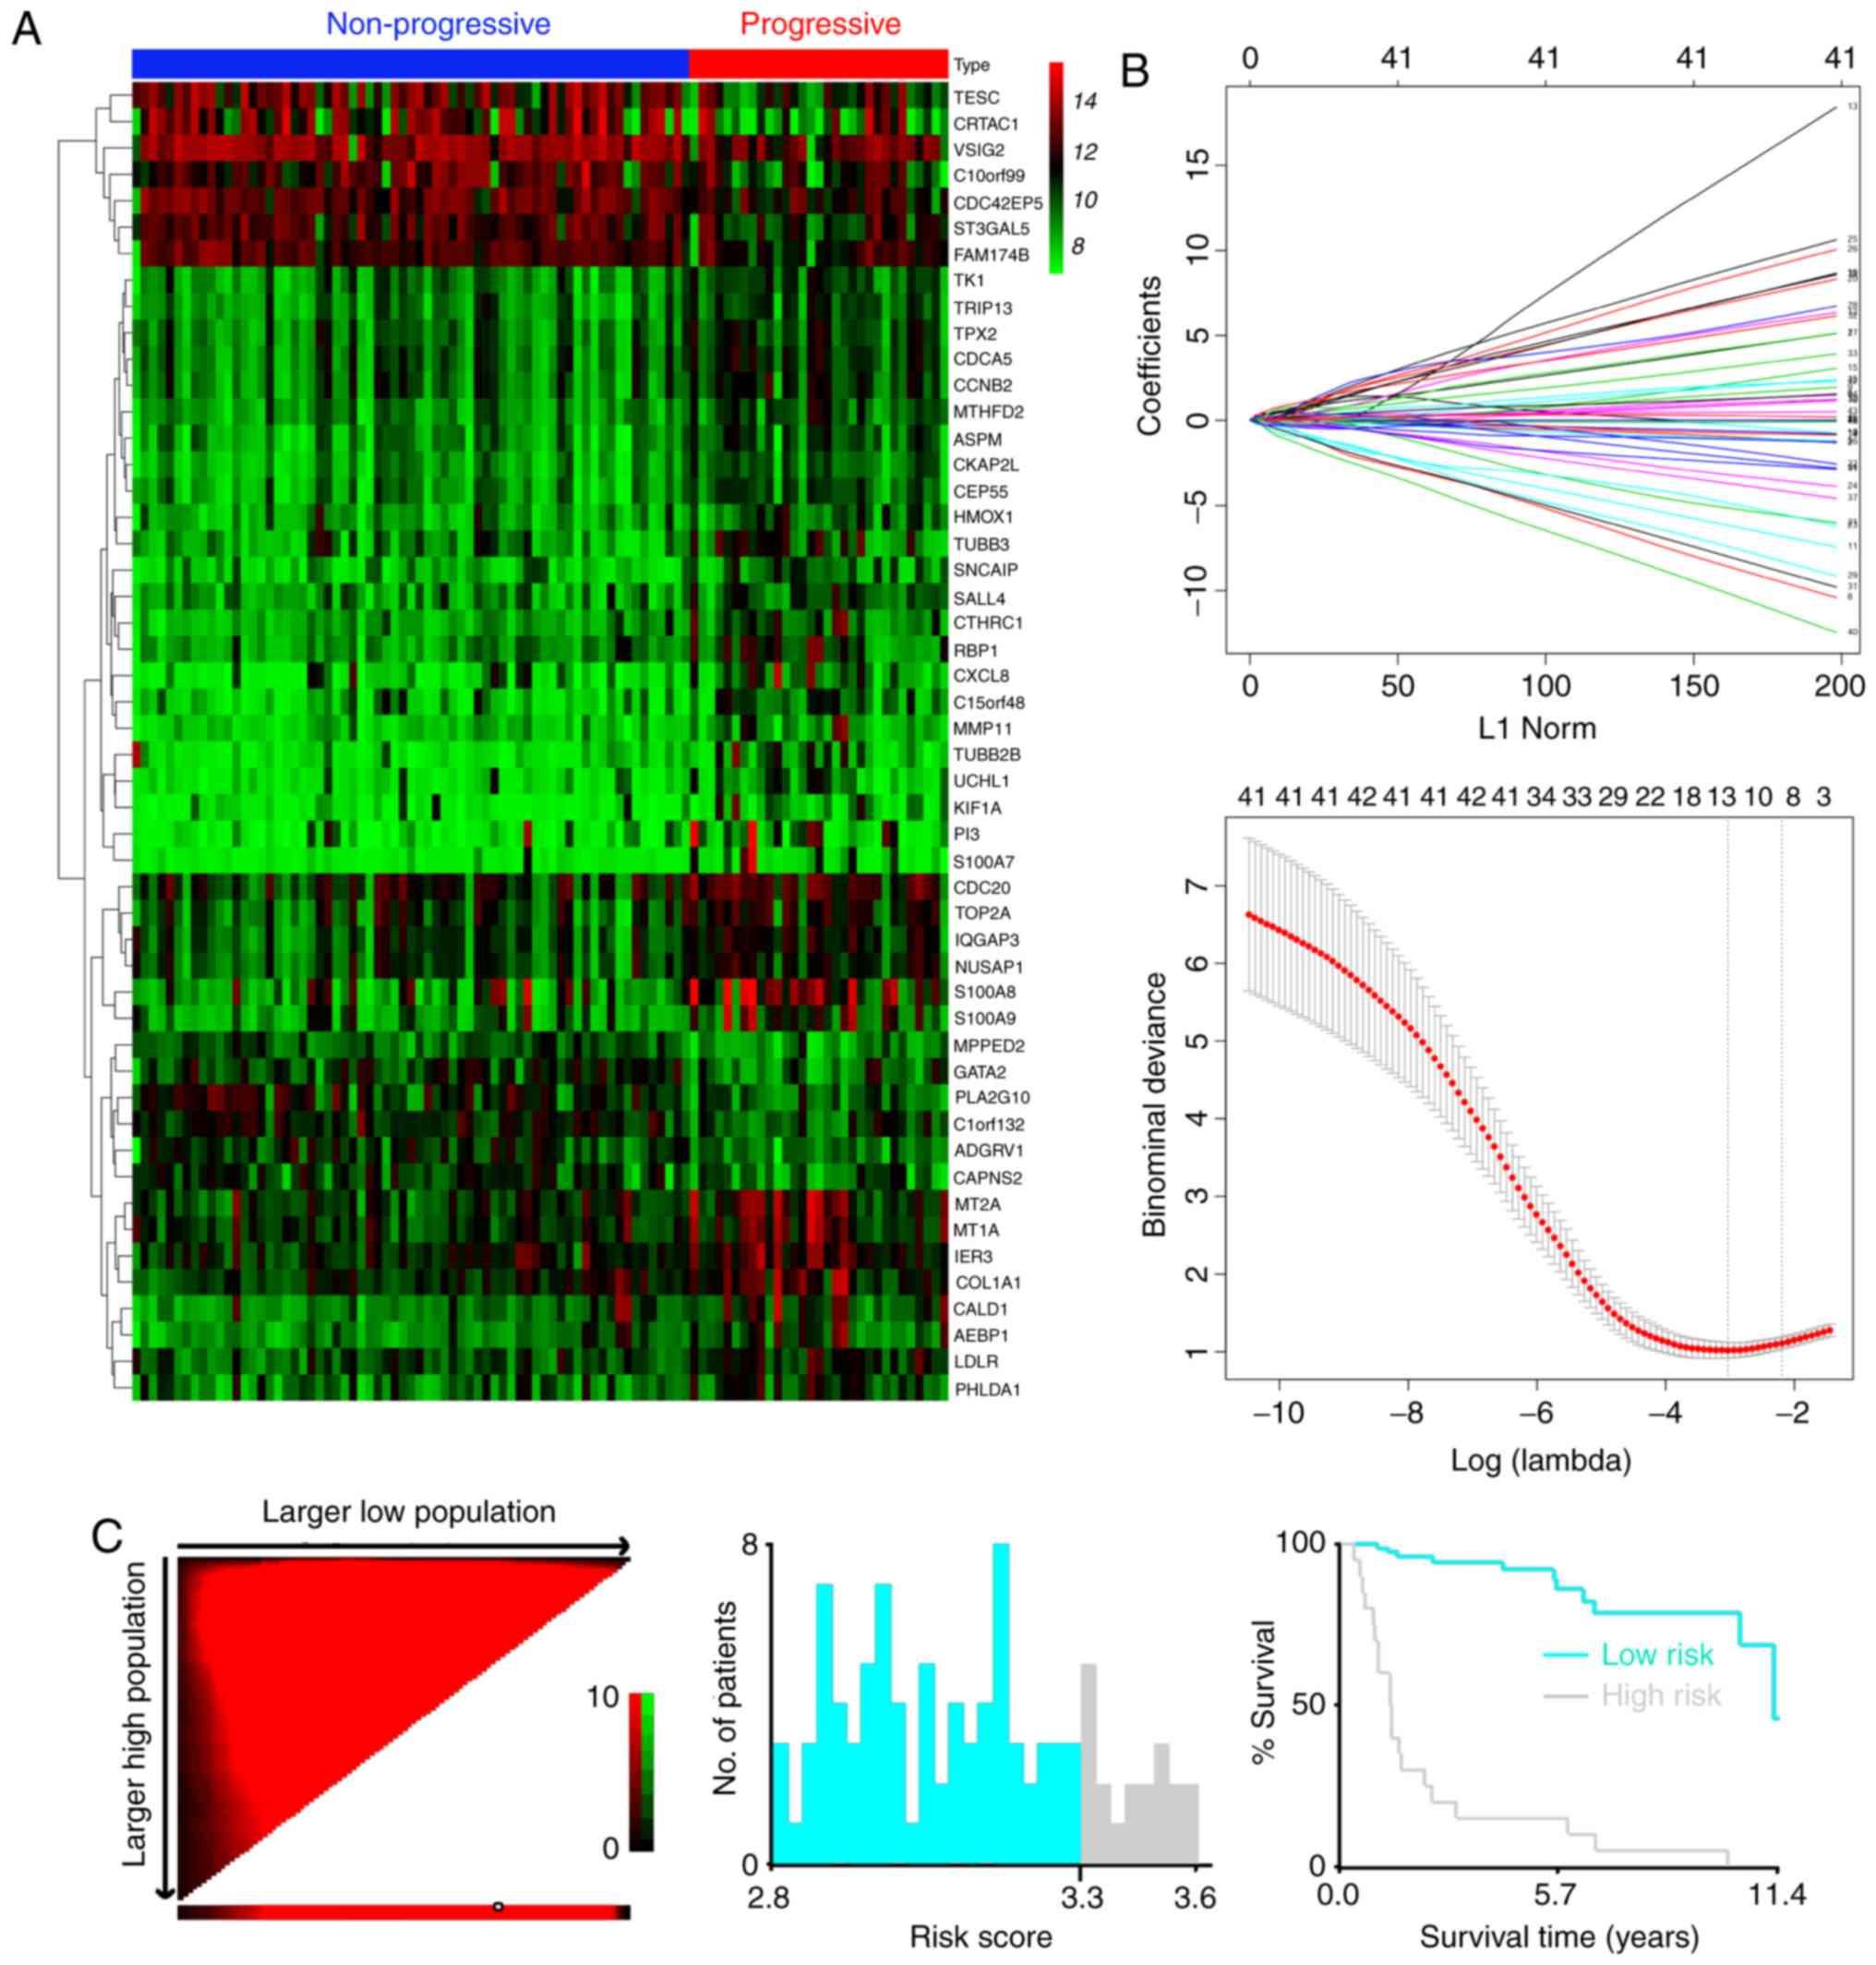
Seventy-three differentially expressed mRNAs were found between the
two groups (Fig. 2A), including 24
downregulated mRNAs and 49 overexpressed mRNAs (Table SI). Among them we conducted
univariate Cox regression to investigate the prognosis-related
genes and identified 47 genes, which were significantly related to
survival for further analysis (P<0.05) (Table SIII).
LASSO regression model was utilized to develop
progression-related gene signatures and 13 of the 47 genes were
selected in the training dataset (Fig.
2B). Risk score for each patient was accumulated based on the
expression levels of the 13 mRNAs and corresponding weighted
coefficients: Risk score=(0.17027* expression level of
S100A8)+(0.06678* expression level of
CTHRC1)+(0.10548* expression level of
C15orf48)+(−0.16639* expression level of
MPPED2)+(0.25600* expression level of
CKAP2L)+(0.17159* expression level of
SNCAIP)+(0.06363* expression level of
SALL4)+(0.01503* expression level of MMP11)+(0.00057*
expression level of COL1A1)+(0.22674* expression level of
AEBP1)+(−0.08764* expression level of
C10orf99)+(0.22416* expression level of
KIF1A)+(−0.00367* expression level of ALDH1L1).
The optimum cut-off value of the mRNA classifier was
determined as 3.3 according to the X-tile diagrams (Fig. 2C). We classified patients in the
training dataset into high- and low-risk groups based on the
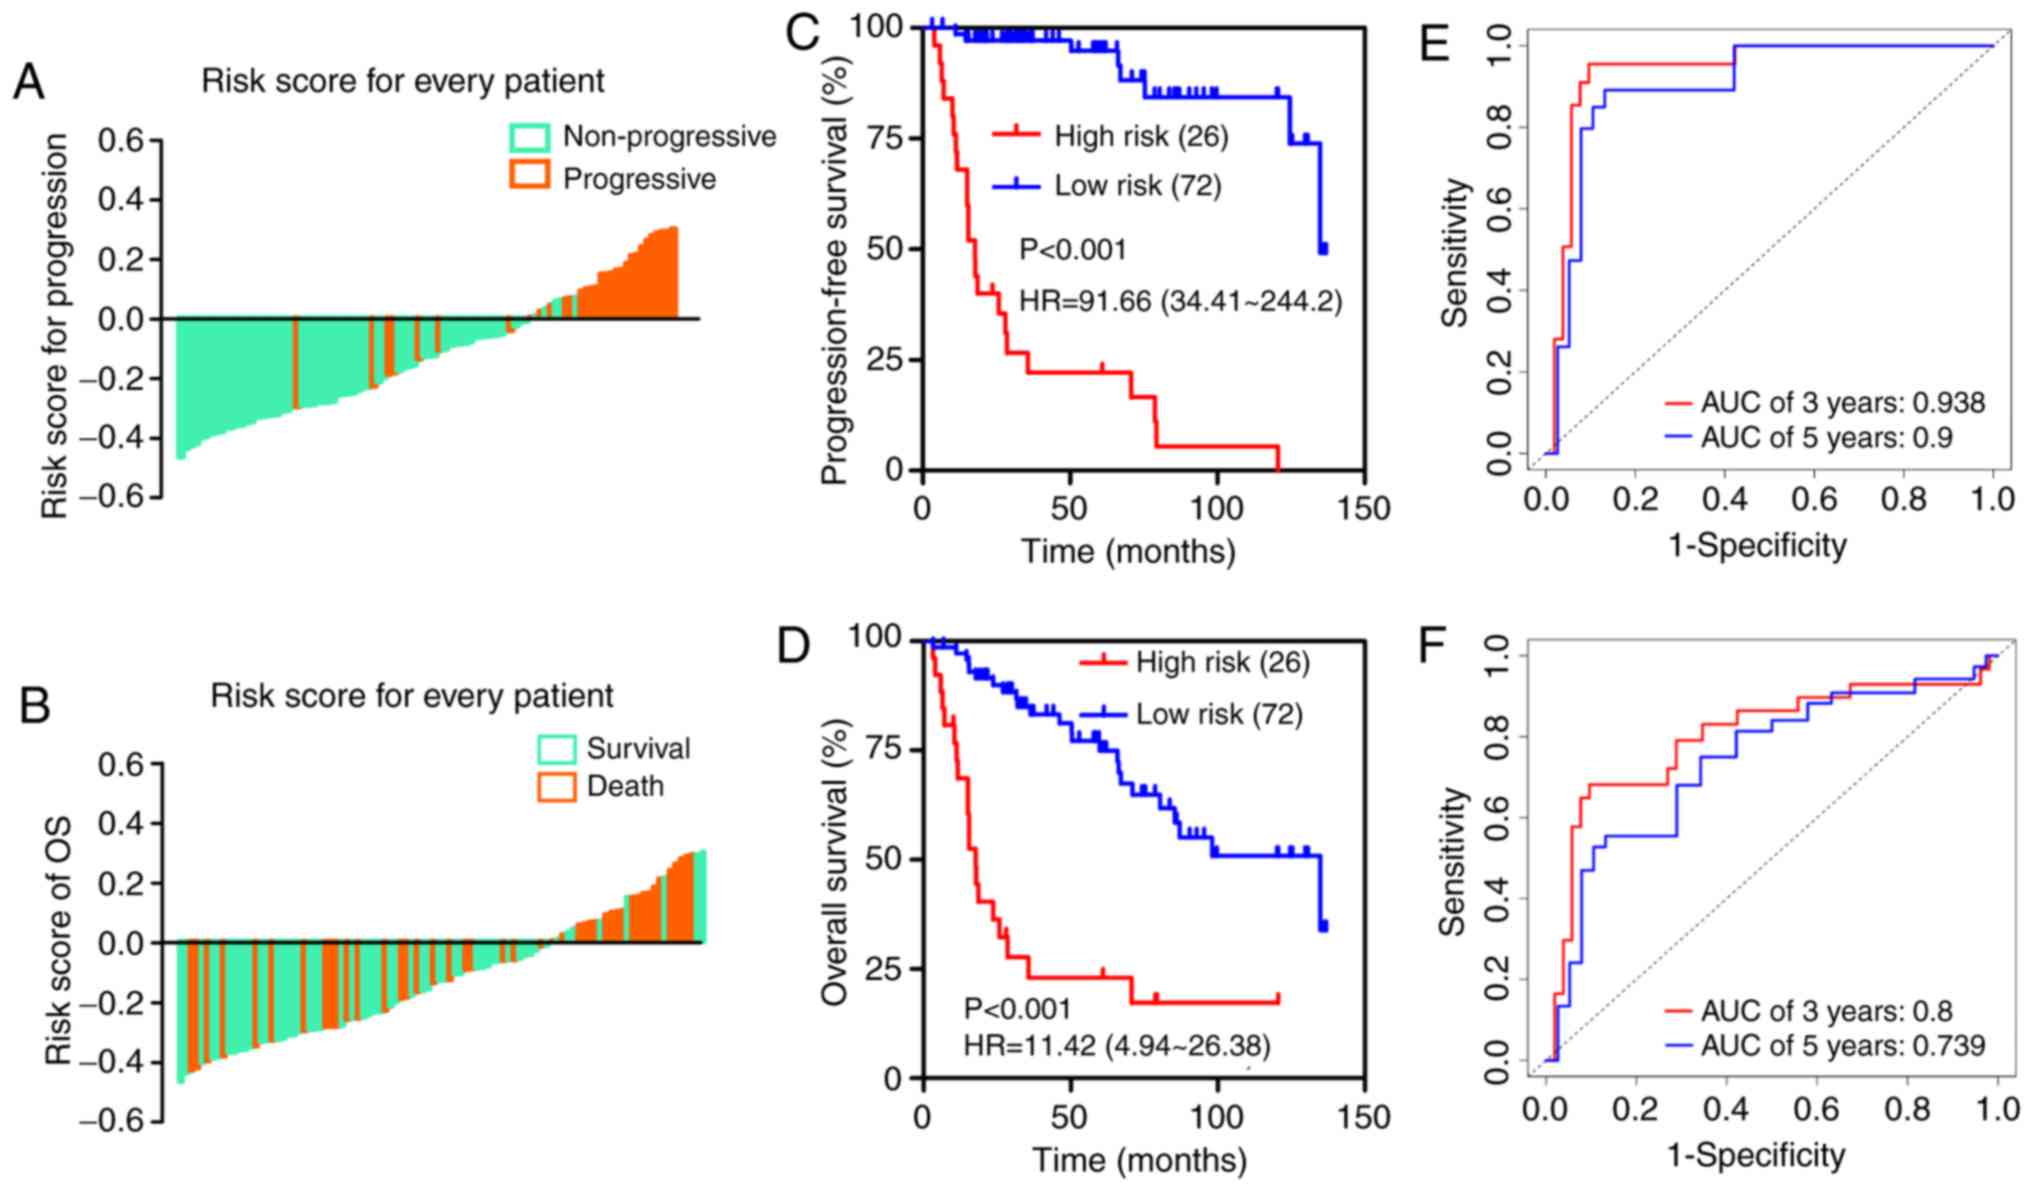
established optimum cut-off point. The distribution of adjusted
risk score (risk score minus cut-off value) for each patient is
shown in Fig. 3A and B, which
suggests that patients in the high-risk group (above the x-axis)
had a higher possibility of disease progression and poorer survival
than those in the low-risk group (below the x-axis). Kaplan-Meier
survival curves demonstrated that the two groups had significantly
different progression-free survival (PFS) time [hazard ratio
(HR)=91.66, 95% confidence interval (CI)=34.41–244.2, P<0.001;
Fig. 3C] and overall survival time
(HR=11.42, 95% CI=4.94–26.38, P<0.001; Fig. 3D). Time-dependent ROC analysis
indicated that the areas under the curve (AUCs) at 3- and 5-year
were 0.938 and 0.9 for PFS (Fig.
3E) and 0.8 and 0.739 for OS (Fig.
3F), respectively.
Performance of the 13-mRNA signature
in the validation dataset
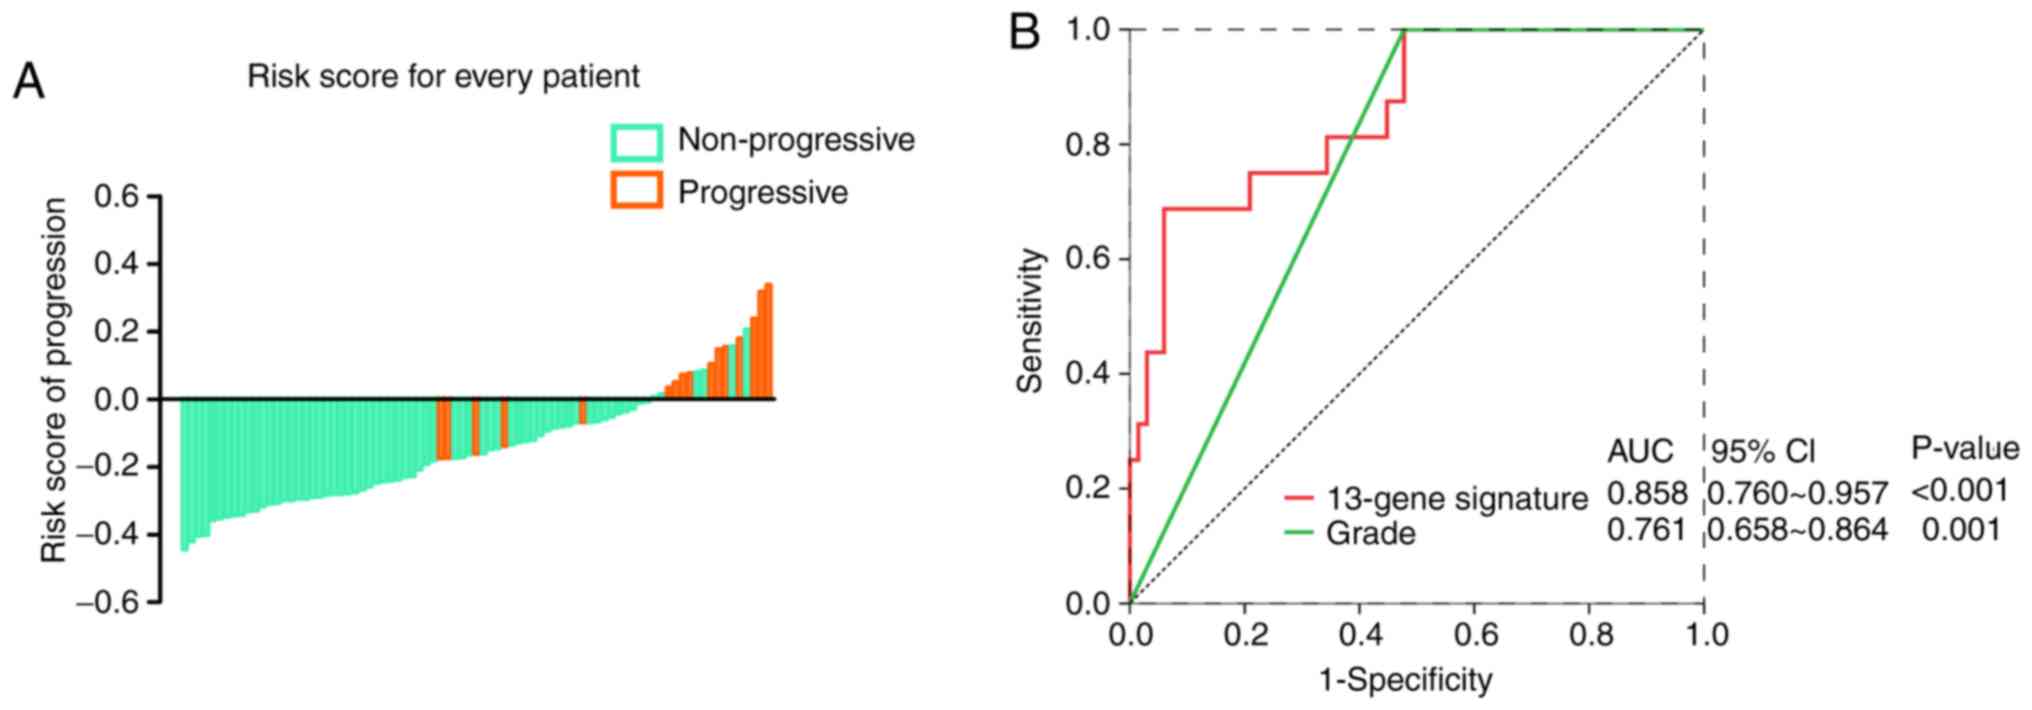
To further confirm the predictive value of the
13-mRNA signature in different datasets, we employed another
qualified GEO microarray (GSE120736). A total of 83 patients in the
validation cohort were divided into a high-risk group [n=16
(19.3%)] and a low-risk group [(n=67 (80.7%)] based on the same
risk score model and cut-off point. Consistent with the findings
described before, the proportion of disease progression of patients
in the low-risk group was significantly lower than that of patients
in the high-risk group (Fig. 4A).
In Fig. 4B, The AUC in the ROC
analyses for the 13-mRNA signature and grade were statistically
significant (AUC=0.8581, 95% CI=0.760–0.957; P<0.001; and
AUC=0.761, 95% CI=0.658–0.864; P=0.001, respectively).
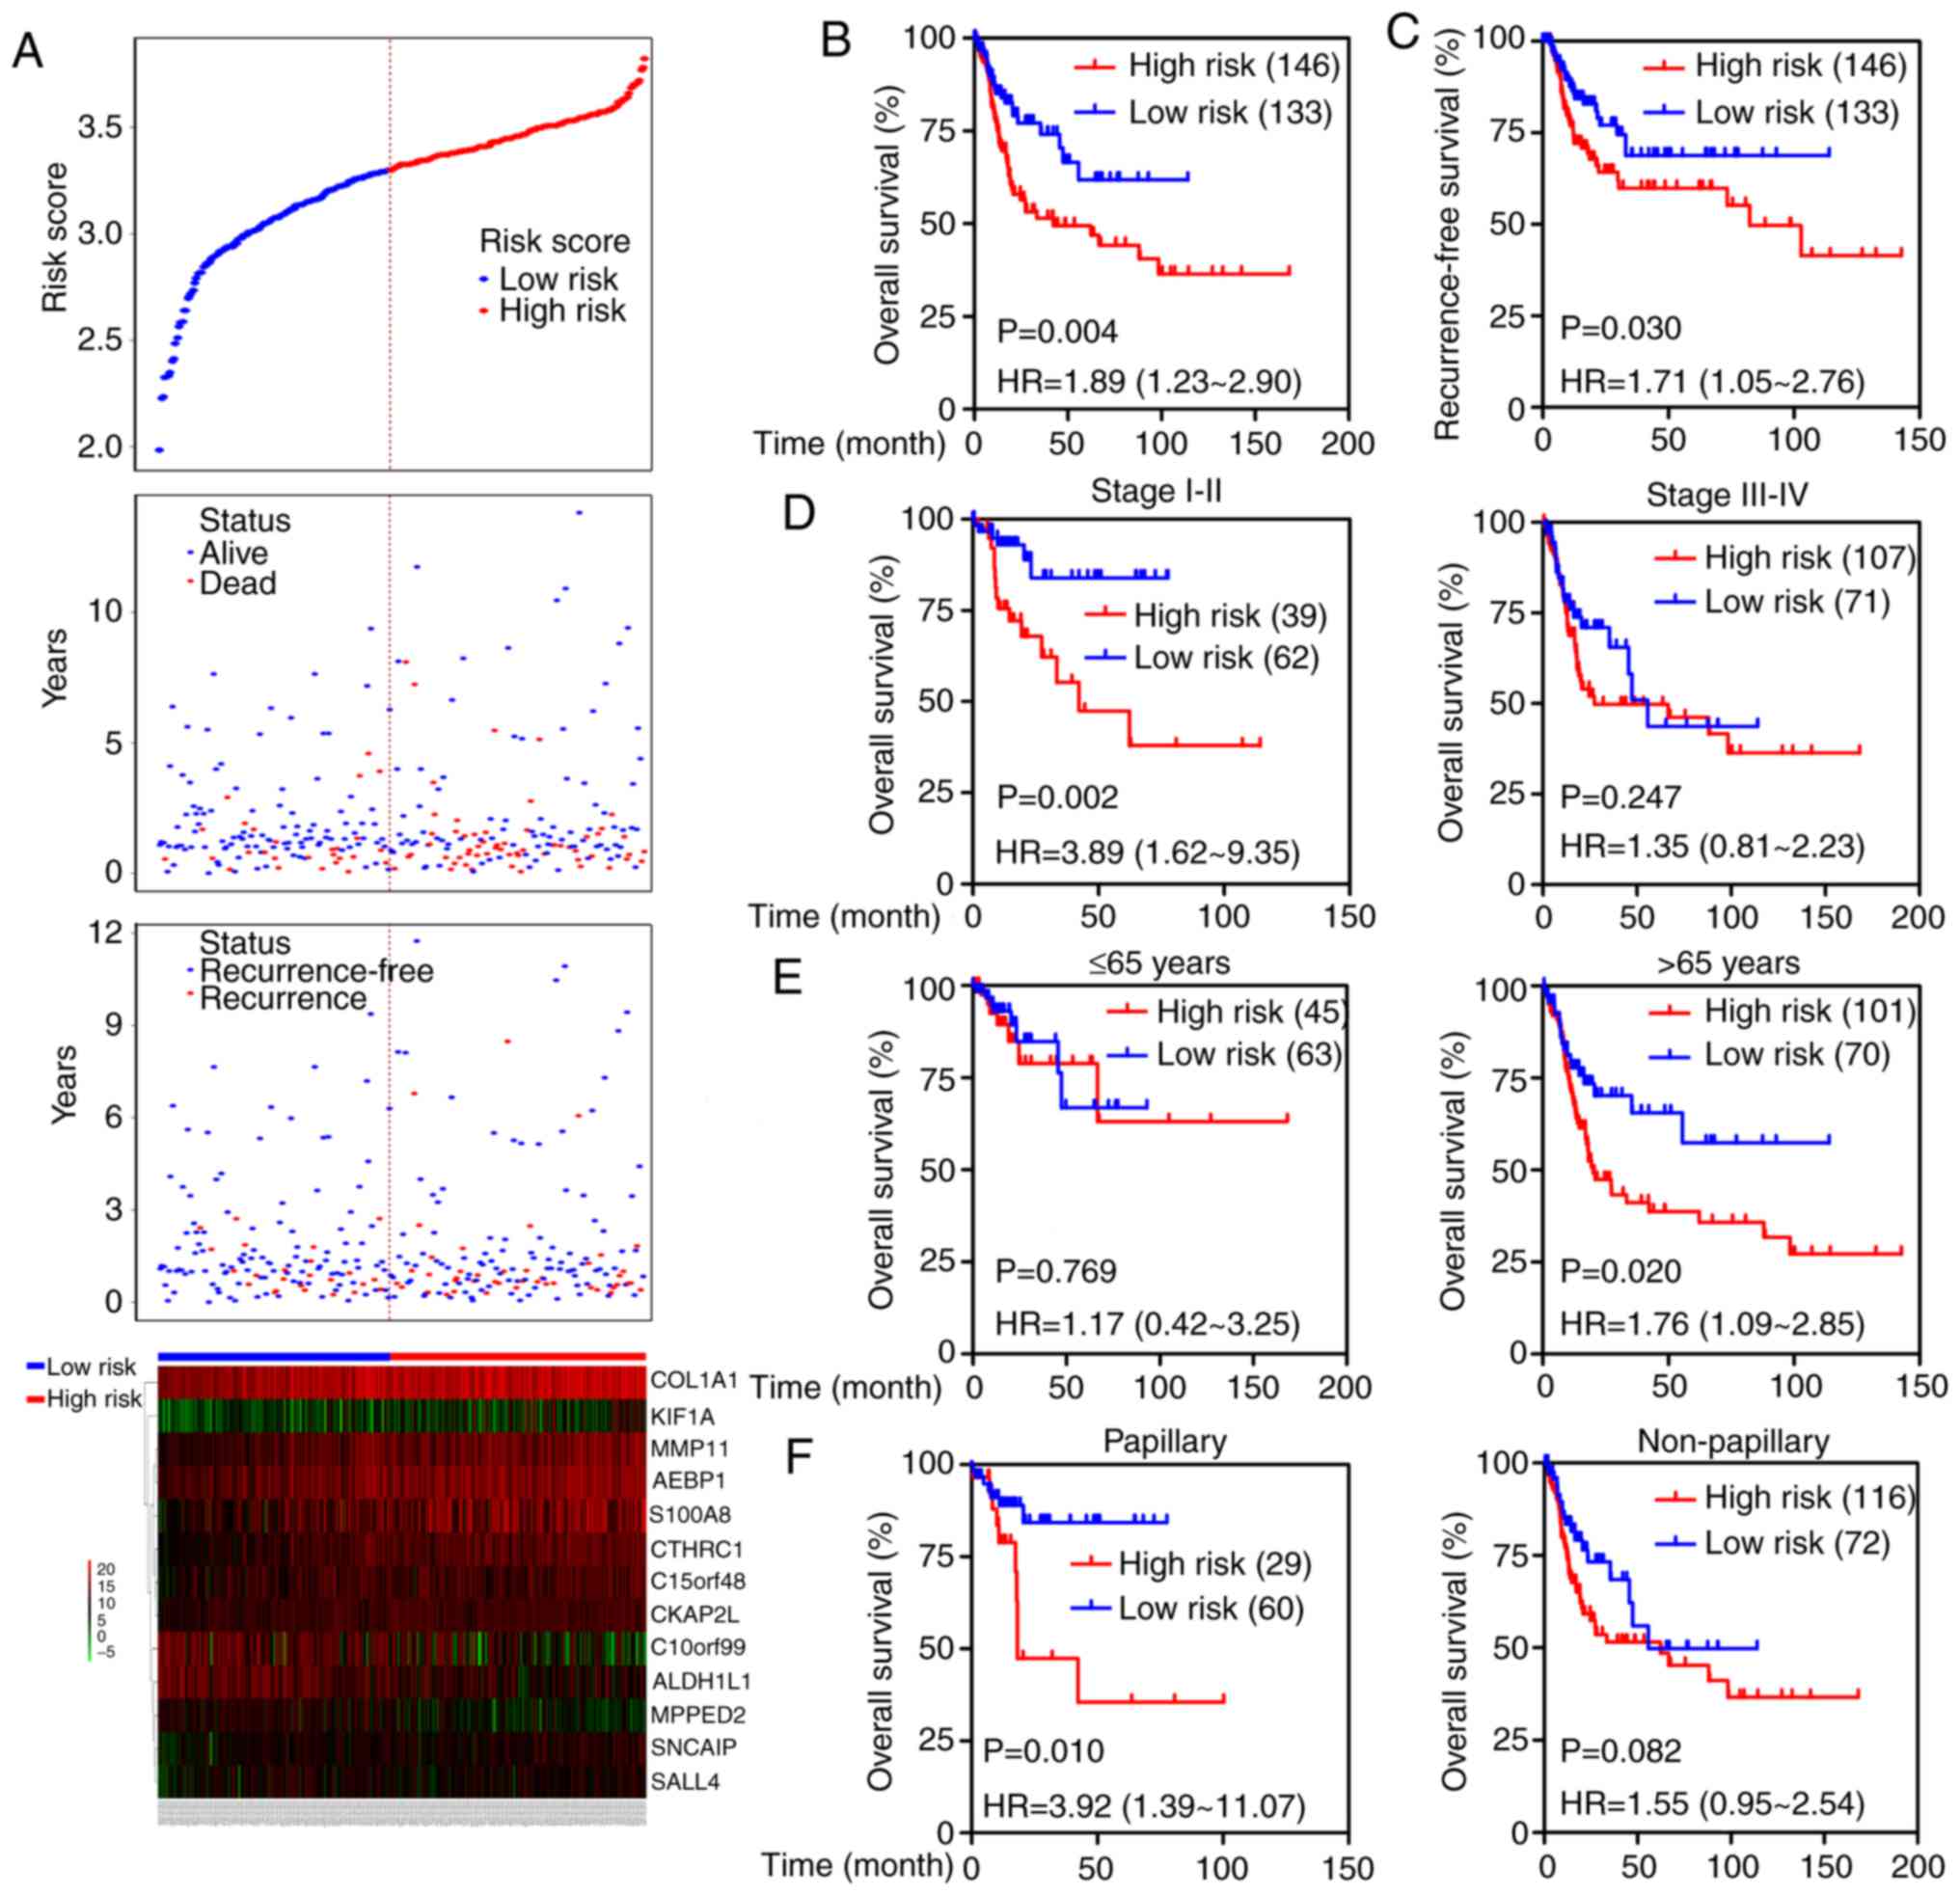
Additionally, the prognostic value of the 13-mRNA
classifier was further tested in TCGA cohort. Based on the
established cut-off point above, 146 (52.3%) patients were divided
into the high-risk group, and 133 (47.7%) were in the low-risk
group. The distribution of each patient's risk score, survival
status, recurrence status, and expression profiles of the 13 genes
were ranked and are shown in Fig.
5A. Kaplan-Meier curves showed that patients with high-risk
scores had higher mortality and recurrence rates than patients with
low-risk scores (OS: HR=1.89, 95% CI=1.23–2.90, P=0.004; RFS:
HR=1.71, 95% CI=1.05–2.76, P=0.030; Fig. 5B and C). We next stratified the
patients into different subgroups according to the American Joint
Committee on Cancer (AJCC) stage (stage I–II versus stage III–IV),
age (≤65 vs. >65 years) and tumor subtypes (papillary versus
non-papillary). Prognosis of patients in the high-risk group was
evidently worse than that in the low-risk group in stage I–II
subgroup (HR=3.89; 95% CI=1.62–9.35, P=0.002) but not in the stage
III–IV group (Fig. 5D). High-risk
scores suggested a poor prognosis in the elderly subgroup (HR=1.76;
95% CI=1.09–2.85, P=0.020) but not in the young group (Fig. 5E), and predicted an unfavorable
outcome in patients in the papillary subgroup (HR=3.92; 95%
CI=1.39–11.07, P=0.010) but not in the non-papillary subgroup
(Fig. 5F). Moreover, the prognostic
value of the 13-mRNA signature combined with clinical factors was
further analyzed by univariate and multivariate Cox regression. As
shown in Table II, age,
lymph-vascular invasion (LVI), and 13-mRNA-based risk score
significantly correlated with OS even when adjusted for other
covariates.
| Table II.Univariate and multivariate Cox
regression analysis for overall survival of patients with bladder
cancer. |
Table II.
Univariate and multivariate Cox
regression analysis for overall survival of patients with bladder
cancer.
|
| Univariate
analysis | Multivariate
analysis |
|---|
|
|
|
|
|---|
| Variates | HR (95% CI) | P-value | HR (95% CI) | P-value |
|---|
| Age (≥65 vs.
≤65) | 3.23
(1.85–5.65) |
<0.001c | 4.57
(1.72–12.11) | 0.002b |
| Sex (male vs.
female) | 1.21
(0.72–2.05) | 0.465 | — | — |
| Subtype
(non-papillary vs. papillary) | 1.60
(0.94–2.72) | 0.086 | — | — |
| LVI (yes vs.
no) | 2.47
(1.45–4.23) | 0.001b | 2.45
(1.19–5.07) | 0.016a |
| pT stage
(T3–4 vs. T1–2) | 1.89
(1.17–3.06) | 0.01a | — — | 0.909 |
| pN stage
(N1–3 vs. N0) | 2.18
(1.41–3.37) |
<0.001c | 1.08
(0.46–2.50) | 0.863 |
| pM stage
(M1 vs. M0) | 4.12
(1.64–10.38) | 0.003b | 3.23
(0.38–27.46) | 0.283 |
| AJCC stage (III–IV
vs. I–II) | 1.81
(1.10–2.96) | 0.019a | — — | 0.909 |
| 13-mRNA signature
(high vs. low) | 3.40
(1.47–7.87) | 0.004b | 5.23
(1.14–24.06) | 0.034a |
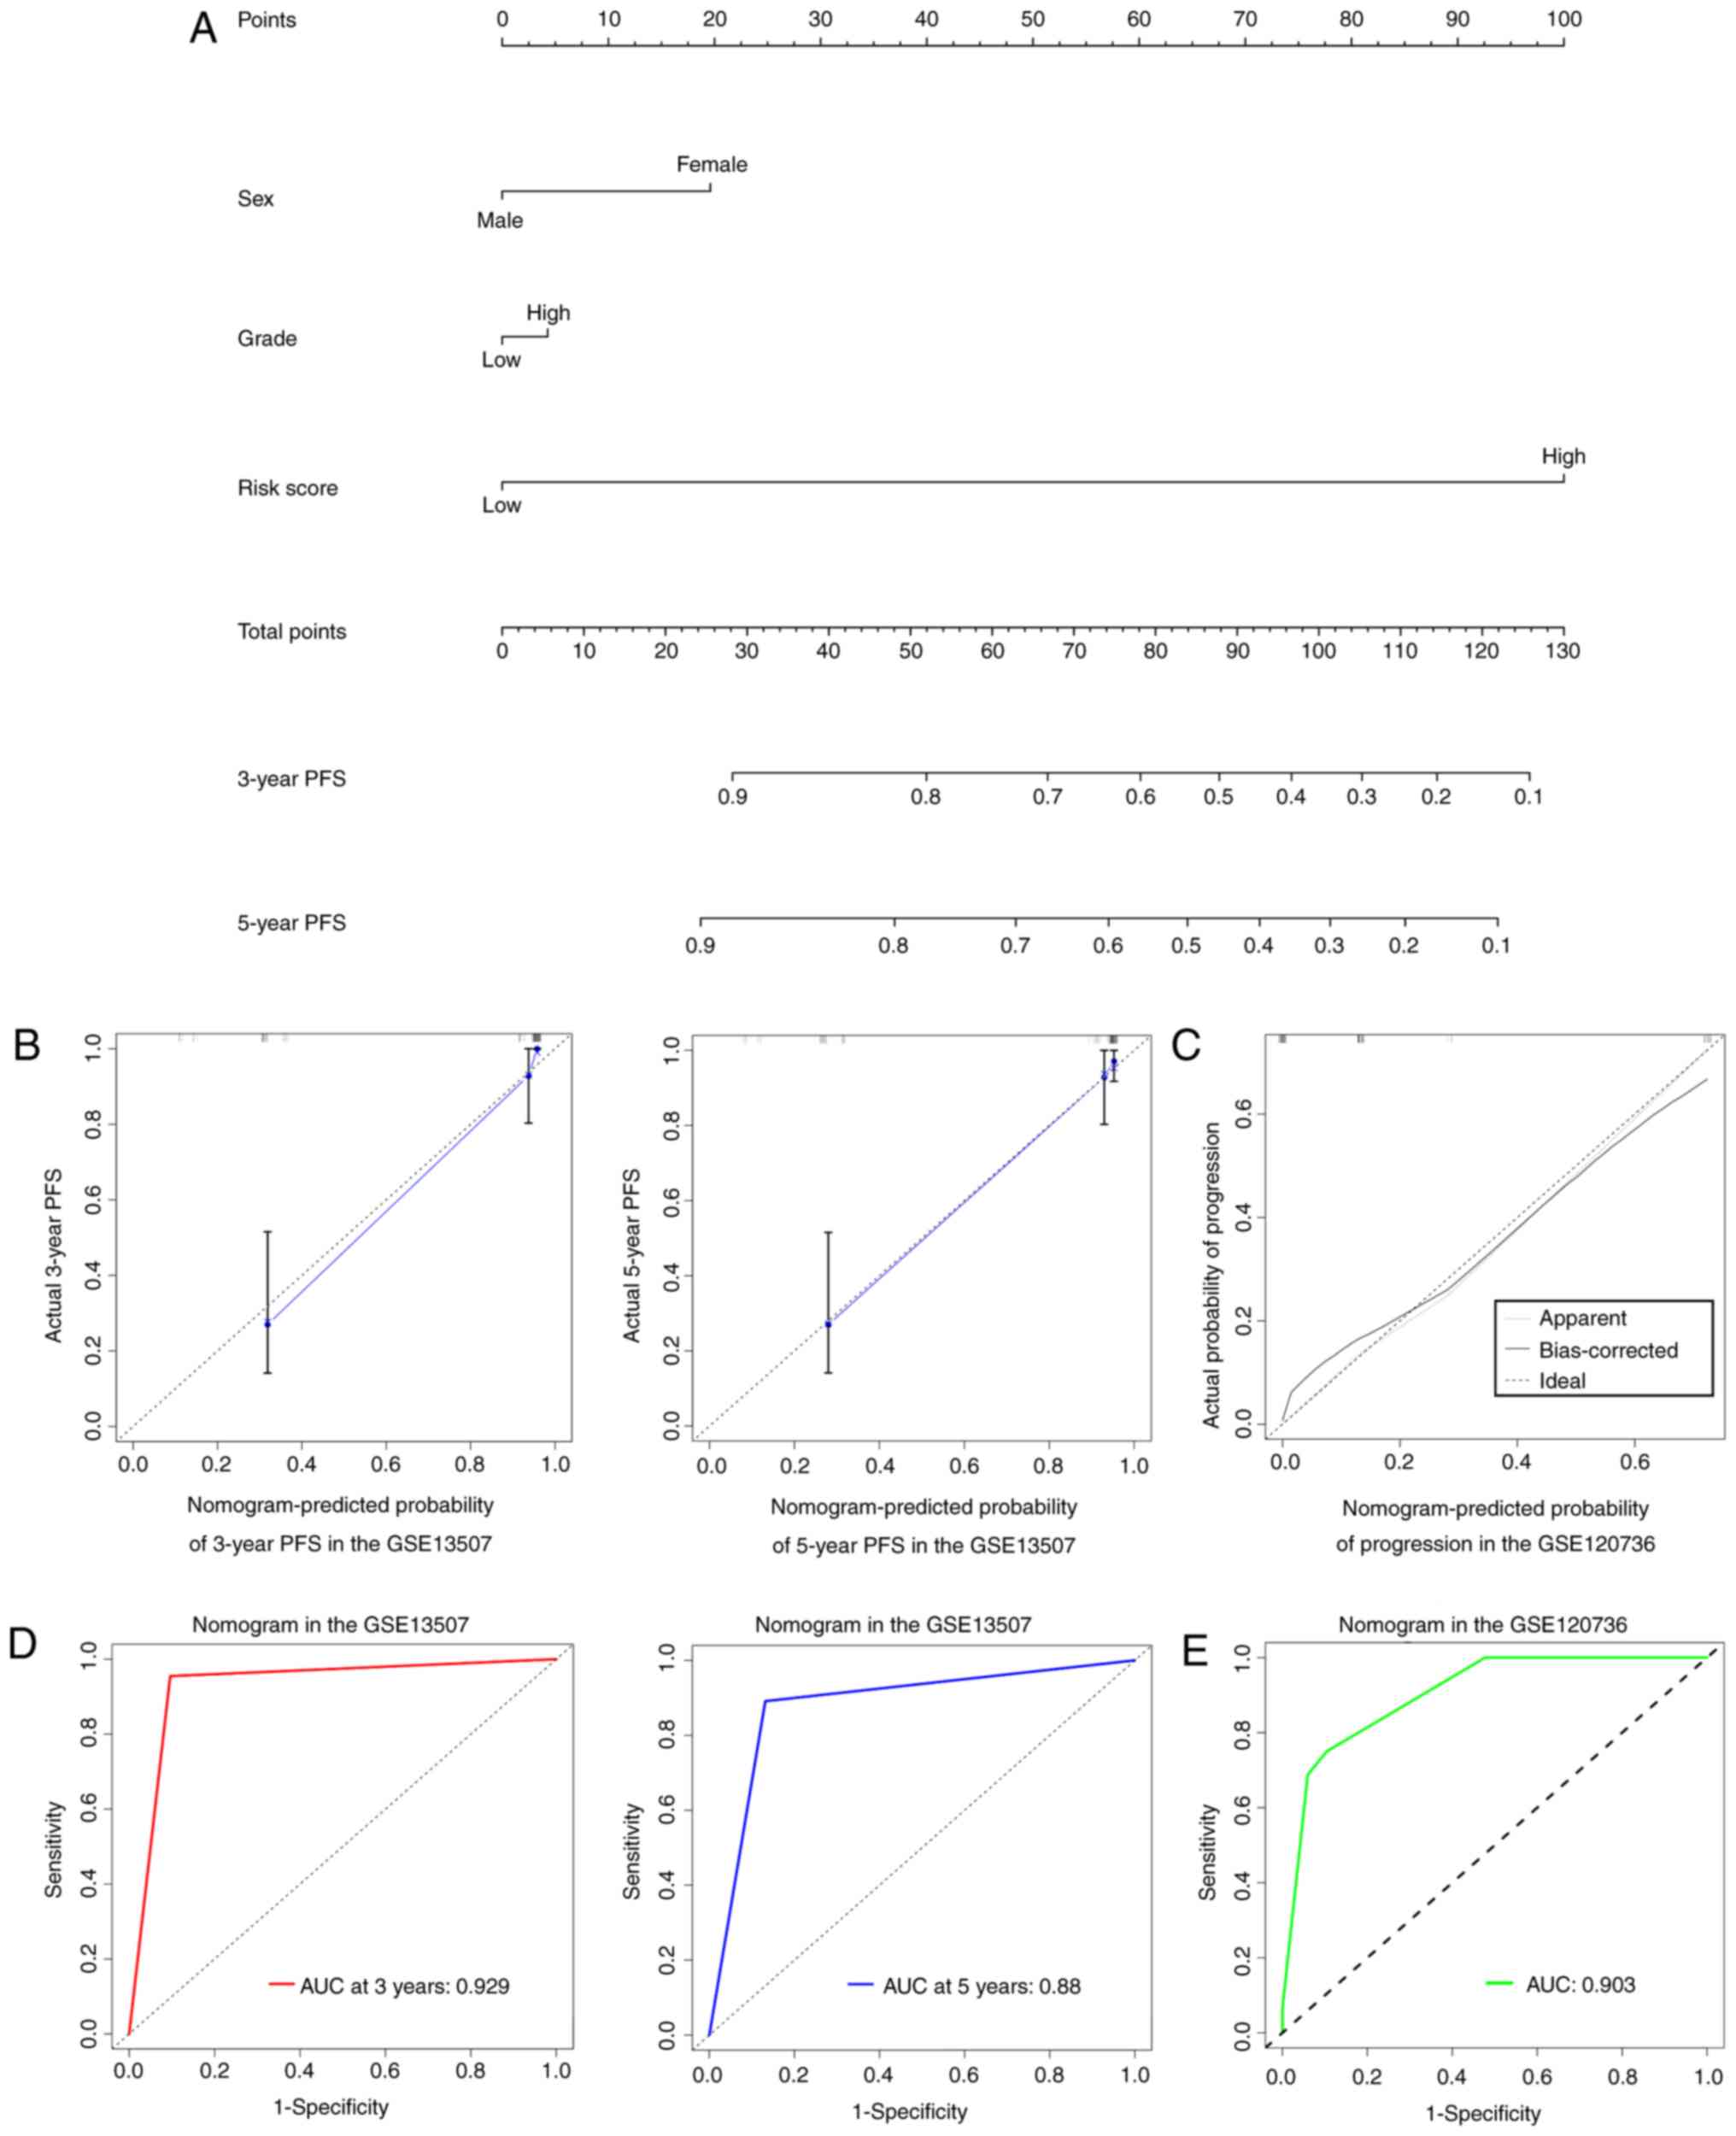
Establishment of a nomogram to predict
progression of NMIBC
To provide a clinically practical method for
clinicians to predict the risk of progression in patients with
NMIBC, a nomogram was developed by integrating the 13-mRNA
signature and other clinical factors including sex and grade that
were available both in GSE13507 and GSE120736 datasets (Fig. 6A). In comparison to the ideal model,
the calibration plots for 3- and 5-year PFS were predicted well in
the training dataset (Fig. 6B), and
the performance of the nomogram on prediction accuracy was also
excellent in the validation dataset (Fig. 6C). Time-dependent ROC curves
indicated that the AUCs at 3- and 5-year were 0.929 and 0.88 for
the nomogram in the training dataset (Fig. 6D). ROC analysis showed a 0.903 of
AUC for the nomogram in the validation dataset (Fig. 6E).
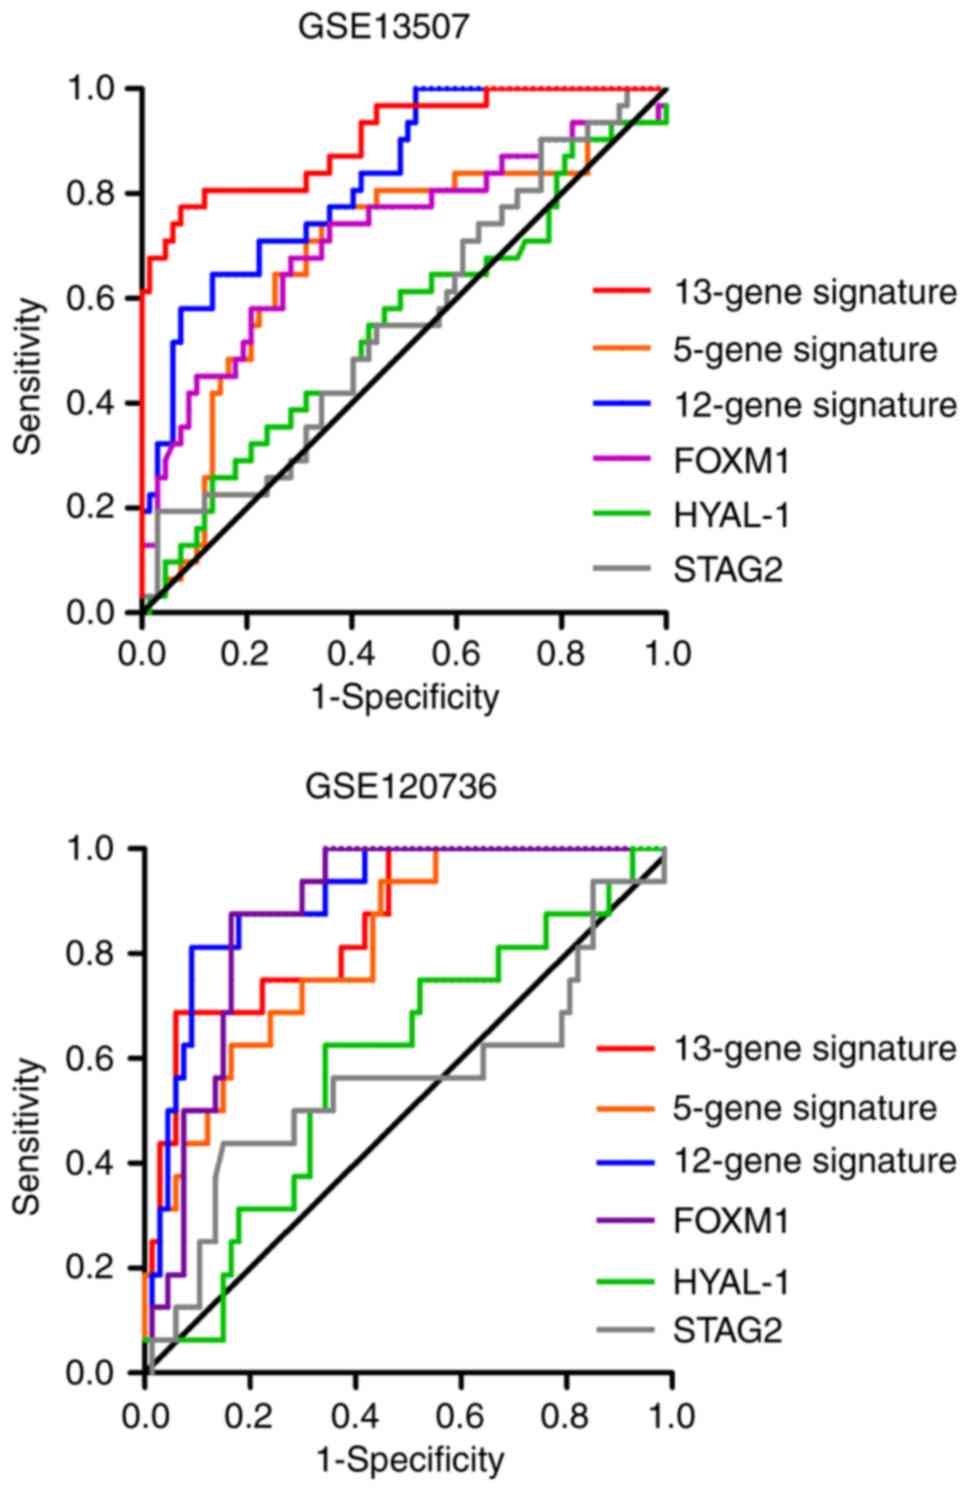
Comparison of the 13-mRNA signature
with other progression-related biomarkers for NMIBC
Several studies have attempted to develop biomarkers
for predicting disease progression in NMIBC during the past couple
of years. We compared the diagnostic efficacy of the 13-gene
classifier to that of other published biomarkers in the GSE13507
and GSE120736 cohorts to comprehensively evaluate the model's
practical applicability. The published biomarkers included mRNA
signatures and single genes, including a 5-gene signature to
predict progression in T1G3 bladder cancer (14), a prognostic model based on a 12-gene
progression score (15), and
FOXM1 (16), HYAL-1
(17) and STAG2 (18) that were used for prediction of
recurrence or progression in NMIBC.
The AUC and P-value for each possible signature or
biomarker were calculated using the corresponding weighted formula
algorithms. As shown in Fig. 7 and
Table III, the 13-mRNA signature
had a favorable performance in the two independent datasets, with
an AUC of 0.905 in GSE13507 and 0.857 in GSE120736. Similar
performance was observed in the 12-gene progression score model,
with an AUC of 0.827 in GSE13507 and 0.902 in GSE120736. However,
the 5-gene classifier exhibited inadequate performance, with an AUC
of 0.689 in GSE13507 and 0.811 in GSE120736. In terms of the
predictive value of several independent biomarkers in NMIBC
progression, the diagnostic performance of FOXM1 was better
than that of HYAL-1 and STAG2 in the two cohorts.
| Table III.AUCs of the signatures and biomarkers
in the training and validation datasets. |
Table III.
AUCs of the signatures and biomarkers
in the training and validation datasets.
|
| GSE13507 | GSE120736 |
|---|
|
|
|
|
|---|
| Approaches | AUC | P-values | AUC | P-values |
|---|
| 13-gene
signature | 0.905 | P<0.0001 | 0.857 | P<0.0001 |
| 5-gene
signature | 0.689 | P=0.003 | 0.811 | P=0.0001 |
| 12-gene
signature | 0.827 | P<0.0001 | 0.902 | P<0.0001 |
| FOXM1 | 0.717 | P=0.001 | 0.874 | P<0.0001 |
| HYAL-1 | 0.545 | P=0.475 | 0.593 | P=0.2484 |
| STAG2 | 0.556 | P=0.378 | 0.557 | P=0.4778 |
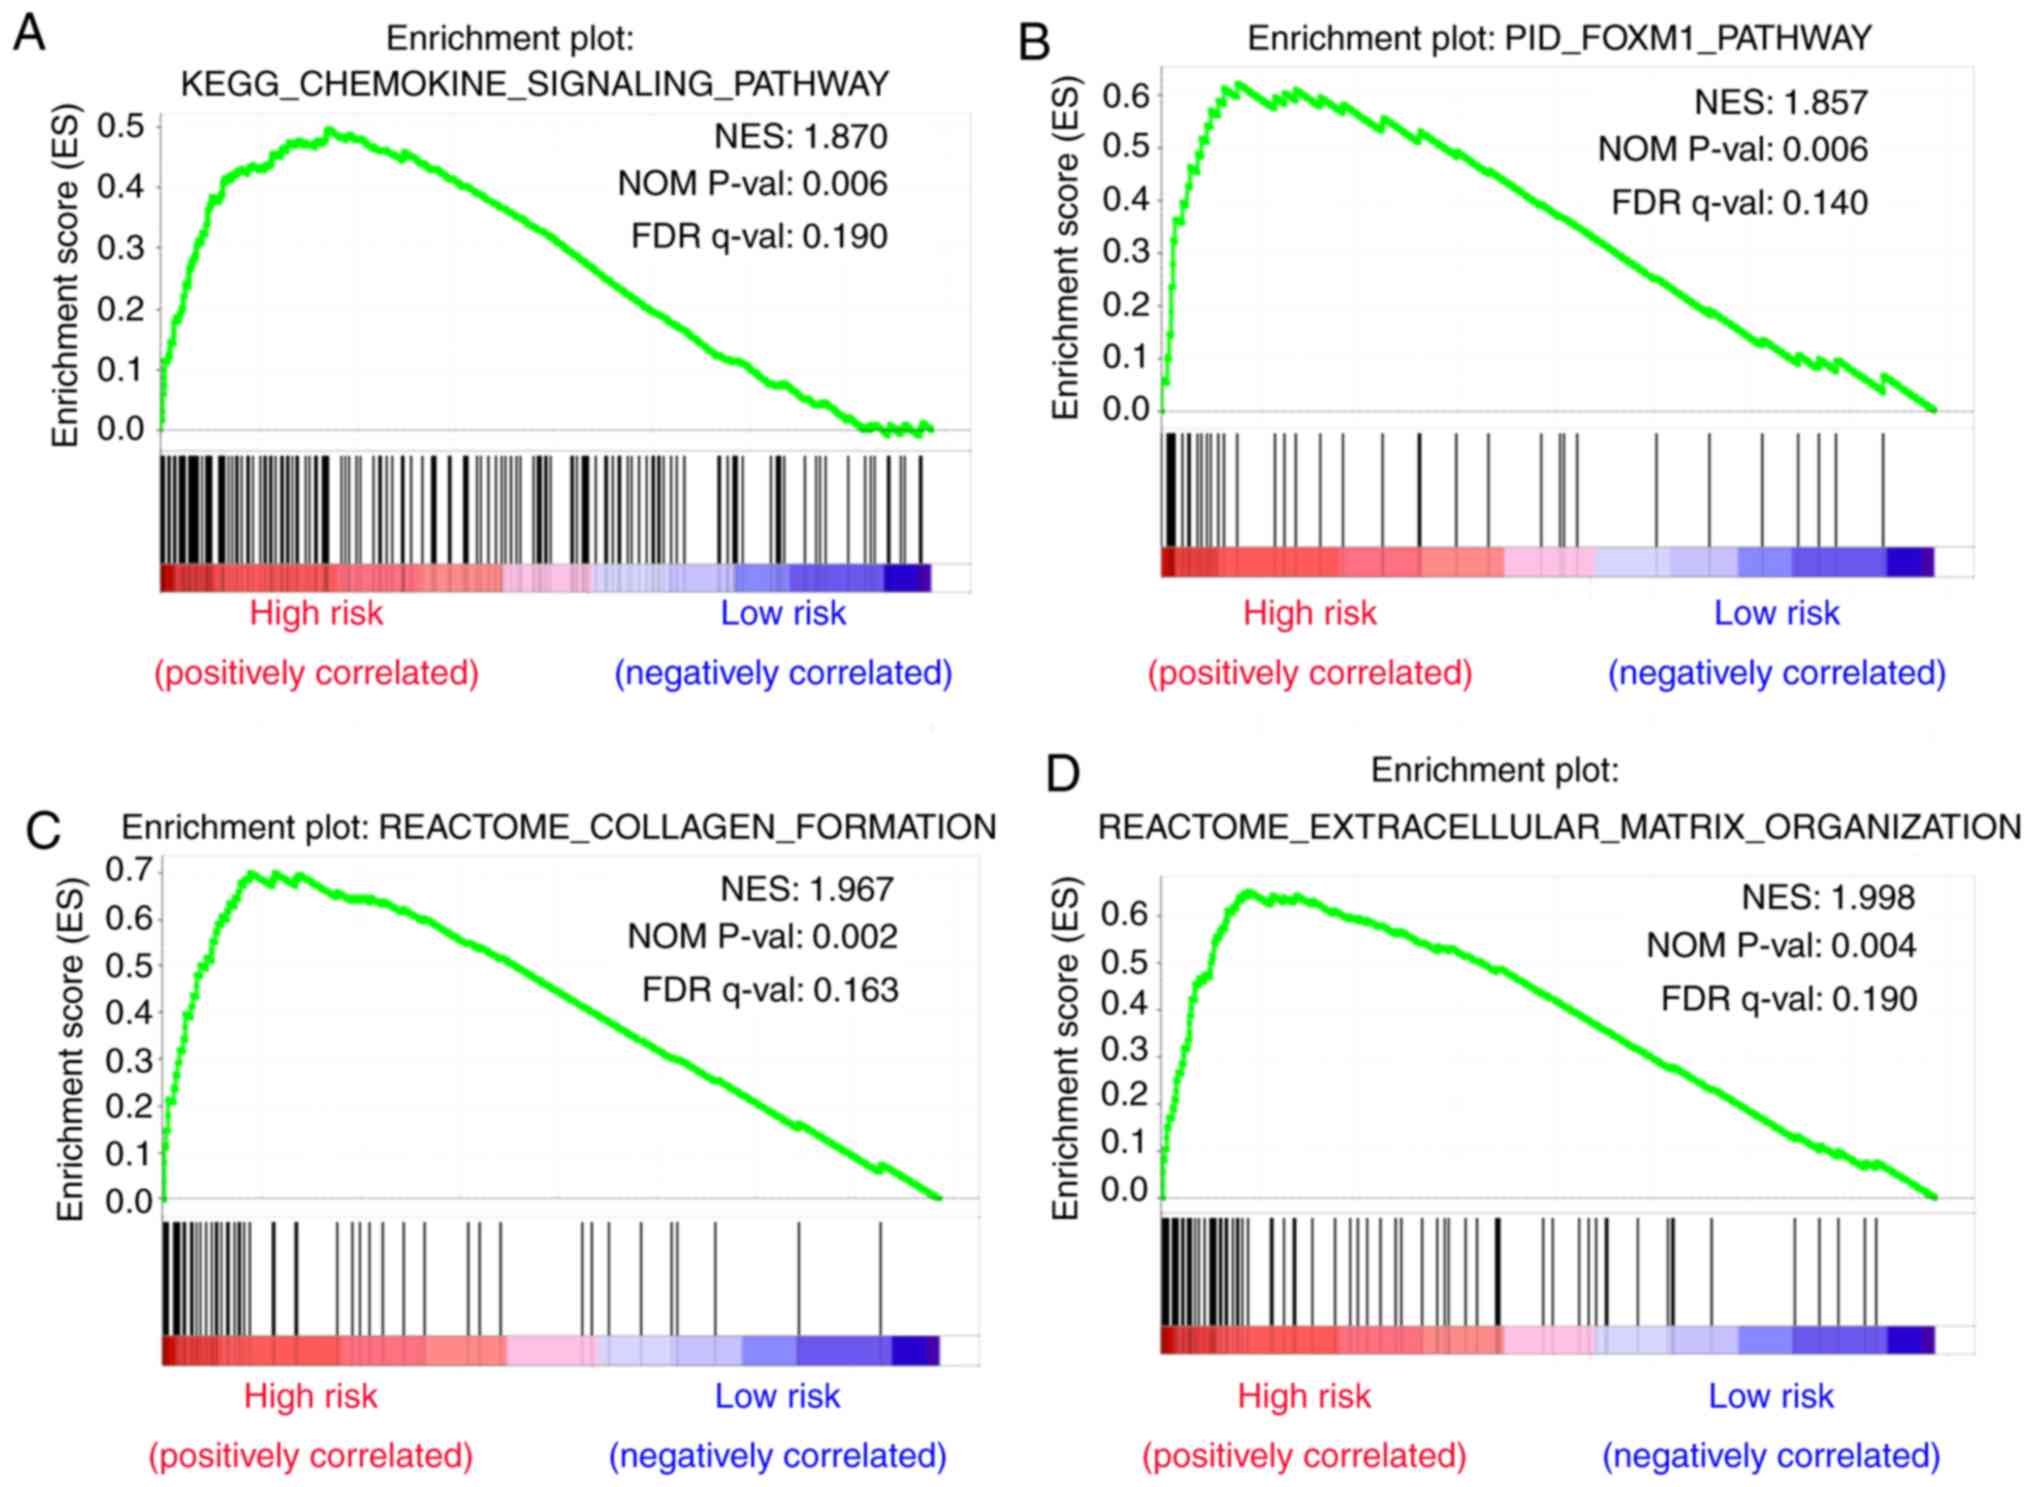
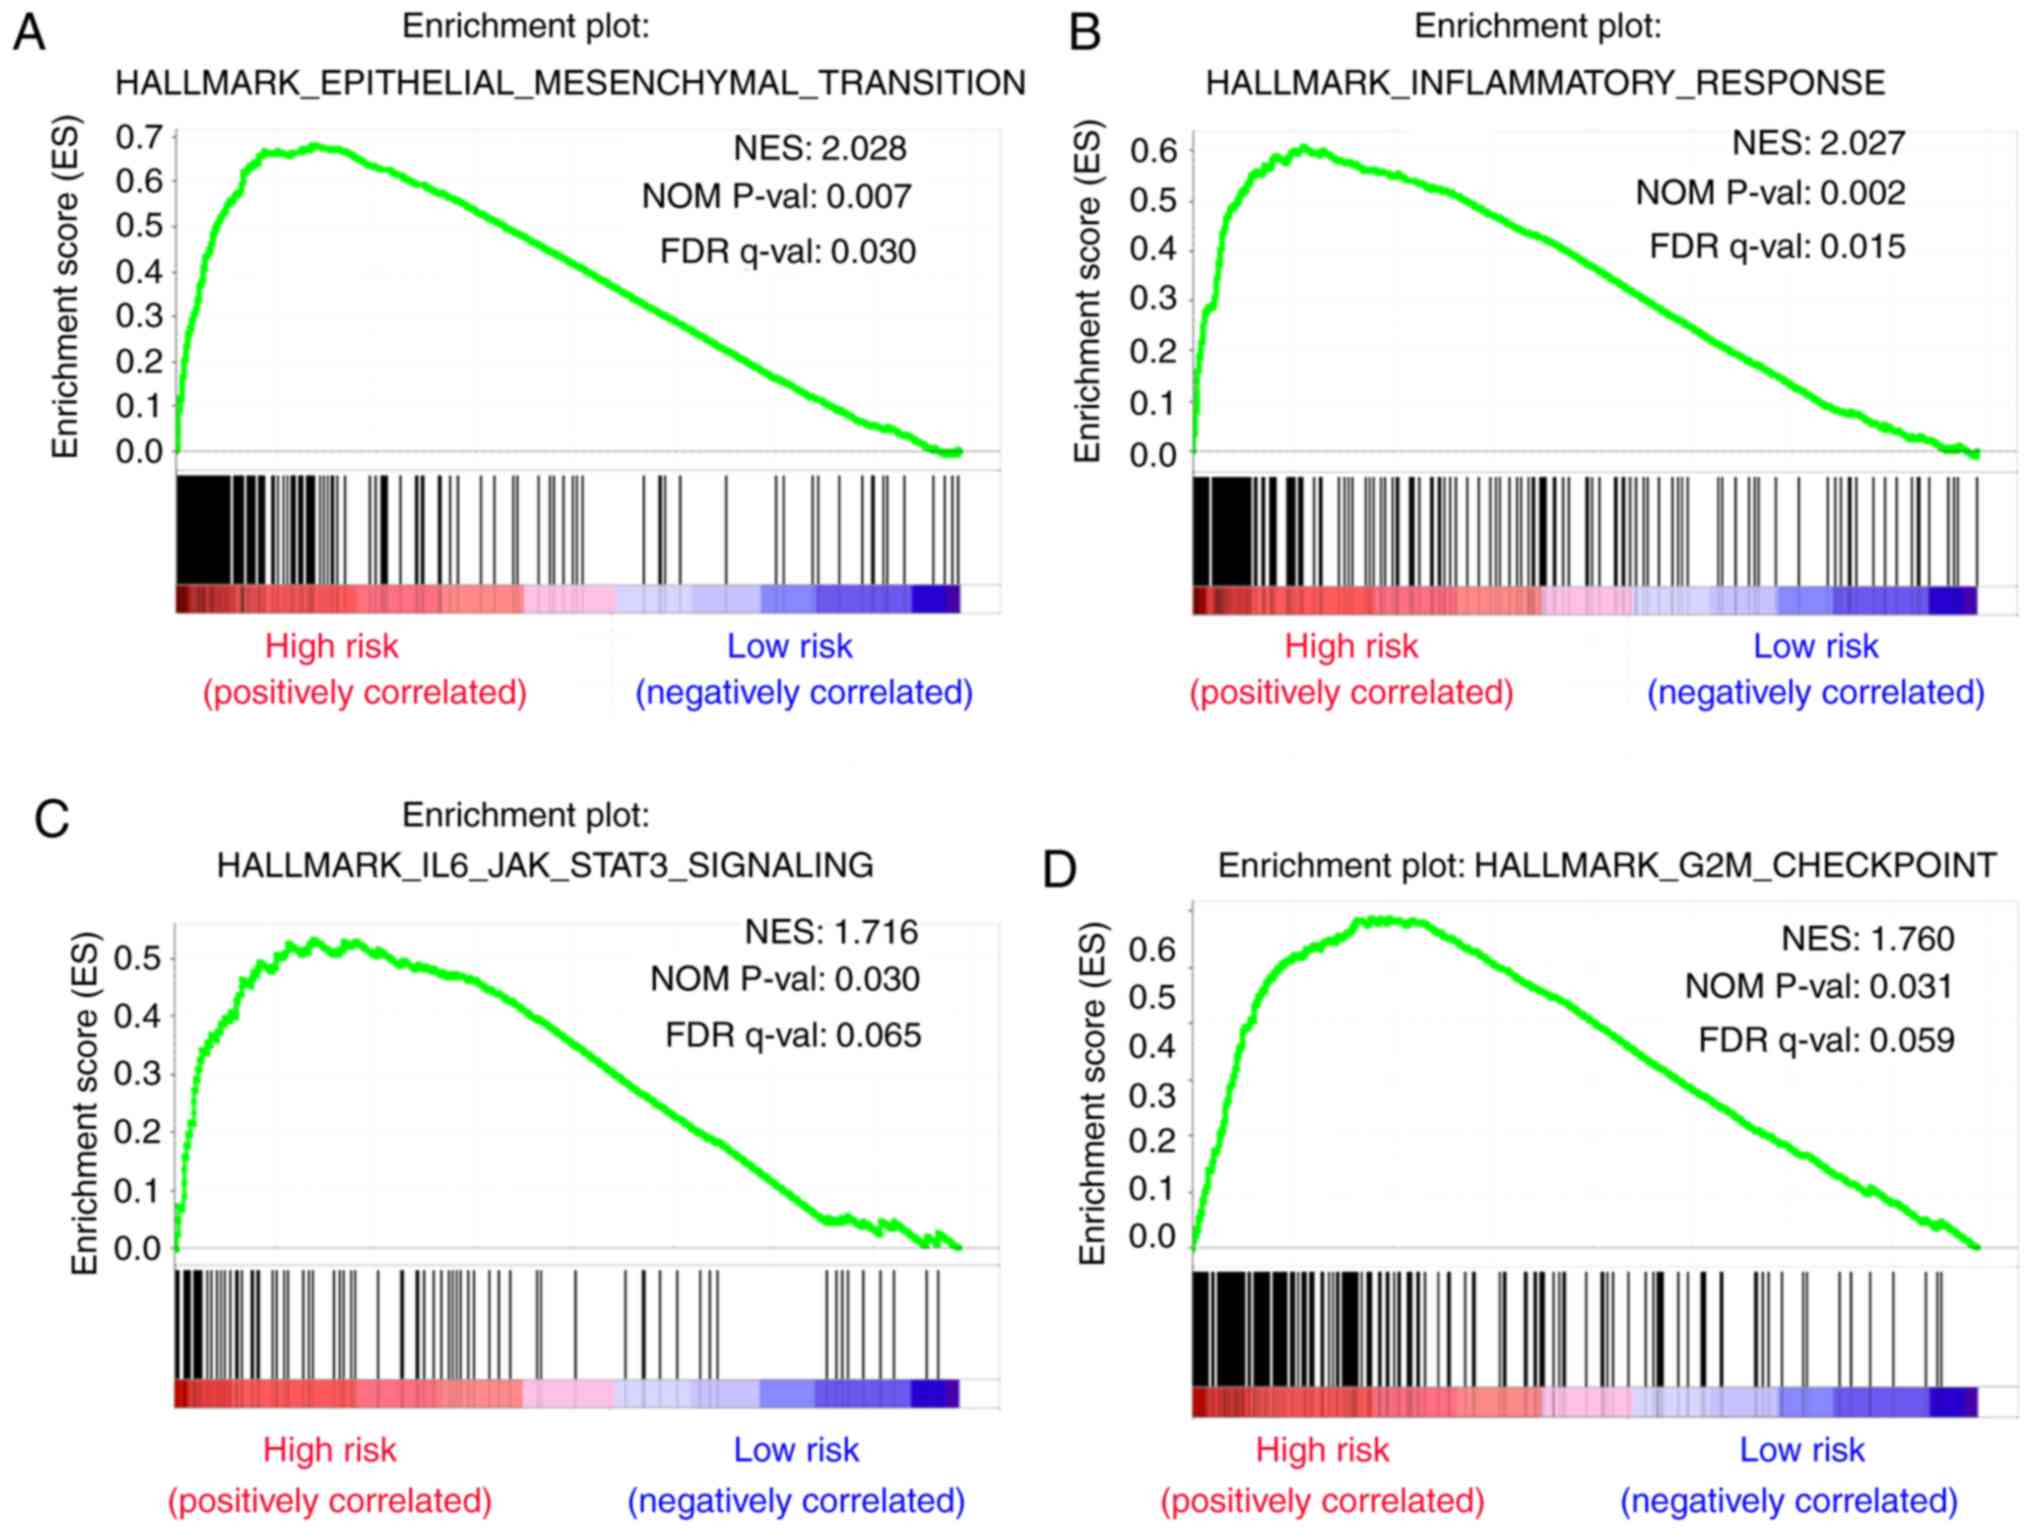
Analysis of biological processes and
signaling pathways
To identify dysregulated biological states and
signaling pathways involved in the development of bladder cancer,
GSEA was conducted with the use of 279 cases of subjects from TCGA
cohort that were classified into a high-risk group [n=146 (52.3%)]
and a low-risk group [n=133 (47.7%)] based on the established
cut-off value. Gene sets were considered significantly enriched on
the basis of NES, nominal P-value and FDR q-value. GSEA results
showed that several canonical pathways, such as ‘chemokine
signaling pathway’, ‘foxm1 pathway’, ‘collagen formation’ and
‘extracellular matrix organization’ that are involved in
extracellular signal transduction, were highly enriched in the
high-risk phenotype (Fig. 8A-D).
Additionally, gene sets of ‘Hallmark’ involving ‘epithelial
mesenchymal transition’, ‘inflammatory response’, ‘IL6-JAK-STAT3
signaling’ and ‘G2M checkpoint’ that are associated with biological
processes of cancers were also enriched in the high-risk group
(Fig. 9A-D).
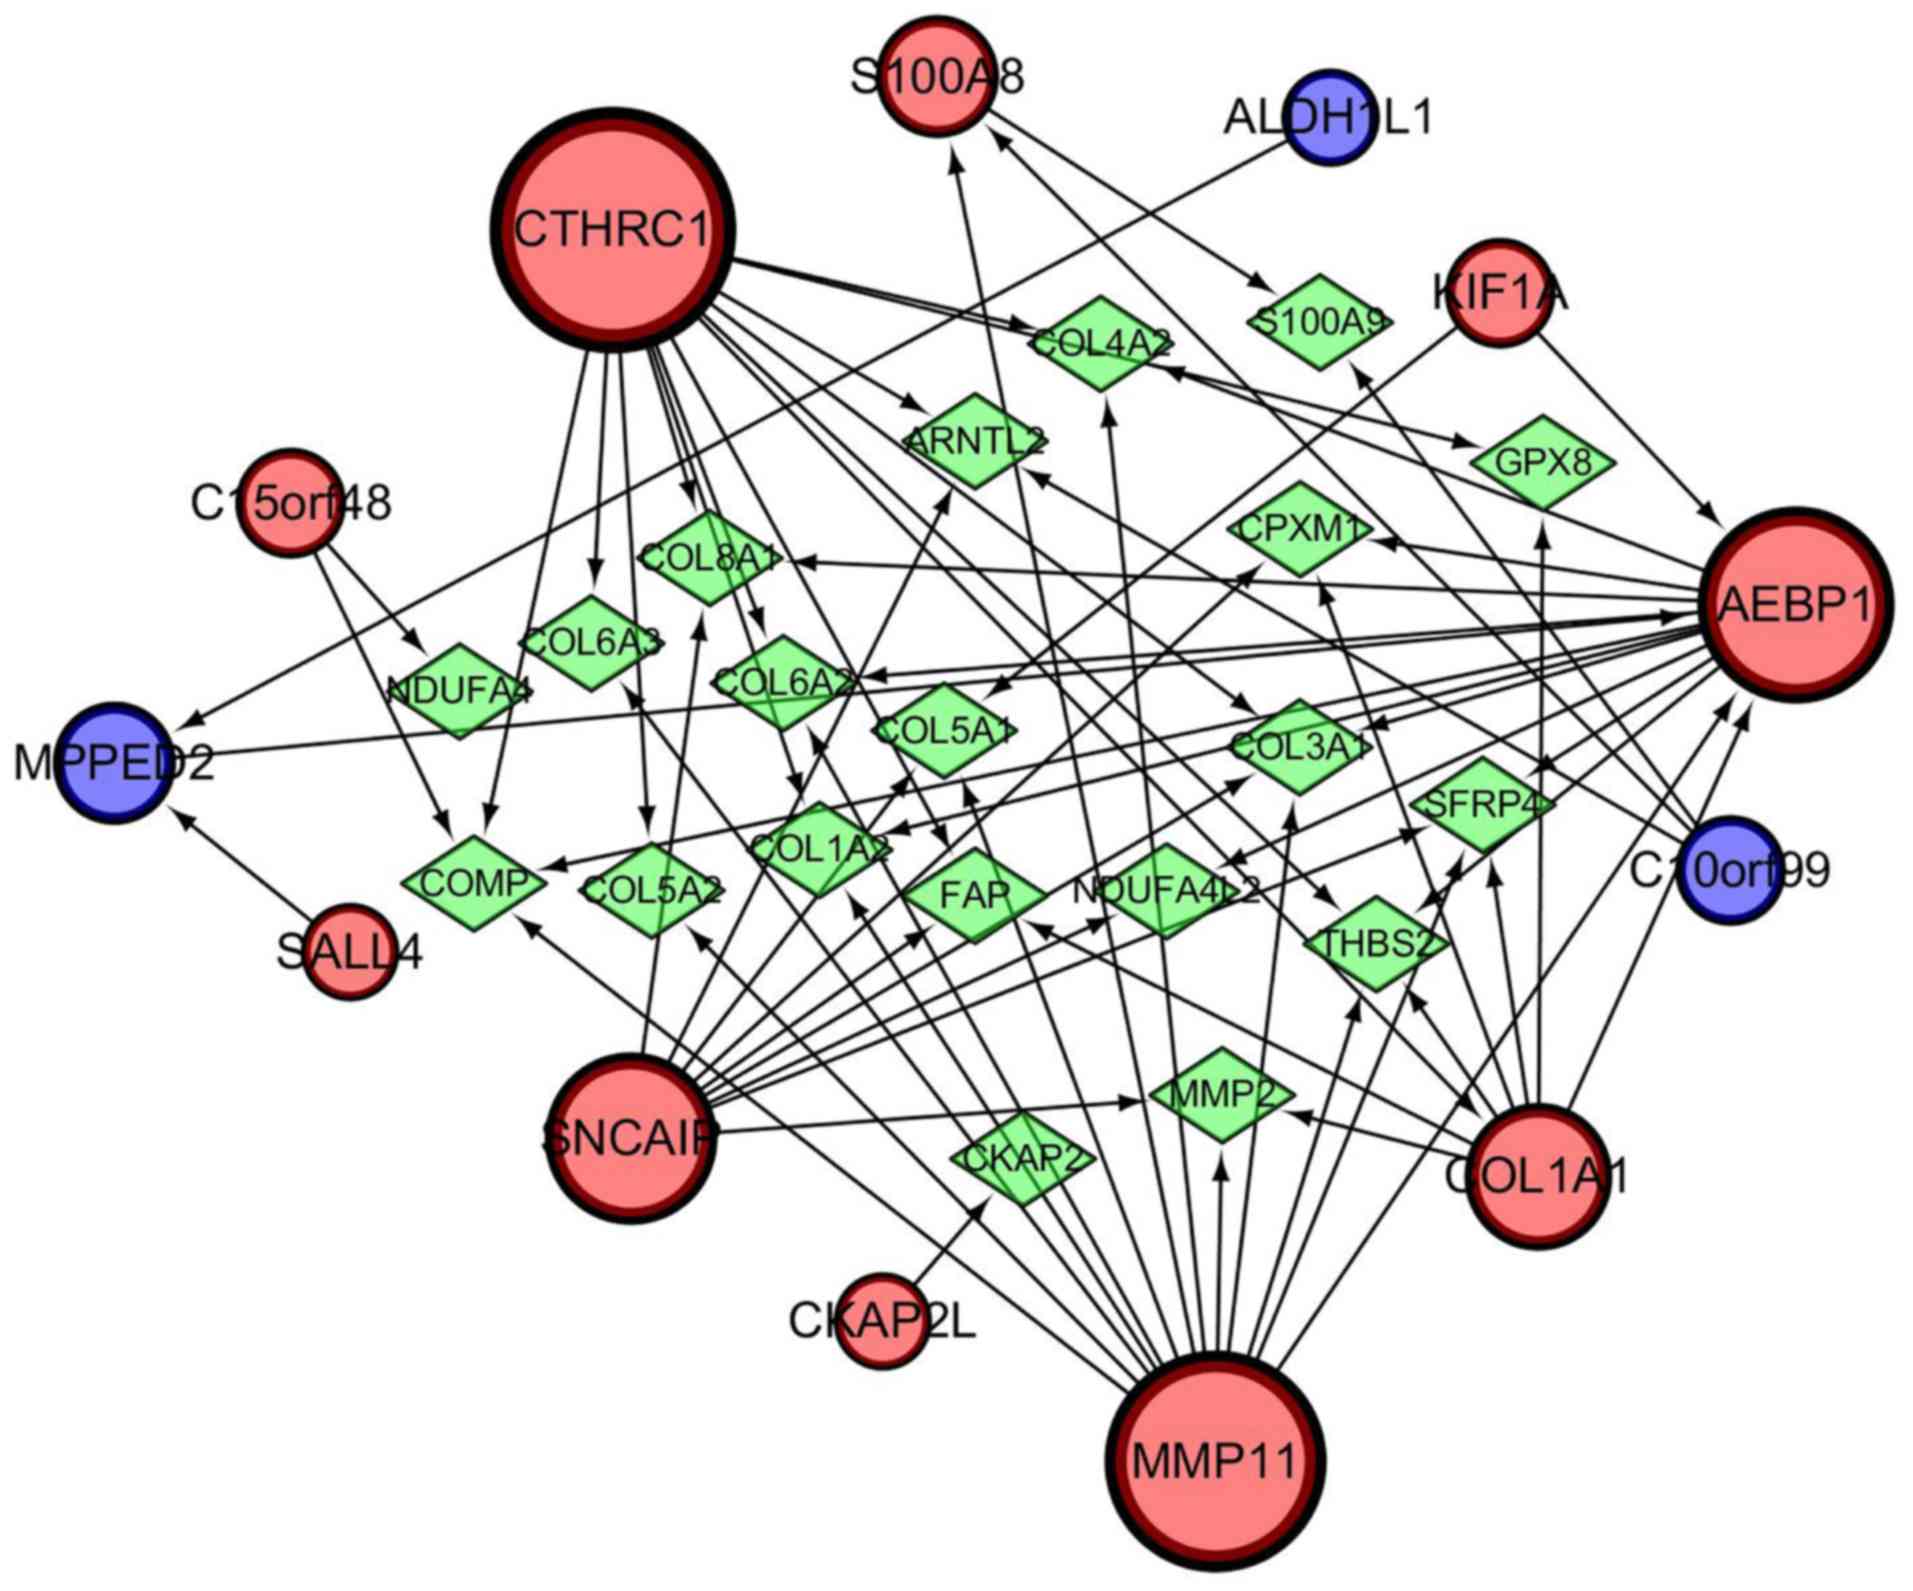
Identification and experimental
validation of hub genes in the 13-mRNA signature
A gene regulatory network was established by
GeneMANIA and visualized using Cytoscape software (ver. 3.5.1) to
determine the interrelationships between the 13 genes related to
progression and prognosis. The interaction network consisted of 33
genes, including 13 identified target genes and 20 additional genes
spontaneously pulled by GeneMANIA (Fig. 10). The hub genes identified with
the top six-node degree and betweenness were CTHRC1, MMP11,
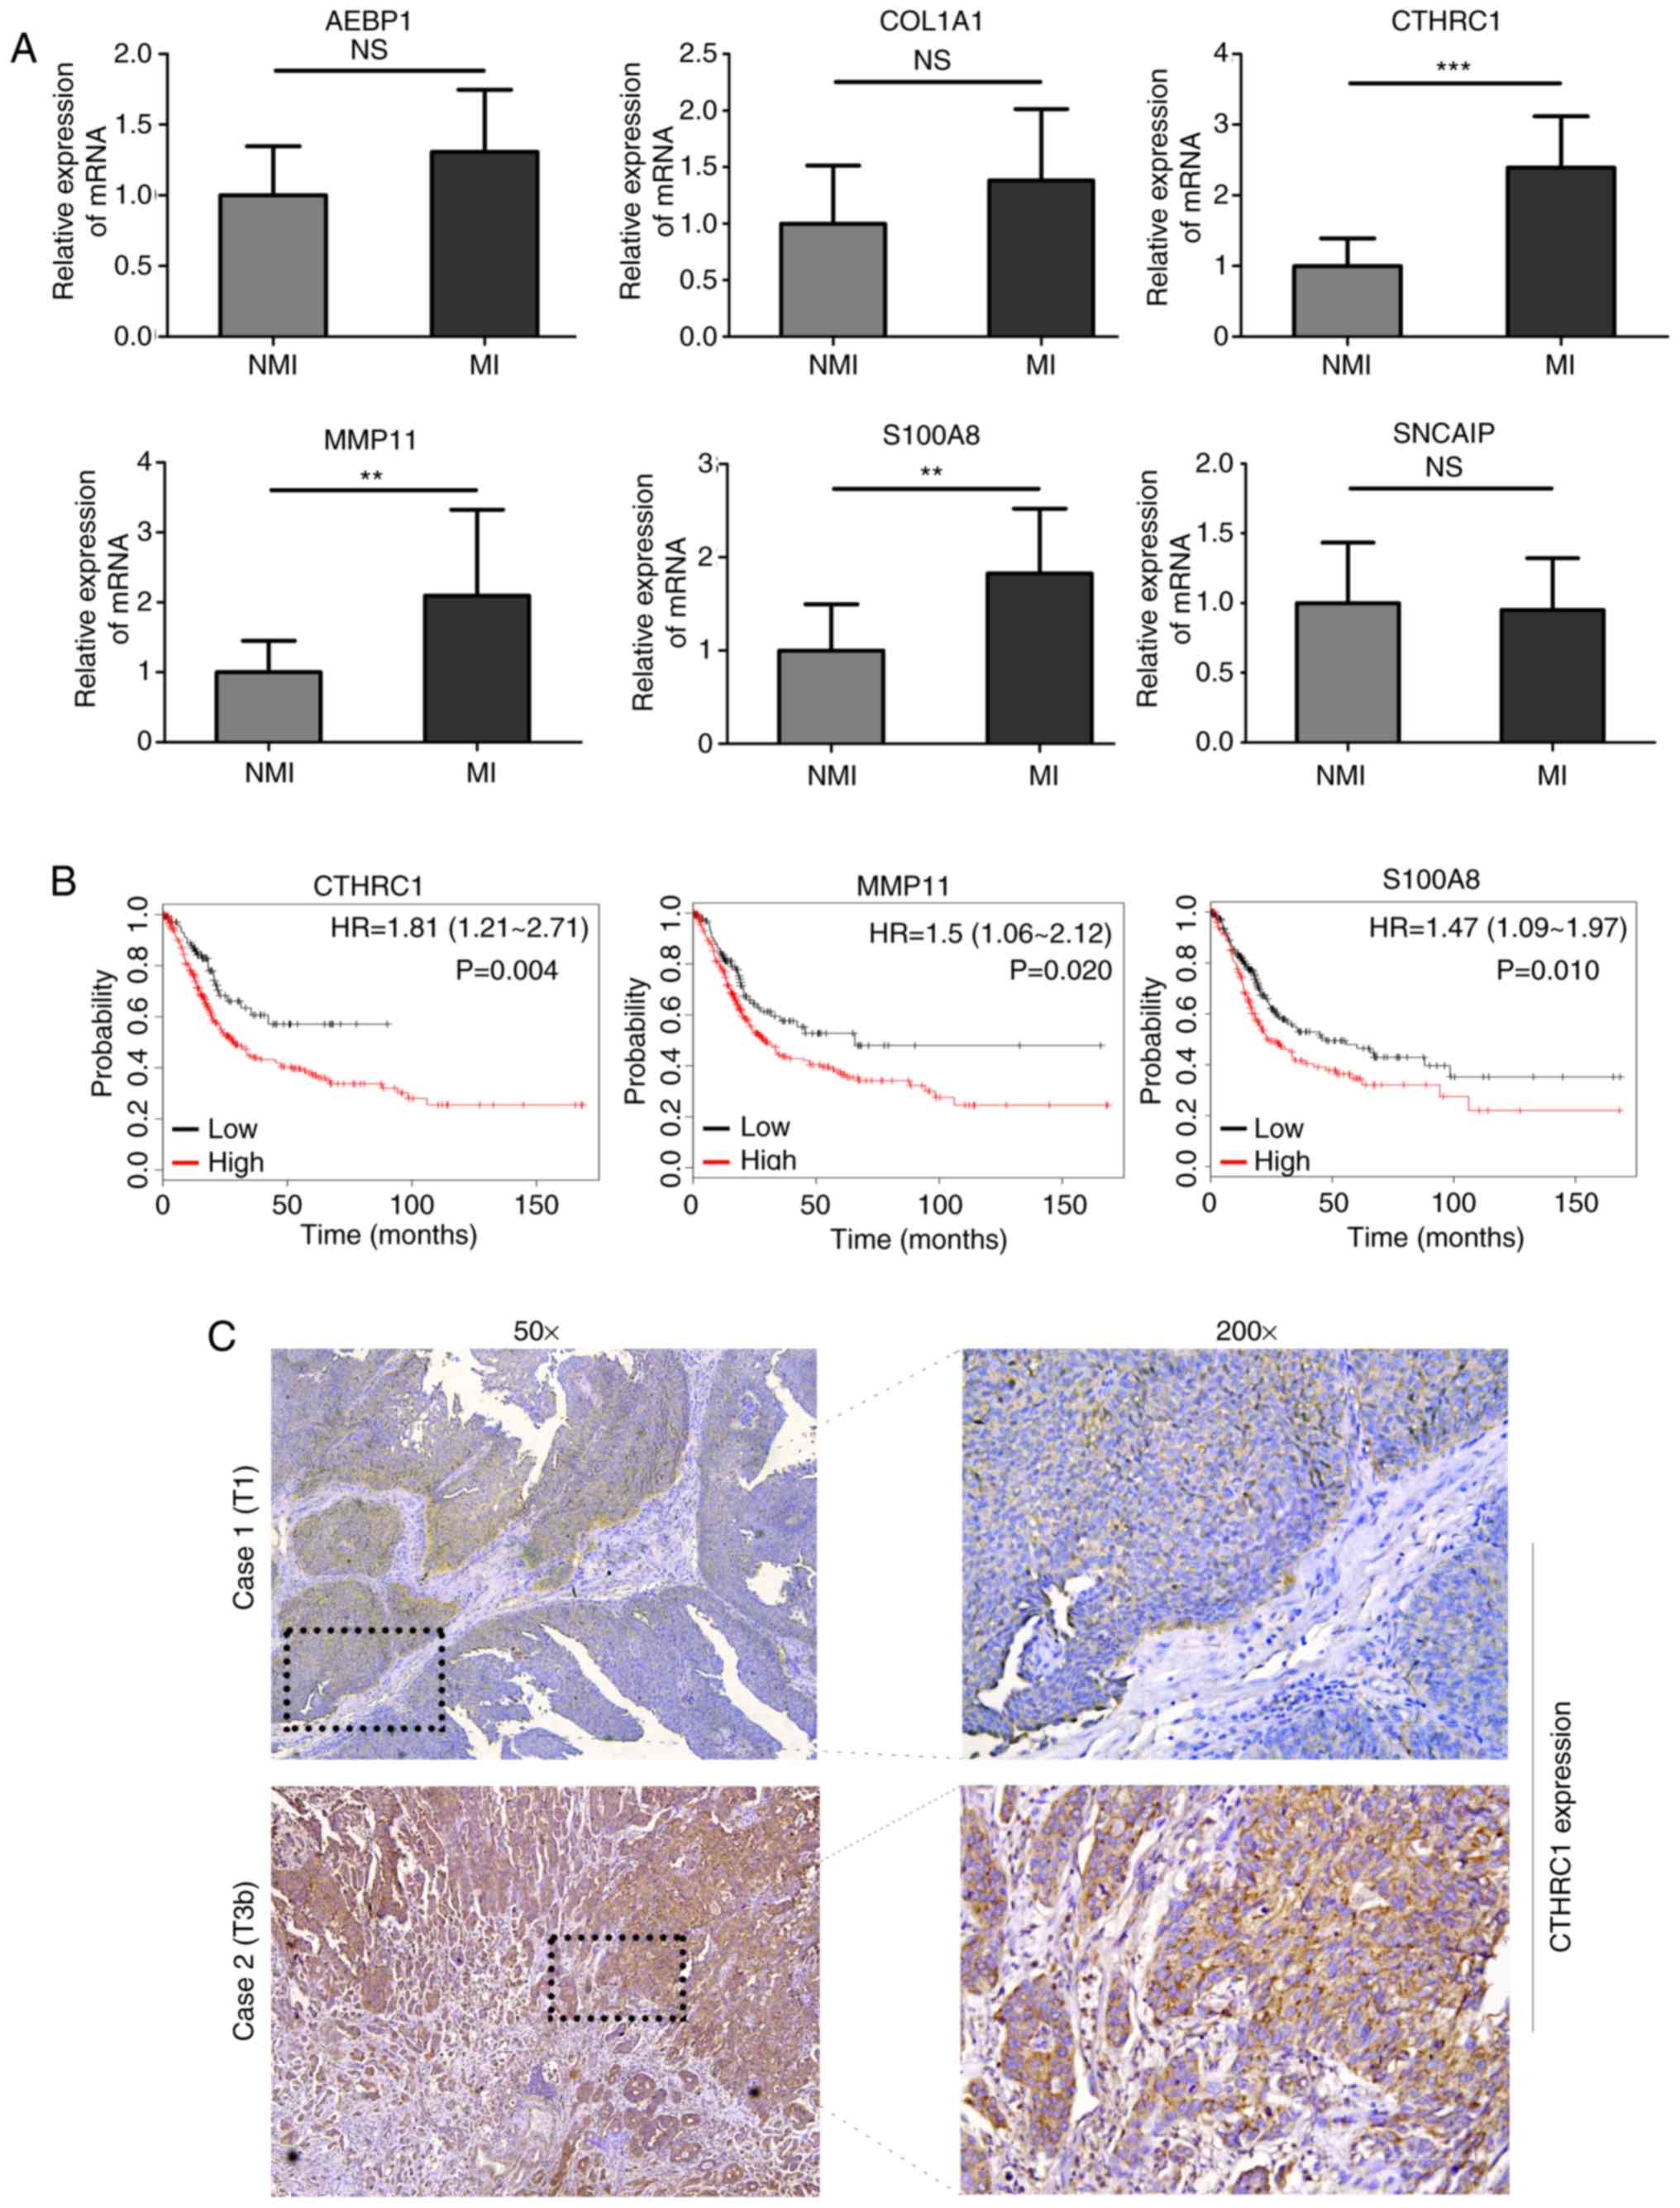
AEBP1, SNCAIP, COL1A1, and S100A8. We then measured the
difference in expression levels of the six hub genes between NMIBC
and MIBC tissues using RT-qPCR and found that the levels of
expression of CTHRC1, S100A8, and MMP11 in MIBC were
higher than that in NMIBC (Fig.
11A). A large TCGA cohort containing 404 patients with bladder
cancer in Kaplan-Meier plotter database was employed to assess the
prognostic significance of the three DEGs mentioned above. The
result suggested that high expression of CTHRC1, MMP11, and
S100A8 was correlated with poor OS (Fig. 11B). Considering the good
performance of CTHRC1 on the gene regulatory network and
prognosis, and the fact that few studies have focused on its role
in bladder cancer, the present study focused on this gene. Compared
with NMIBC samples, cytoplasmic and membranous CTHRC1
immunostaining was markedly enhanced in MIBC tissues (Fig. 11C), and high CTHRC1 expression was
observed in the majority of MIBC tissues (22/34) while in part of
non-invasive tumors (5/15), which was consistent with the result of
RT-qPCR and the trend seen in the GEO datasets. Detailed
information about clinical specimens is listed in Table IV. Furthermore, functional assay
indicated that CTHRC1 knockdown inhibited migration ability of 5637
and TCCSUP cells (Fig. S1),
suggesting CTHRC1 may be involved in the development and
progression of bladder cancer.
| Table IV.Clinicopathological parameters of
patients enrolled in the cohort. |
Table IV.
Clinicopathological parameters of
patients enrolled in the cohort.
|
Characteristics | Used for
RT-qPCR | Used for IHC |
|---|
| Number of
patients | 24 | 49 |
| Age (mean ±
SD) | 69.21±7.40 | 68.92±9.62 |
| Sex
(male/female) | 6/18 | 40/9 |
| Pathology grade
(low/high) | 7/17 | 11/38 |
| Tumor size (≤3
cm/>3 cm) | 15/9 | 26/23 |
| Subtype
(papillary/non-papillary) | 11/13 | 20/29 |
| T stage
(Ta-T1/T2-T4) | 12/12 | 15/34 |
| Lymph node
metastasis (no/yes) | 24/0 | 41/8 |
| TNM stage
(I/II/III/IV) | 12/9/3/0 | 15/18/9/7 |
Discussion
Comprehensive genomic studies on high-throughput RNA
sequence and microarray profiles have attracted considerable
attention for the prognostic prediction and exploration of
molecular mechanisms of a variety of diseases in recent years.
Progression of NMIBC to MIBC has been an unsolved life-threatening
problem, and cannot be accurately predicted with the use of
traditional clinicopathological parameters (15). Thus, identification of good
sensitive and specific novel biomarkers for predicting disease
progression of patients with NMIBC is of utmost clinical
significance in treatment decisions and follow-up regimens. In the
current study, a 13-mRNA signature was developed for both
prediction of disease progression and survival prediction of
patients with bladder cancer. Moreover, this model outperformed
other published gene signatures and biomarkers in two GEO datasets
included in the present study, demonstrating its considerable
reliability and robustness in predictive accuracy.
In total, 73 DEGs were identified between patients
with primary NMIBC and patients with progressive NMIBC, and
univariate Cox regression analysis was used to screen 47 prognostic
genes from those DEGs. However, this method is not suitable for
such high-dimensional microarray data due to the familiar
limitation of overfitting in selecting survival-related genes
(19). Therefore, the LASSO Cox
regression method that can eliminate the above limitation was
applied and a 13-mRNA-based risk score model that can separate
patients into low- and high-risk groups was constructed in the
training dataset and then verified in another independent GEO
dataset (for prediction of disease progression) and TCGA cohort
(for prediction of survival), which indicated its favorable
predictive prognostic performance.
Several novel multi-gene-based signatures and single
biomarkers for prediction of progression of NMIBC to MIBC have been
reported in recent years and comparison of the 13-mRNA signature
with them was conducted in our study (14–18).
The ROC curves indicated that the performance of the 13-mRNA
signature was similar to that of the 12-gene progression score
model, and superior to that of the 5-gene model and three other
single-gene biomarkers in two GEO datasets. Since the 12-gene model
was based on a large-scale multicenter prospective study, it had a
robust predictive power, and we paid particular attention to it.
The progression score model based on the expression levels of 12
genes detected by RT-qPCR assay correlated significantly with
outcome and had independent prognostic power when the model was
analyzed in combination with the European Organisation for Research
and Treatment of Cancer (EORTC) risk score. Moreover, the 12-gene
model was also significantly related to previous molecular classes
identified with basal- and luminal-like characteristics (20). Unfortunately, there are no
overlapping genes between our 13-mRNA signature and the 12-gene
progression score model, which may be attributed to the high
heterogeneity of bladder cancer and different statistical methods
used for constructing the signatures. Pearson's correlation
coefficient, ROC analysis, Wilcoxon signed-rank test and Cox
regression analysis were employed to identify the 12 genes for
inclusion in the ideal PCR signature by comparing normalized cycle
threshold (Ct) values and clinical outcomes (21), whereas DEGs in the primary NMIBC and
progressive NMIBC groups based on absolute fold change and adjusted
t-test P-value were screened for developing the 13-mRNA model using
univariate Cox regression and LASSO Cox regression methods.
Notably, the current histopathological system of evaluation is the
conventional system used to determine the prognosis of and to
stratify treatment of patients with bladder cancer. Both the 1973
and 2004 World Health Organization grading systems provide
independent clinical information for predicting disease progression
in patients with NMIBC (2). The ROC
curves in the present study showed that the 13-mRNA signature was
superior to the grading system with respect to prediction of
progression in the training and validation cohorts. Moreover, a
predictive nomogram, which combined the 13-mRNA signature and
available clinically related risk factors (gender and grade), was
developed to help guide prediction of prognosis and enable
clinicians to introduce an individualized therapeutic strategy for
patients with NMIBC.
Gene set enrichment analysis revealed the
differences in distinctive biological processes and signaling
pathways between the high- and low-risk subgroups stratified by the
13-gene signature in TCGA cohort. Several cancer-related pathways,
including the ‘FOXM1 pathway’, ‘extracellular matrix organization’,
‘epithelial mesenchymal transition’, ‘inflammatory response’ and
‘IL-6-JAK-STAT3’, which are involved in diverse functions that
promote carcinogenesis or metastasis, were significantly enriched
in the high-risk subgroup. The FOXM1 transcription factor, a member
of the Fox transcription factor family, plays vital role in
carcinogenesis via regulation of proliferation, cell cycle,
transformation and apoptosis (22).
FOXM1 facilitated to cell viability, migration and invasion of
bladder cancer cells through reducing p27 level and increasing VEGF
expression (23). High expression
of FOXM1 was associated with adverse clinical features, including
pathological grade, TNM stage, concomitant carcinoma in situ
and multifocal tumors, and predicted a risk of luminal subtype with
worse outcomes in patients with stage pT1 NMIBC (24). Emerging evidence supports the
hypothesis that inflammation is one of the hallmark characteristics
of cancer development and progression. Inflammatory cytokines, such
as IL-6, S100A8, and TGF-β, play an essential role in cancer
progression by directly interacting with tumor cells, promoting
epithelial-to-mesenchymal transition and driving distant metastasis
(25). As common markers of
systemic inflammatory response, neutrophil-to-lymphocyte ratio
(NLR) and C-reactive protein (CRP) were associated with disease
progression in patients with NMIBC (26).
There were 6 hub genes screened from the 13-mRNA
signature and 3 of 6 of them that were detected by RT-qPCR were
further identified as target genes, which were differentially
expressed between NMIBC and MIBC tissues. CTHRC1, a secreted
glycosylated protein, has been found to be aberrantly upregulated
in various human malignant cancers and involved in cellular
processes related to cancer development and metastasis. Forced
expression of CTHRC1 is closely associated with carcinogenesis and
bone metastasis in breast cancer (27). Upregulation of CTHRC1 driven by
N-glycosylation contributes to cell migration in oral squamous cell
carcinoma through the non-canonical Wnt/planar cell polarity (PCP)
signaling pathway (28). However,
the expression patterns and biological functions of CTHRC1 in
bladder cancer have not been well investigated and remain largely
unclear. Here we found that expression of CTHRC1 was higher in
invasive bladder cancer than the non-invasive subtype at mRNA and
protein levels, and the Kaplan-Meier analysis showed that patients
with high CTHRC1 expression had an unfavorable prognosis. In
addition, Transwell assay has revealed that CTHRC1 deletion
by specific small interfering RNA (siRNA) markedly reduced
migration and invasion activities of 5637 and TCCSUP cells (data
not shown), which may be attributed to aberrant MEK/ERK
phosphorylation stimulated by rCTHRC1 (data not shown). S100A8 is
one of the family members of calcium-binding proteins that
regulates inflammatory responses and can drive proliferation and
invasion of cancer cells by binding to the receptor for advanced
glycation end-products (RAGE) to activate mitogen-activated protein
kinase (MAPK) and nuclear factor kappa-light-chain-enhancer of
activated B cells (NF-κB) signaling pathways (29). Elevated S100A8 expression has
been observed in multiple cancers, including bladder cancer.
Several studies have devoted to explore the value of S100A8 being a
biomarker for diagnosis and prediction of prognosis in bladder
cancer. A prognostic signature based on S100A8-correlated
genes can predict disease progression, and patients with NMIBC with
high S100A8 cluster are more likely to progress to MIBC
(30), indicating that
S100A8 might be a novel promising biomarker of bladder
cancer outcome. Using multiple comprehensive approaches of protein
detection, Bansal et al (31) found that S100A8 and S100A9 were able
to precisely discriminate over 80% of bladder cancer patients
compared to healthy controls, with high sensitivity and specificity
(ROC, 0.946). In addition, with a comparable tactic, S100A8 and
S100A4 were able to distinguish 92% of low-grade cases from
high-grade, with utmost sensitivity and specificity (ROC, 0.941).
Immunohistochemistry assay was performed to test S100A8 expression
in NMIBC, data showed that S100A8 expression was significantly
higher in pT1 and high-grade tumors than in pTa and low-grade, and
it remained an independent factor for RFS (P=0.024, HR 2.43) and
PFS (P=0.002, HR 5.92) according to the multivariate Cox regression
model (32). Those results suggest
that S100A8 is a promising marker for identification of bladder
cancer patients at high risk of recurrence and progression, which
supports our main viewpoint that S100A8 as a member of 13-mRNA
signature can be a novel potential biomarker for diagnosis and
prediction of prognosis in patients with bladder cancer. As for the
role and mechanism of S100A8 in bladder cancer, we think the
relative research is necessary but independent of this manuscript.
Recent studies have reported MMP11 as a marker of lymph node
metastasis and predictor of poor survival in bladder cancer. Li
et al found increased MMP-11 protein expression was related
to increments of pathologic stage status, a stepwise increment of
MMP11expression from normal urothelium and non-invasive urothelial
carcinoma to superficially invasive subtype, and to high stage
urothelial carcinoma. The expression of MMP-11 is positively
related to high cancer-specific mortality and metastasis in bladder
transitional cell carcinoma (33).
Coincidentally, MMP11 was identified as a member of a
five-mRNA-based classifier developed for predicting lymph node
metastasis in bladder cancer (34).
Those results suggest that MMP11 is a promising biomarker for
prediction of patients with bladder cancer.
This study, however, has several limitations. First,
this study is retrospective in nature, which may have resulted in a
selection bias, and the sample size was insufficient in the
training and validation datasets. The results of our study,
therefore, need further validation in large prospective clinical
trials. Secondly, information on clinical factors, like age,
intravesical therapy, survival status and follow-up time was not
available in the validation dataset; thus, only two parameters (sex
and grade) that exist in both datasets were collected and combined
with the 13-mRNA signature to construct a nomogram. This requires
further verification in different cohorts in the future. Finally,
more detailed studies are still needed to explore the biological
roles and molecular mechanisms of the genes incorporated in the
integrated signature in bladder cancer.
In conclusion, we have developed an integrated
13-mRNA signature for prediction of progression of NMIBC to MIBC
and prognostication. The prognostic value of the 13-mRNA signature
for PFS and OS, and a nomogram based on the model might be useful
for clinicians to select personalized therapy for patients with
bladder cancer. Furthermore, the gene signature could also provide
insights into the underlying molecular mechanisms of development
and progression of bladder cancer.
Supplementary Material
Supporting Data
Acknowledgements
The authors would like to thank the Chongqing Key
Laboratory of Molecular Oncology and Epigenetics (Chongqing, China)
for technical guidance.
Funding
This study was supported by National Natural Science
Foundation of China (No. 81874092), National Natural Science
Foundation of China Youth Fund (No. 81801482) and Chongqing Science
& Technology Commission (No. cstc2017shmsA130098 and No.
cstc2019jcyj-msxmX0126).
Availability of data and materials
The datasets used and/or analyzed during the current
study are available from the corresponding author on reasonable
request.
Authors' contributions
CZ and DG conceived and designed the study. HY
performed the procedures of bioinformatics analysis and wrote the
initial manuscript. XG and WH were involved in the conception of
the study and edited the manuscript. All authors read and approved
the final manuscript.
Ethics approval and consent to
participate
The present study was approved by the Ethics
Committee of the First Affiliated Hospital of Chongqing Medical
University (Chongqing, China), and written informed consent was
obtained from all patients.
Patient consent for publication
Not applicable.
Competing interests
The authors declare that there are no conflicts of
interest.
References
|
1
|
Bray F, Ferlay J, Soerjomataram I, Siegel
RL, Torre LA and Jemal A: Global cancer statistics 2018: GLOBOCAN
estimates of incidence and mortality worldwide for 36 cancers in
185 countries. CA Cancer J Clin. 68:394–424. 2018. View Article : Google Scholar : PubMed/NCBI
|
|
2
|
Burger M, van der Aa MN, van Oers JM,
Brinkmann A, van der Kwast TH, Steyerberg EC, Stoehr R, Kirkels WJ,
Denzinger S, Wild PJ, et al: Prediction of progression of
non-muscle-invasive bladder cancer by WHO 1973 and 2004 grading and
by FGFR3 mutation status: A prospective study. Eur Urol.
54:835–843. 2008. View Article : Google Scholar : PubMed/NCBI
|
|
3
|
Lamm D, Persad R, Brausi M, Buckley R,
Witjes JA, Palou J, Böhle A, Kamat AM, Colombel M and Soloway M:
Defining progression in nonmuscle invasive bladder cancer: It is
time for a new, standard definition. J Urol. 191:20–27. 2014.
View Article : Google Scholar : PubMed/NCBI
|
|
4
|
Sylvester RJ, van der Meijden AP,
Oosterlinck W, Witjes JA, Bouffioux C, Denis L, Newling DW and
Kurth K: Predicting recurrence and progression in individual
patients with stage Ta T1 bladder cancer using EORTC risk tables: A
combined analysis of 2596 patients from seven EORTC trials. Eur
Urol. 49:466–465. 2006. View Article : Google Scholar : PubMed/NCBI
|
|
5
|
Le Goux C, Vacher S, Pignot G, Sibony M,
Barry Delongchamps N, Terris B, Piaggio E, Zerbib M, Damotte D and
Bieche I: mRNA Expression levels of genes involved in antitumor
immunity: Identification of a 3-gene signature associated with
prognosis of muscle-invasive bladder cancer. Oncoimmunology.
6:e13583302017. View Article : Google Scholar : PubMed/NCBI
|
|
6
|
Sanchez-Carbayo M, Socci ND, Lozano J,
Saint F and Cordon-Cardo C: Defining molecular profiles of poor
outcome in patients with invasive bladder cancer using
oligonucleotide microarrays. J Clin Oncol. 24:778–789. 2006.
View Article : Google Scholar : PubMed/NCBI
|
|
7
|
Yang L, Taylor J, Eustace A, Irlam JJ,
Denley H, Hoskin PJ, Alsner J, Buffa FM, Harris AL, Choudhury A and
West CML: A gene signature for selecting benefit from hypoxia
modification of radiotherapy for high-risk bladder cancer patients.
Clin Cancer Res. 23:4761–4768. 2017. View Article : Google Scholar : PubMed/NCBI
|
|
8
|
Lee JS, Leem SH, Lee SY, Kim SC, Park ES,
Kim SB, Kim SK, Kim YJ, Kim WJ and Chu IS: Expression signature of
E2F1 and its associated genes predict superficial to invasive
progression of bladder tumors. J Clin Oncol. 28:2660–2667. 2010.
View Article : Google Scholar : PubMed/NCBI
|
|
9
|
Gautier L, Cope L, Bolstad BM and Irizarry
RA: Affy-analysis of Affymetrix GeneChip data at the probe level.
Bioinformatics. 20:307–315. 2004. View Article : Google Scholar : PubMed/NCBI
|
|
10
|
Subramanian A, Tamayo P, Mootha VK,
Mukherjee S, Ebert BL, Gillette MA, Paulovich A, Pomeroy SL, Golub
TR, Lander ES and Mesirov JP: Gene set enrichment analysis: A
knowledge-based approach for interpreting genome-wide expression
profiles. Proc Natl Acad Sci USA. 102:15545–15550. 2005. View Article : Google Scholar : PubMed/NCBI
|
|
11
|
Warde-Farley D, Donaldson SL, Comes O,
Zuberi K, Badrawi R, Chao P, Franz M, Grouios C, Kazi F, Lopes CT,
et al: The GeneMANIA prediction server: Biological network
integration for gene prioritization and predicting gene function.
Nucleic Acids Res. 38:W214–W220. 2010. View Article : Google Scholar : PubMed/NCBI
|
|
12
|
Livak KJ and Schmittgen TD: Analysis of
relative gene expression data using real-time quantitative PCR and
the 2(-Delta Delta C(T)) method. Methods. 25:402–408. 2001.
View Article : Google Scholar : PubMed/NCBI
|
|
13
|
Yin H, Yang X, Gu W, Liu Y, Li X, Huang X,
Zhu X, Tao Y, Gou X and He W: HMGB1-mediated autophagy attenuates
gemcitabine-induced apoptosis in bladder cancer cells involving JNK
and ERK activation. Oncotarget. 8:71642–71656. 2017. View Article : Google Scholar : PubMed/NCBI
|
|
14
|
van der Heijden AG, Mengual L, Lozano JJ,
Ingelmo-Torres M, Ribal MJ, Fernández PL, Oosterwijk E, Schalken
JA, Alcaraz A and Witjes JA: A five-gene expression signature to
predict progression in T1G3 bladder cancer. Eur J Cancer.
64:127–136. 2016. View Article : Google Scholar : PubMed/NCBI
|
|
15
|
Dyrskjøt L, Reinert T, Algaba F,
Christensen E, Nieboer D, Hermann GG, Mogensen K, Beukers W,
Marquez M, Segersten U, et al: Prognostic impact of a 12-gene
progression score in non-muscle-invasive bladder cancer: A
prospective multicentre validation study. Eur Urol. 72:461–469.
2017. View Article : Google Scholar : PubMed/NCBI
|
|
16
|
Rinaldetti S, Wirtz R, Worst TS, Hartmann
A, Breyer J, Dyrskjot L and Erben P: FOXM1 predicts disease
progression in non-muscle invasive bladder cancer. J Cancer Res
Clin Oncol. 144:1701–1709. 2018. View Article : Google Scholar : PubMed/NCBI
|
|
17
|
Kramer MW, Golshani R, Merseburger AS,
Knapp J, Garcia A, Hennenlotter J, Duncan RC, Soloway MS, Jorda M,
Kuczyk MA, et al: HYAL-1 hyaluronidase: A potential prognostic
indicator for progression to muscle invasion and recurrence in
bladder cancer. Eur Urol. 57:86–93. 2010. View Article : Google Scholar : PubMed/NCBI
|
|
18
|
Lelo A, Prip F, Harris BT, Solomon D,
Berry DL, Chaldekas K, Kumar A, Simko J, Jensen JB, Bhattacharyya
P, et al: STAG2 is a biomarker for prediction of recurrence and
progression in papillary non-muscle-invasive bladder cancer. Clin
Cancer Res. 24:4145–4153. 2018. View Article : Google Scholar : PubMed/NCBI
|
|
19
|
Simon R and Altman DG: Statistical aspects
of prognostic factor studies in oncology. Br J Cancer. 69:979–985.
1994. View Article : Google Scholar : PubMed/NCBI
|
|
20
|
Hedegaard J, Lamy P, Nordentoft I, Algaba
F, Høyer S, Ulhøi BP, Vang S, Reinert T, Hermann GG, Mogensen K, et
al: Comprehensive transcriptional analysis of early-stage
urothelial carcinoma. Cancer Cell. 30:27–42. 2016. View Article : Google Scholar : PubMed/NCBI
|
|
21
|
Dyrskjøt L, Reinert T, Novoradovsky A,
Zuiverloon TC, Beukers W, Zwarthoff E, Malats N, Real FX, Segersten
U, Malmström PU, et al: Analysis of molecular intra-patient
variation and delineation of a prognostic 12-gene signature in
non-muscle invasive bladder cancer; technology transfer from
microarrays to PCR. Br J Cancer. 107:1392–1398. 2012. View Article : Google Scholar : PubMed/NCBI
|
|
22
|
Dai J, Yang L, Wang J, Xiao Y and Ruan Q:
Prognostic value of FOXM1 in patients with malignant solid tumor: A
meta-analysis and system review. Dis Markers. 2015:3524782015.
View Article : Google Scholar : PubMed/NCBI
|
|
23
|
Yang X, Shi Y, Yan J and Fan H:
Downregulation of FoxM1 inhibits cell growth and migration and
invasion in bladder cancer cells. Am J Transl Res. 10:629–638.
2018.PubMed/NCBI
|
|
24
|
Breyer J, Wirtz RM, Erben P, Rinaldetti S,
Worst TS, Stoehr R, Eckstein M, Sikic D, Denzinger S, Burger M, et
al: FOXM1 overexpression is associated with adverse outcome and
predicts response to intravesical instillation therapy in stage pT1
non-muscle-invasive bladder cancer. BJU Int. 123:187–196. 2019.
View Article : Google Scholar : PubMed/NCBI
|
|
25
|
Diakos CI, Charles KA, McMillan DC and
Clarke SJ: Cancer-related inflammation and treatment effectiveness.
Lancet Oncol. 15:e493–e503. 2014. View Article : Google Scholar : PubMed/NCBI
|
|
26
|
Mbeutcha A, Shariat SF, Rieken M, Rink M,
Xylinas E, Seitz C, Lucca I, Mathieu R, Rouprêt M, Briganti A, et
al: Prognostic significance of markers of systemic inflammatory
response in patients with non-muscle-invasive bladder cancer. Urol
Oncol. 34:483.e17–483.e24. 2016. View Article : Google Scholar
|
|
27
|
Kharaishvili G, Cizkova M, Bouchalova K,
Mgebrishvili G, Kolar Z and Bouchal J: Collagen triple helix repeat
containing 1 protein, periostin and versican in primary and
metastatic breast cancer: An immunohistochemical study. J Clin
Pathol. 64:977–982. 2011. View Article : Google Scholar : PubMed/NCBI
|
|
28
|
Liu G, Sengupta PK, Jamal B, Yang HY,
Bouchie MP, Lindner V, Varelas X and Kukuruzinska MA:
N-glycosylation induces the CTHRC1 protein and drives oral cancer
cell migration. J Biol Chem. 288:20217–20227. 2013. View Article : Google Scholar : PubMed/NCBI
|
|
29
|
Miller P, Kidwell KM, Thomas D, Sabel M,
Rae JM, Hayes DF, Hudson BI, El-Ashry D and Lippman ME: Elevated
S100A8 protein expression in breast cancer cells and breast tumor
stroma is prognostic of poor disease outcome. Breast Cancer Res
Treat. 166:85–94. 2017. View Article : Google Scholar : PubMed/NCBI
|
|
30
|
Kim SK, Kim EJ, Leem SH, Ha YS, Kim YJ and
Kim WJ: Identification of S100A8-correlated genes for prediction of
disease progression in non-muscle invasive bladder cancer. BMC
Cancer. 10:212010. View Article : Google Scholar : PubMed/NCBI
|
|
31
|
Bansal N, Gupta A, Sankhwar SN and Mahdi
AA: Low- and high-grade bladder cancer appraisal via serum-based
proteomics approach. Clin Chim Acta. 436:97–103. 2014. View Article : Google Scholar : PubMed/NCBI
|
|
32
|
Nicklas AP, Kramer MW, Serth J,
Hennenlotter J, Hupe MC, Reimer DU, Stenzl A, Merseburger AS,
Kuczyk MA and von Klot CJ: Calgranulin A (S100A8) immunostaining: A
future candidate for risk assessment in patients with
non-muscle-invasive bladder cancer (NMIBC). Adv Ther. 35:2054–2068.
2018. View Article : Google Scholar : PubMed/NCBI
|
|
33
|
Li WM, Wei YC, Huang CN, Ke HL, Li CC, Yeh
HC, Chang LL, Huang CH, Li CF and Wu WJ: Matrix
metalloproteinase-11 as a marker of metastasis and predictor of
poor survival in urothelial carcinomas. J Surg Oncol. 113:700–707.
2016. View Article : Google Scholar : PubMed/NCBI
|
|
34
|
Wu SX, Huang J, Liu ZW, Chen HG, Guo P,
Cai QQ, Zheng JJ, Qin HD, Zheng ZS, Chen X, et al: A
genomic-clinicopathologic nomogram for the preoperative prediction
of lymph node metastasis in bladder cancer. EBioMedicine. 31:54–65.
2018. View Article : Google Scholar : PubMed/NCBI
|