Introduction
Ovarian cancer is a frequently diagnosed gynecologic
cancer with a high mortality rate; the estimated annual incidence
of this disease worldwide is >200,000 individuals, with ~125,000
deaths (1,2), and as it is difficult to detect at an
early stage, the majority of patients are diagnosed at an advanced
stage (3). Although advances in
chemotherapy, radiotherapy, surgery and targeted therapy have
achieved progress in the treatment of ovarian cancer (4), the 5-year OS rate of patients with
advanced disease is ~30% (5,6).
Clinicopathological features such as histological grade and the
International Federation of Gynecology and Obstetrics (FIGO)
staging system are widely used prognostic indicators for ovarian
cancer (7); however, they are not
effective in predicting the survival and chemotherapy response in
patients with ovarian cancer (8,9).
Currently, no fully validated and clinically applicable tests are
available for guiding ovarian cancer treatment decisions. Previous
studies have demonstrated that the progression of ovarian cancer is
associated with a variety of pathways involved in energy
metabolism, including galactose metabolism, which is associated
with the risk of developing ovarian cancer (10,11),
and that adipocytes promote ovarian cancer metastasis and provide
energy for rapid tumor growth (12). Therefore, studying local energy
metabolism status and its prognostic value for patients with
ovarian cancer may help improve the prediction of clinical outcomes
of ovarian cancer and provide reference for personalized medical
treatment.
The early observations by Dr Otto Warburg revealed
that fundamental metabolic differences existed between malignant
tumor cells and adjacent normal cells (13). Other studies also reported the
association between altered cellular metabolism and therapeutic
outcomes (14–17). Energy metabolism reprogramming,
which is a hallmark of cancer, allows tumor cells to produce ATP to
maintain the reduction-oxidation balance and biomolecular synthesis
required for cell growth, proliferation and migration (18). The metabolic phenotype of cancer
cells is heterogeneous; a number of tumor cells are mainly
dependent on glycolysis, whereas others exhibit a metabolic
phenotype characterized by oxidative phosphorylation (OXPHOS)
(19,20). Increasing evidence has demonstrated
that glycolysis and oxidation have a symbiotic metabolic
relationship in tumor cells; for example, lactic acid and pyruvate
produced by glycolysis can be transferred to and used as a
substrate for tricarboxylic acid (TCA) intermediates and ATP
production in adjacent cancer cells (21). Similarly, malignant tumor cells
utilize free fatty acids and ketones released by neighboring
catabolic cells for energy production (12,22),
which can also be realized by glutamine metabolization through TCA
cycle (23). Mitochondrial OXPHOS,
driven by glutamine, is a major source for ATP synthesis under
hypoxic conditions (24). These
observations suggest that targeting particular metabolic pathways
in cancer may be an effective strategy for cancer therapy.
Therefore, an in-depth understanding of energy metabolism in tumors
may contribute to the development of new therapies.
Previous studies have demonstrated that metabolic
abnormalities lead to different prognosis of patients, and
metabolism-related genes can be used as prognostic markers of
tumors. For example, Wu et al (25) have demonstrated that lipid
metabolism-related genes can predict the prognosis of patients with
glioma. Zhou et al (26)
identified a 29 energy metabolism-related gene signature, including
interleukin-4, carbohydrate sulfotransferases and branched chain
amino acid transaminase 1 (BCAT1), to evaluate the prognosis of
diffuse glioma. Genes related to amino acid metabolism such as
BCAT2, glutamate-cysteine ligase catalytic subunit and aminoadipate
aminotransferase can also predict the prognosis of glioma (27). Ma et al (28) have reported that metabolic
deregulations mediate the dedifferentiation of papillary thyroid
carcinoma and developed a metabolic gene signature that may be used
as a biomarker for dedifferentiated thyroid cancer. Disorders in
the metabolic pathway of sputum may affect the progression of
breast cancer (29). Liu et
al (30) developed a signature
of four metabolic genes to predict the overall survival (OS) of
patients with liver cancer. However, the expression patterns of
metabolism-related genes in ovarian cancer are still unclear, and
it is thus necessary to study metabolism-related gene
characteristics in ovarian cancer.
The aim of the present study was to identify ovarian
cancer molecular subtypes based on energy metabolism-related genes
and gene signatures of energy metabolism markers to improve the
current understanding of the molecular mechanisms in ovarian cancer
energy metabolism and clinical prognosis.
Materials and methods
Data collection and processing
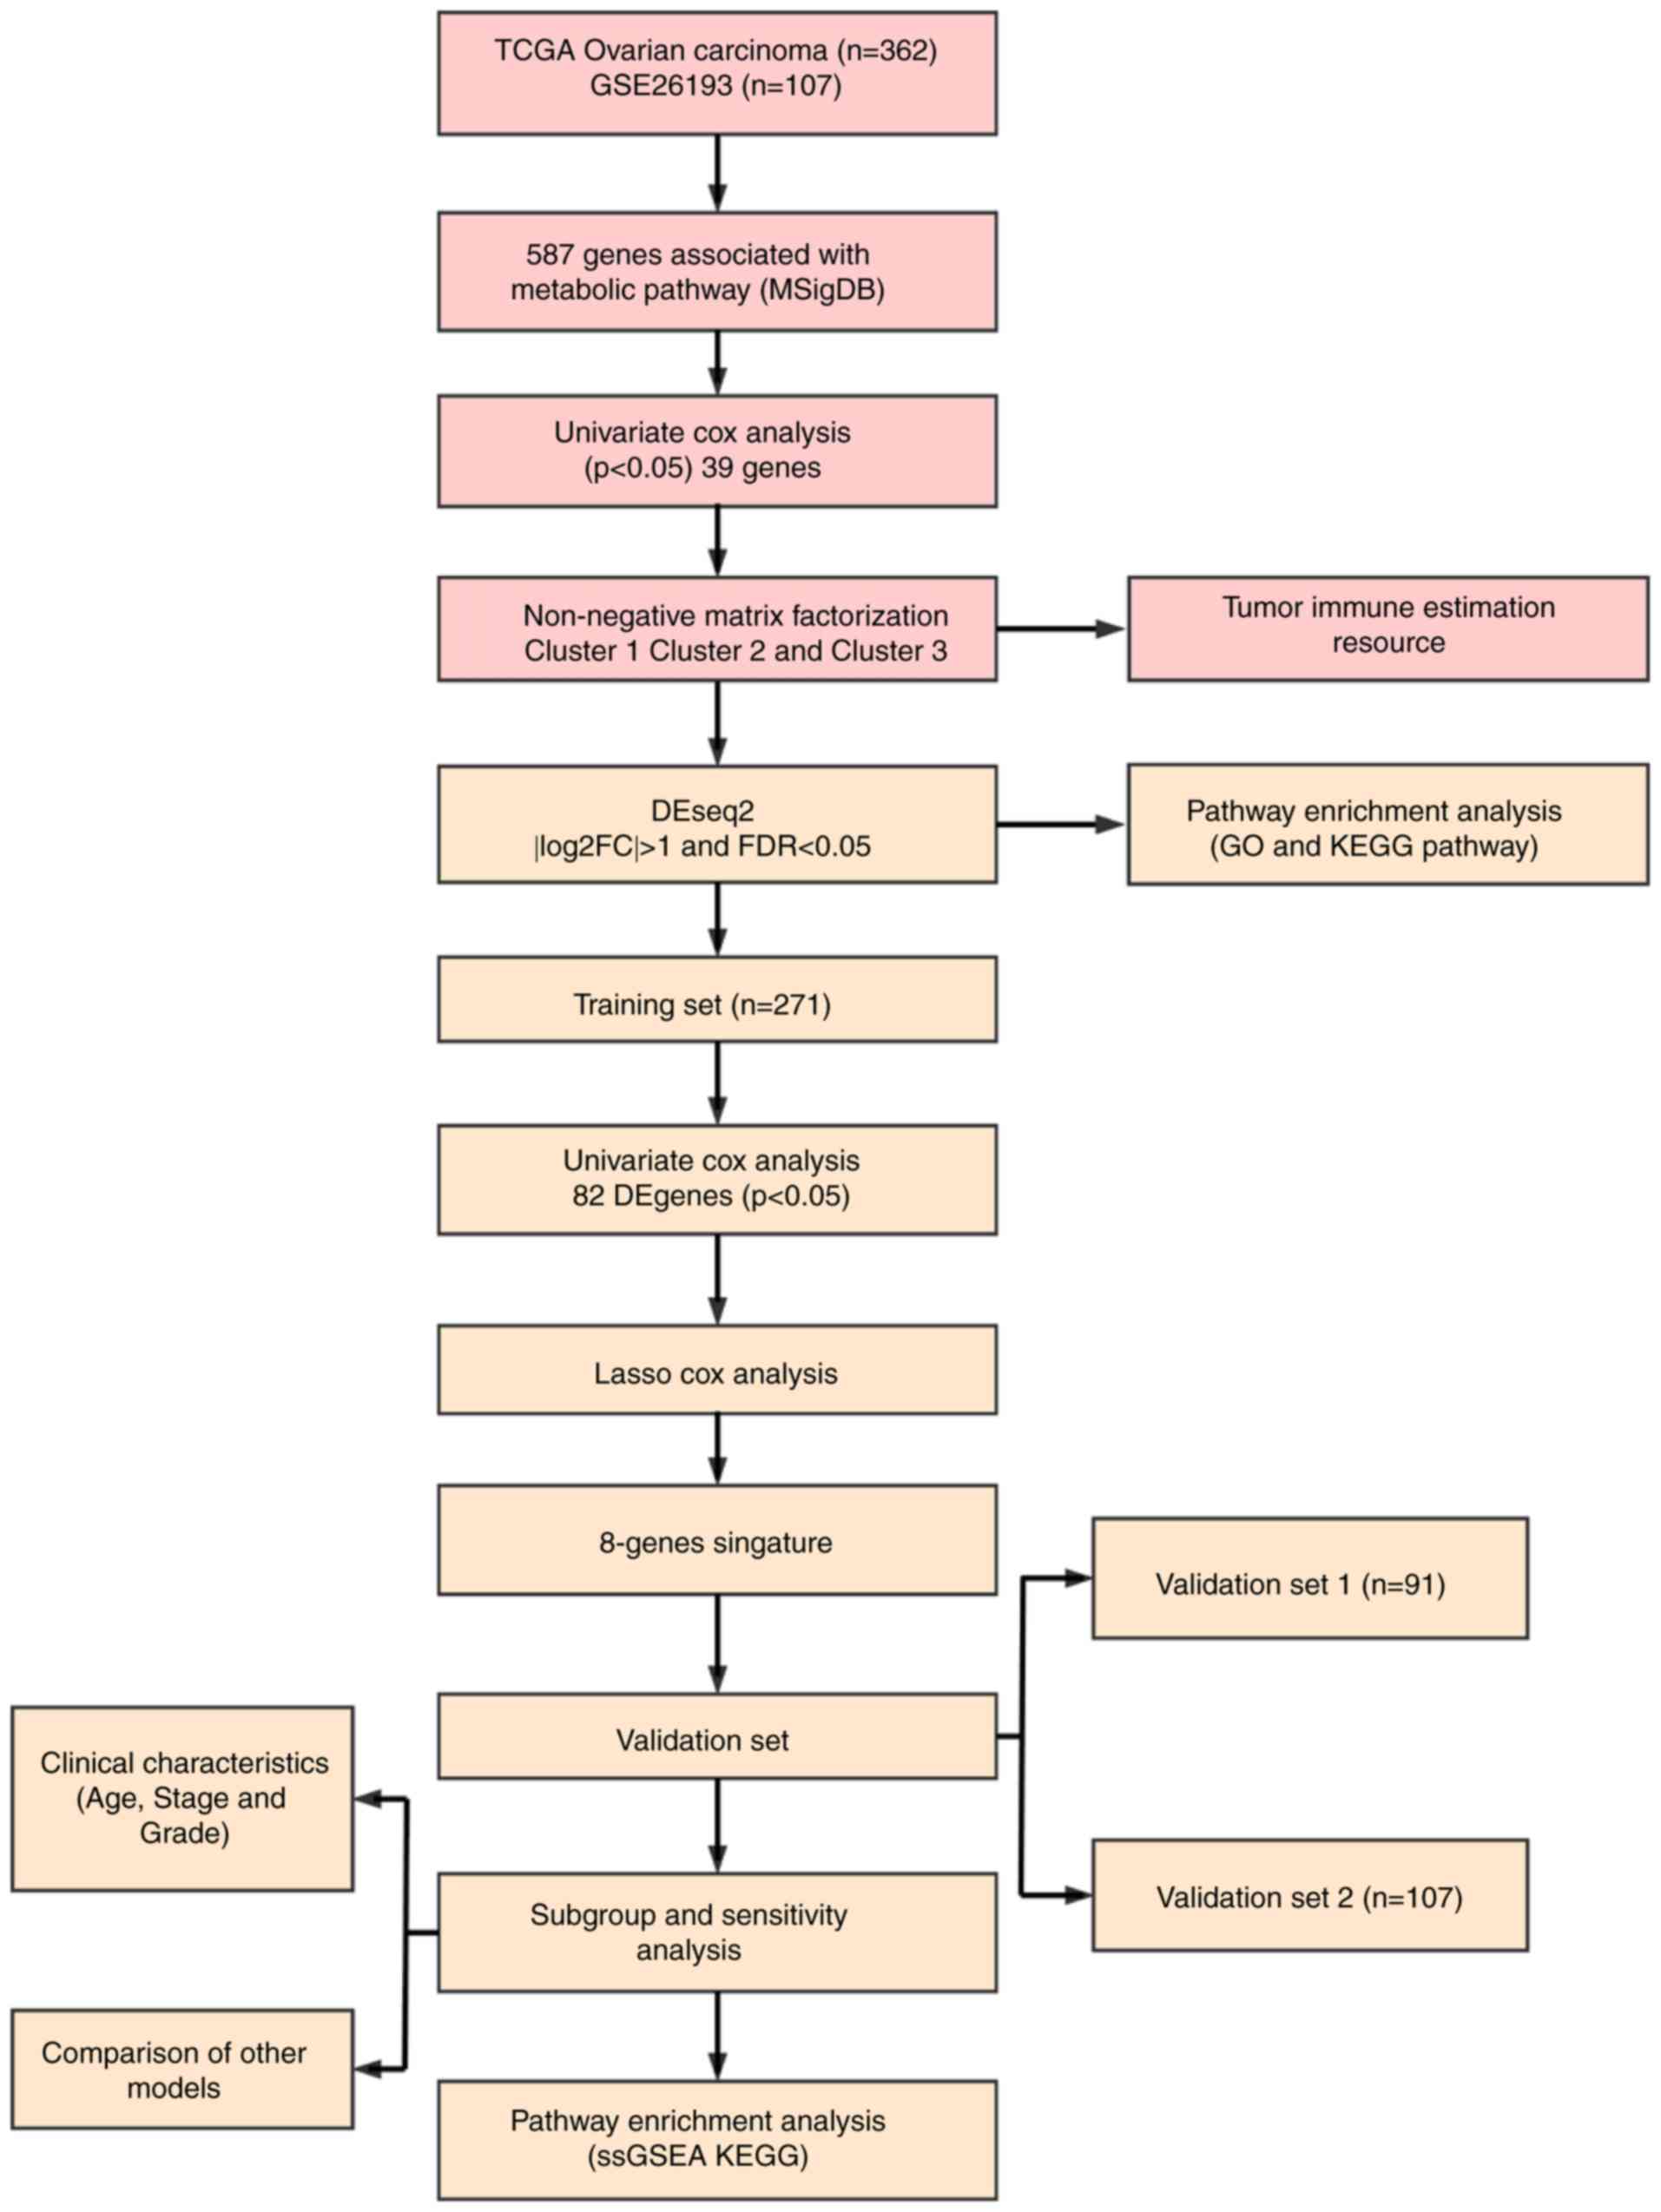
The latest clinical follow-up information of 587
ovarian cancer cases and RNA-seq data from 379 cases were
downloaded from The Cancer Genome Atlas (TCGA; http://www.cancer.gov/about-nci/organization/ccg/research/structural-genomics/tcga).
Genomic Data Commons Application Programming Interface was used to
retrieve the data on 29 April 2019. The follow-up information and
RNA-seq samples were matched, and 362 cases were selected as they
were followed up for >30 days. The samples were randomly divided
into two groups (ratio, 3:1), one of which served as the training
set (N=271), whereas the other served as the test set (N=91).
Similarly, the Affymetrix Human Genome U133 Plus 2.0 Array
(http://www.affymetrix.com/support/technical/byproduct.affx?product=hg-u133-plus)
was downloaded from the Gene Expression Omnibus (GEO) database
(https://www.ncbi.nlm.nih.gov/geo/),
from which the GSE26193 (31) gene
expression profile was obtained. A total of 107 samples with
clinicopathological characteristics were selected for the test set,
and the sample information of each group is presented in Table I. A total of 11 human
metabolism-associated pathways were obtained from the Reactome
database (https://reactome.org/) (32) (Table
II), and a total of 594 genes involved in energy metabolism
were identified from these pathways [Tables SI, SII (https://github.com/biocn/OD_data/blob/master/Table%20S2.docx)
and SIII]. For the RNA-seq data,
>50% genes with an expression level of 0 in each sample were
removed. For the chip data, normalization of microarray data was
obtained from Affymetrix platform using Robust Multi-Array Average
method (33). Probes were matched
to genes, and those matched to multiple genes were removed;
multiple probes were matched to the median of a gene to obtain a
gene expression profile. Workflow is presented in Fig. 1. Ovarian cancer specimens included
in TCGA datasets were surgically resected prior to systemic
treatment. Samples selected for TCGA analysis had >70% tumor
cell nuclei and <20% necrosis. Data on normal ovary tissues from
healthy subjects were obtained from the GTEx database (https://www.gtexportal.org/home/index.html).
 | Table I.Clinical information of each data
set. |
Table I.
Clinical information of each data
set.
| Characteristic | TCGA training
datasets (n=271) | TCGA validation
datasets (n=91) | GSE26193
(n=107) |
|---|
| Age, years |
|
≤60 | 149 | 50 | NA |
|
>60 | 122 | 41 | NA |
| Survival
status |
|
Alive | 110 | 31 | 31 |
|
Dead | 161 | 60 | 76 |
| Tumor stage |
| I | 1 | 0 | 21 |
| II | 17 | 3 | 10 |
|
III | 207 | 77 | 59 |
| IV | 43 | 11 | 17 |
| Grade |
| G1 | 0 | 1 | 7 |
| G2 | 34 | 8 | 33 |
| G3 | 229 | 80 | 67 |
| G4 | 1 | 0 | 0 |
| Table II.Pathways involved in energy
metabolism in the Reactome database. |
Table II.
Pathways involved in energy
metabolism in the Reactome database.
| Metabolic
pathway | Pathway ID | Gene count |
|---|
| Biological
oxidations | R-HSA-211859 | 221 |
| Metabolism of
carbohydrates | R-HSA-71387 | 292 |
| Mitochondrial Fatty
Acid Beta-Oxidation | R-HSA-77289 | 38 |
| Glycogen
synthesis | R-HSA-3322077 | 16 |
| Glycogen
metabolism | R-HSA-8982491 | 27 |
| Glucose
metabolism | R-HSA-70326 | 92 |
| Glycogen breakdown
(glycogenolysis) | R-HSA-70221 | 15 |
| Glycolysis | R-HSA-70171 | 72 |
| Pyruvate
metabolism | R-HSA-70268 | 31 |
| Pyruvate metabolism
and Citric Acid (TCA) cycle | R-HSA-71406 | 55 |
| Citric acid cycle
(TCA cycle) | R-HSA-71403 | 22 |
| Sum | 881 (unique,
594) |
|
Univariate Cox proportional hazard
regression analysis
As previously described (34), univariate Cox proportional hazard
analysis was conducted to determine the impact of each energy
metabolism gene in order to select genes significantly related to
patient OS in the training data set. P<0.05 was selected as the
threshold.
Identification of molecular types
associated with metabolic genes
Nonnegative matrix factorization (NMF) is an
unsupervised clustering method widely used in identifying
genomics-based tumor molecular subtypes (35,36).
To further determine the association between expression levels of
energy metabolism genes and phenotypes, the NMF method was used to
cluster samples according to the expression profiles of energy
metabolism-related genes associated with ovarian cancer prognosis,
and standard ‘brunet’ for 50 iterations was selected by NMF. The
number of clusters ‘k’ was set between 2 and 10, the average
profile width of the common member matrix was calculated using the
R package ‘NMF’ (37), and the
minimum member of each subclass was set to 10.
Association between molecular subtypes
and tumor microenvironment
TIMER is a network resource for systematically
assessing the clinical impact of different immune cells in
different cancer types (38), and
was used to estimate the abundance of six immune cell types,
including B, CD4T and CD8T cells, neutrophils, macrophages and
dendritic cells, in the tumor microenvironment. The abundance of
immune cells in the tumor microenvironment was analyzed in the
three different molecular subtypes.
Analysis of genetic differences in
molecular subtypes
To detect biological function differences among the
three molecular subtypes, differentially expressed genes among the
molecular subtypes were analyzed by DESeq2 (39), and the threshold was set to false
discovery rate (FDR) <0.05 and
|log2(fold-change)|>1. Kyoto Encyclopedia of Genes
and Genomes (KEGG) pathway and Gene Ontology (GO) enrichment
analysis of altered genes categorized by biological process were
conducted using the R software packages ‘GSVA’ (40) and ‘clusterProfiler’ (41). The functions of differentially
expressed genes were analyzed using the threshold P<0.05.
Screening of robust energy
metabolism-related prognostic feature genes
LASSO is a regression modeling with a large number
of potential prognostic features; it can perform automatic feature
selection that results in signatures with generally effective
performance for predicting prognosis (42). The LASSO method has been used in
combination with the Cox model for survival analysis, and has been
successfully applied for building sparse signatures for survival
prognosis in a range of application areas, including oncology
(43–45). In the current study, genes with
differential expression among the three molecular subtypes were
selected for univariate survival analysis, and prognostic genes
were screened using the threshold value of 0.05. Robust prognostic
characteristic genes were screened using the R software package
‘glmnet’ (46), and the optimal
characteristics were evaluated by 10-fold cross validation.
Construction of energy
metabolism-related prognostic gene signatures
To obtain a robust prognostic gene, multivariate Cox
regression analysis was performed, and the following risk scoring
model was constructed:
Risk Score=∑k=1nExpk*eHRk
Where n is the number of prognostic genes,
Expk is the expression value of a prognostic gene, and
eHRk is the estimated regression coefficient
of a gene in the multivariate Cox regression analysis. Specific
genes were selected by LASSO analysis, and the 8-gene signature was
constructed using the calculated risk scores.
Correlation analysis between gene
signatures and KEGG pathways
Gene Set Enrichment Analysis (GSEA; http://software.broadinstitute.org/gsea/downloads.jsp)
(47) was performed using the
MSigDB 6.2 (48). The C2 Canonical
pathway gene set collection containing 1,320 gene sets was selected
for analysis. Gene sets with FDR <0.05 after 1,000 permutations
were considered as significantly enriched.
Comparison with existing prognostic
features of ovarian cancer
To assess the survival classification and predictive
power of the 8-gene signature, four published prognostic features
were retrospectively reviewed, including a 3-gene (49), 6-gene (50), 8-gene (51) and 5-gene signature (52). To ensure that the models were
comparable, according to the corresponding genes in the four
models, the risk scores of each ovarian cancer sample in TCGA were
calculated using the same method, the ROC of each model was
evaluated, and the samples were divided according to the median
risk score. OS differences between the high- and low-risk groups
were calculated.
Statistical analysis
Kaplan-Meier (KM) curves were plotted when Youden's
index in each data set was used as a cutoff to compare the survival
risk between the high- and low-risk groups, and the data were
analyzed by the log-rank test followed by Bonferroni correction.
Multivariate Cox regression analysis was performed to evaluate
whether gene markers were independent prognostic factors.
Statistical analysis between multiple groups was performed by
ANOVA, followed by Dunnett's test. ROC analysis was performed using
R package ‘pROC’ (https://cran.r-project.org/web/packages/pROC/index.html).
The χ2 test was used for mutation frequency detection.
All statistical analyses were processed in R 3.4.3 (https://mirrors.tuna.tsinghua.edu.cn/CRAN/) with
default software parameters, unless otherwise stated. P<0.05 was
considered to indicate a statistically significant difference.
Results
Identification and molecular
classification of genes involved in energy metabolism
For the TCGA training set, univariate regression
analysis was performed to establish an association between patient
OS and energy metabolism-related gene expression. A total of 39
energy metabolism-related genes with prognostic significance
(Table SIV) were identified. With
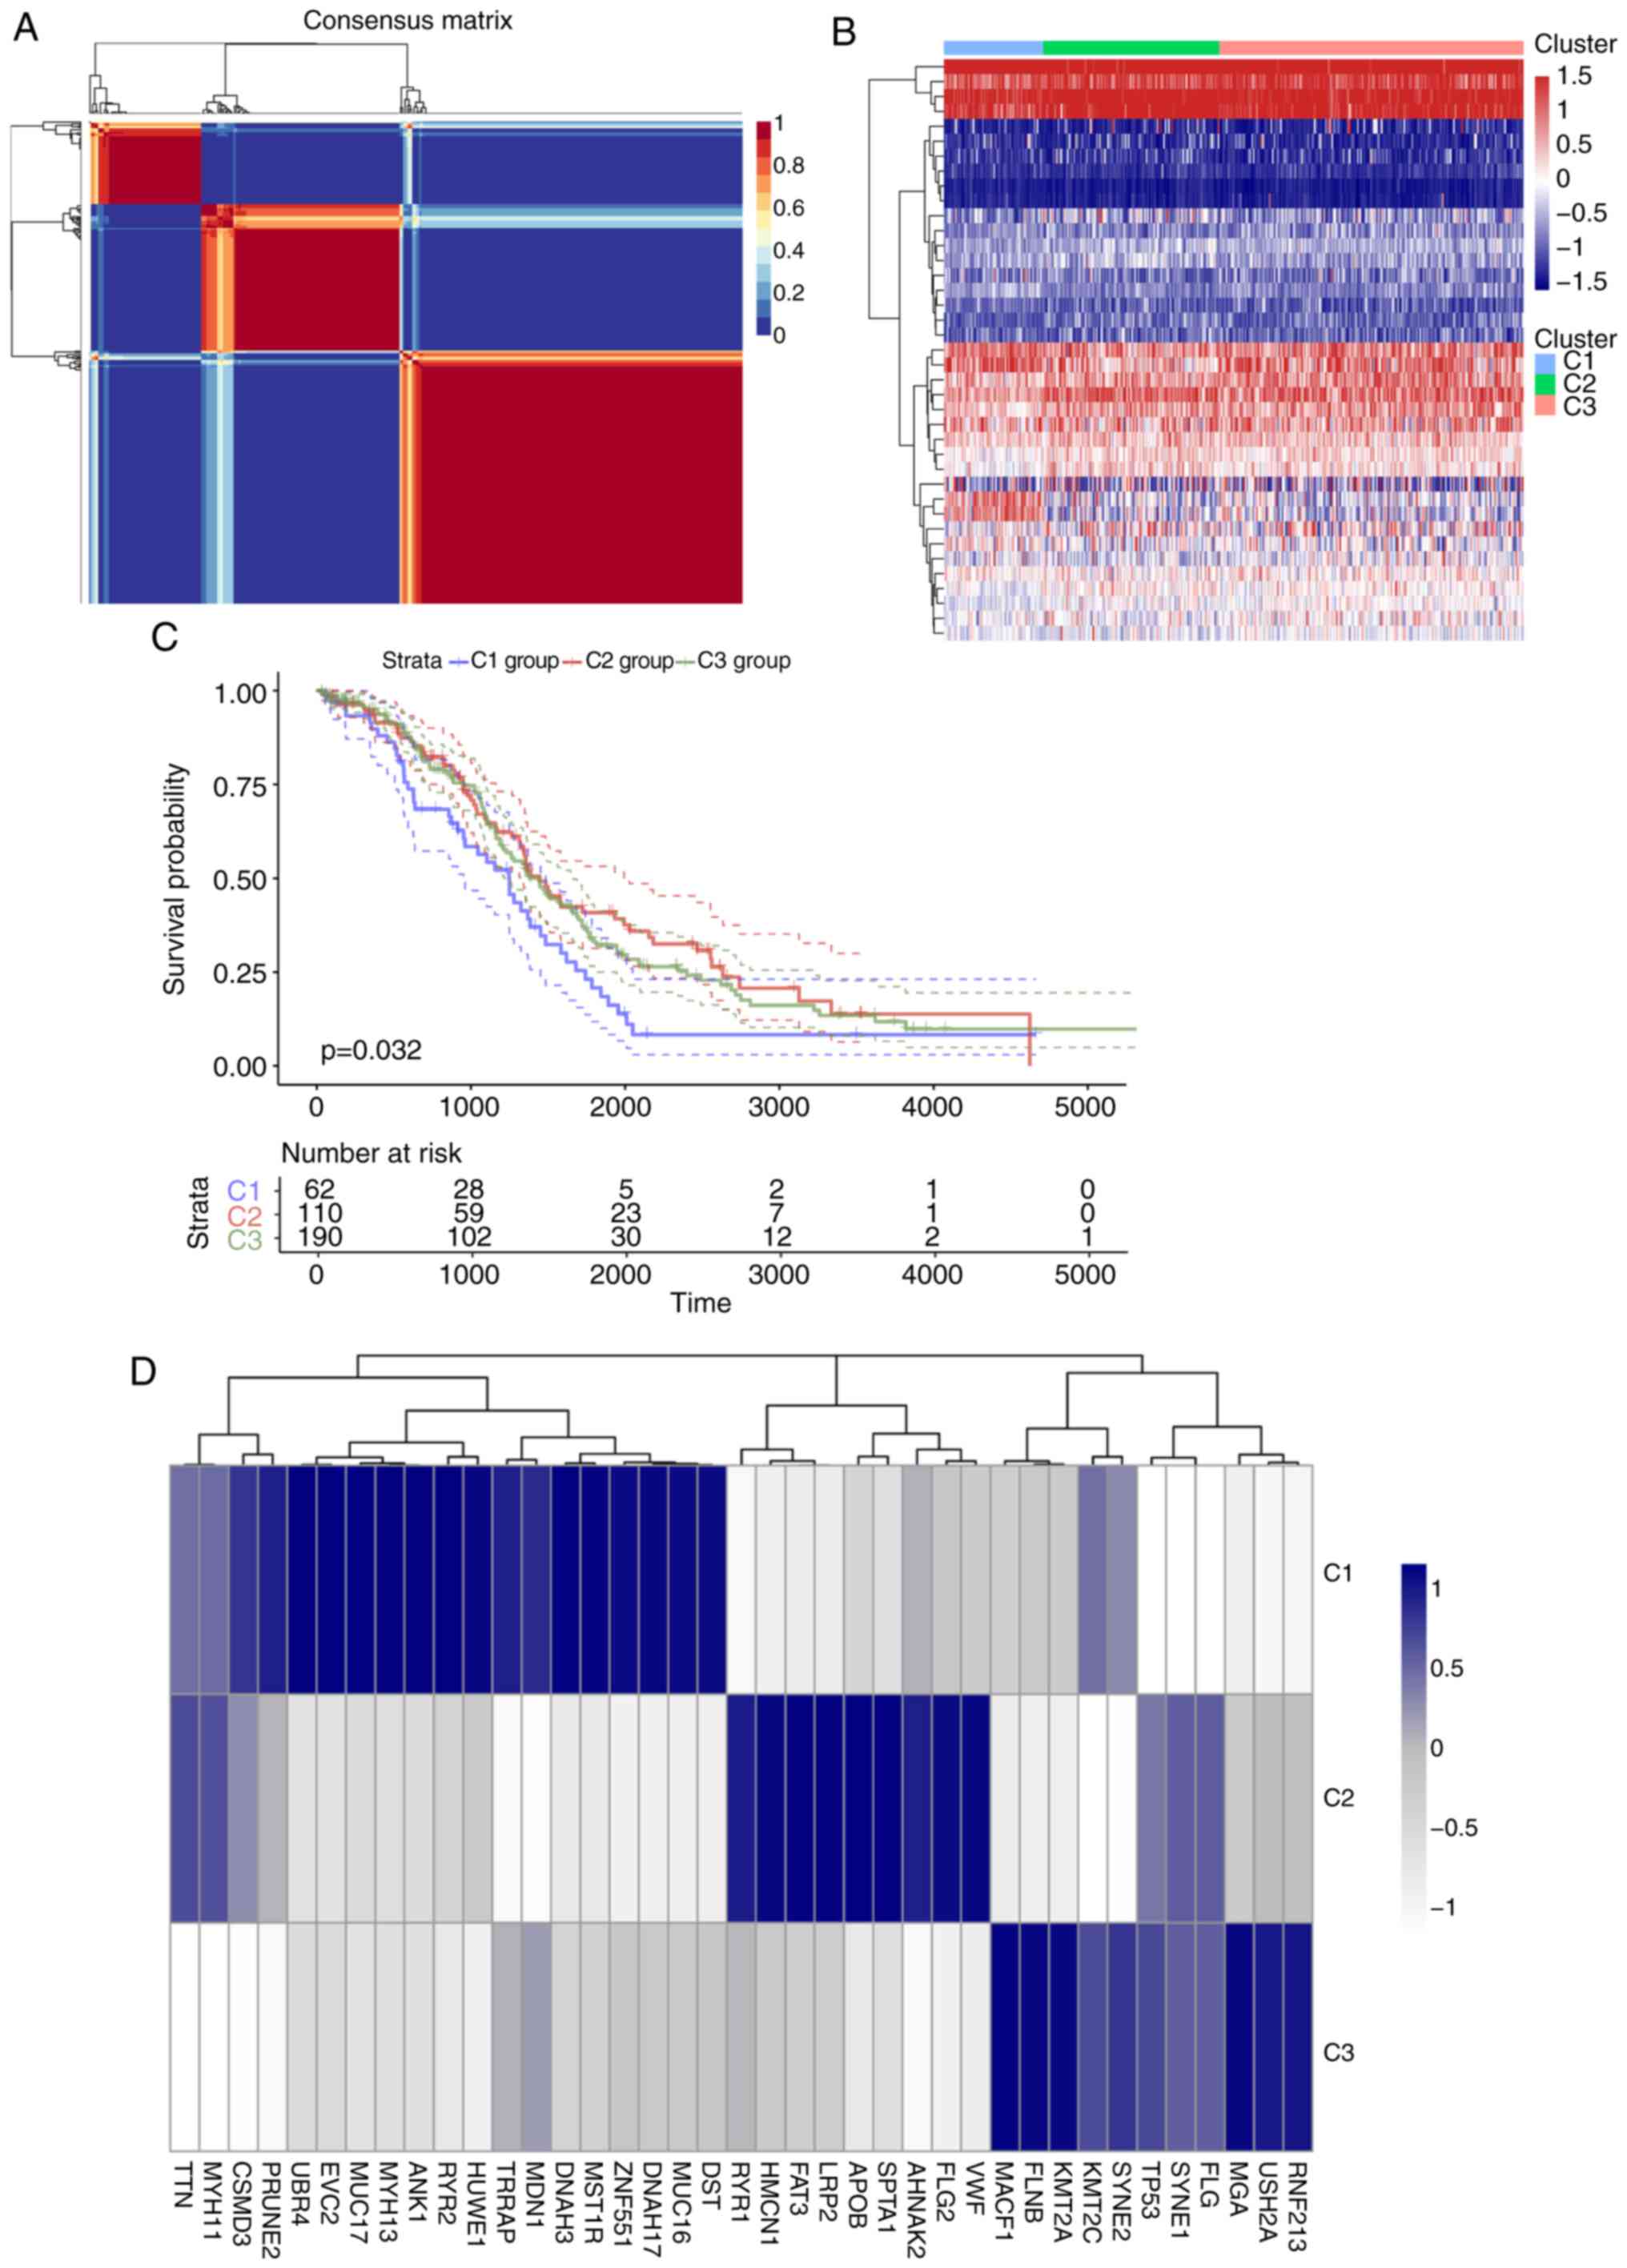
the minimum member of each subclass set to 10 and the optimal
cluster number set to 3, the average profile width of the common
member matrix was determined by the R package ‘NMF’ according to
the cophenetic, dispersion and silhouette indicators (Fig. 2A). The results exhibited different
expression patterns with prognostic differences in energy
metabolism-related gene expression profiles in the three subtypes
(Fig. 2B). In addition, significant
differences in OS time among the three subtypes were detected
(Figs. 2C and S1); of note, the C1 group was associated
with the worst prognosis. Further analysis was conducted on the
association among gene mutations in the three subtypes, and 20
genes with the highest mutation rate in each subtype were selected
to obtain a total of 39 genes. The genes with the highest mutation
rates among the three subtypes were not identical (Figs. 2D and S2). The mutation frequencies of
transformation/transcription domain-associated protein (TRRAP),
zinc finger protein 551, myosin heavy chain 13 (MYH13) and EvC
ciliary complex subunit 2 in C1 were significantly higher compared
with those in C2 and C3 (χ2 test P<0.05), the
mutation frequency of the von Willerbrand factor in C2 was higher
compared with that in the other two groups (P<0.05), and the
mutation frequency of filamin B in C3 was higher compared with that
in the other two groups (χ2 test p<0.05).
Further analysis by the R software package ‘GSVA’
revealed that 102, 60 and 21 significantly different KEGG pathways
were present in C1 vs. C2/C3, C2 vs. C1/C3 and C3 vs. C1/C2,
respectively. In the C1 group, the scores of pathways associated
with tumorigenesis and tumor development, such as the ‘TGF BETA
SIGNALING PATHWAY’ and ‘ECM RECEPTOR INTERACTION’, were
significantly higher compared those of the other two groups. In the
C2 group, the scores of major diseases such as ‘ALZHEIMERS DISEASE’
and ‘PARKINSONS DISEASE’ were significantly higher compared with
those of the other two groups, whereas the scores of pathways such
as ‘PATHWAYS IN CANCER’ and ‘PROSTATE CANCER’ were significantly
lower compared with those of the other two groups. In the C3 group,
the overall pathway score was low. These result suggested that the
C1 subtype may be associated with a poor prognosis (Fig. 2E). Comparison between the subtypes
identified in the preset study and previously published molecular
subtypes of ovarian cancer (53)
demonstrated that the C1 subtype was comparable with the published
mesenchymal subtype (78.26% match), which is also associated with a
poor prognosis (Fig. 2F).
Microenvironmental characteristics and
metabolic pathway differences of tumor molecular subtypes
No significant differences were detected after
comparing the clinical features such as stage, grade and age in the
three subtypes (Table III),
suggesting that independent factors may be affecting the different
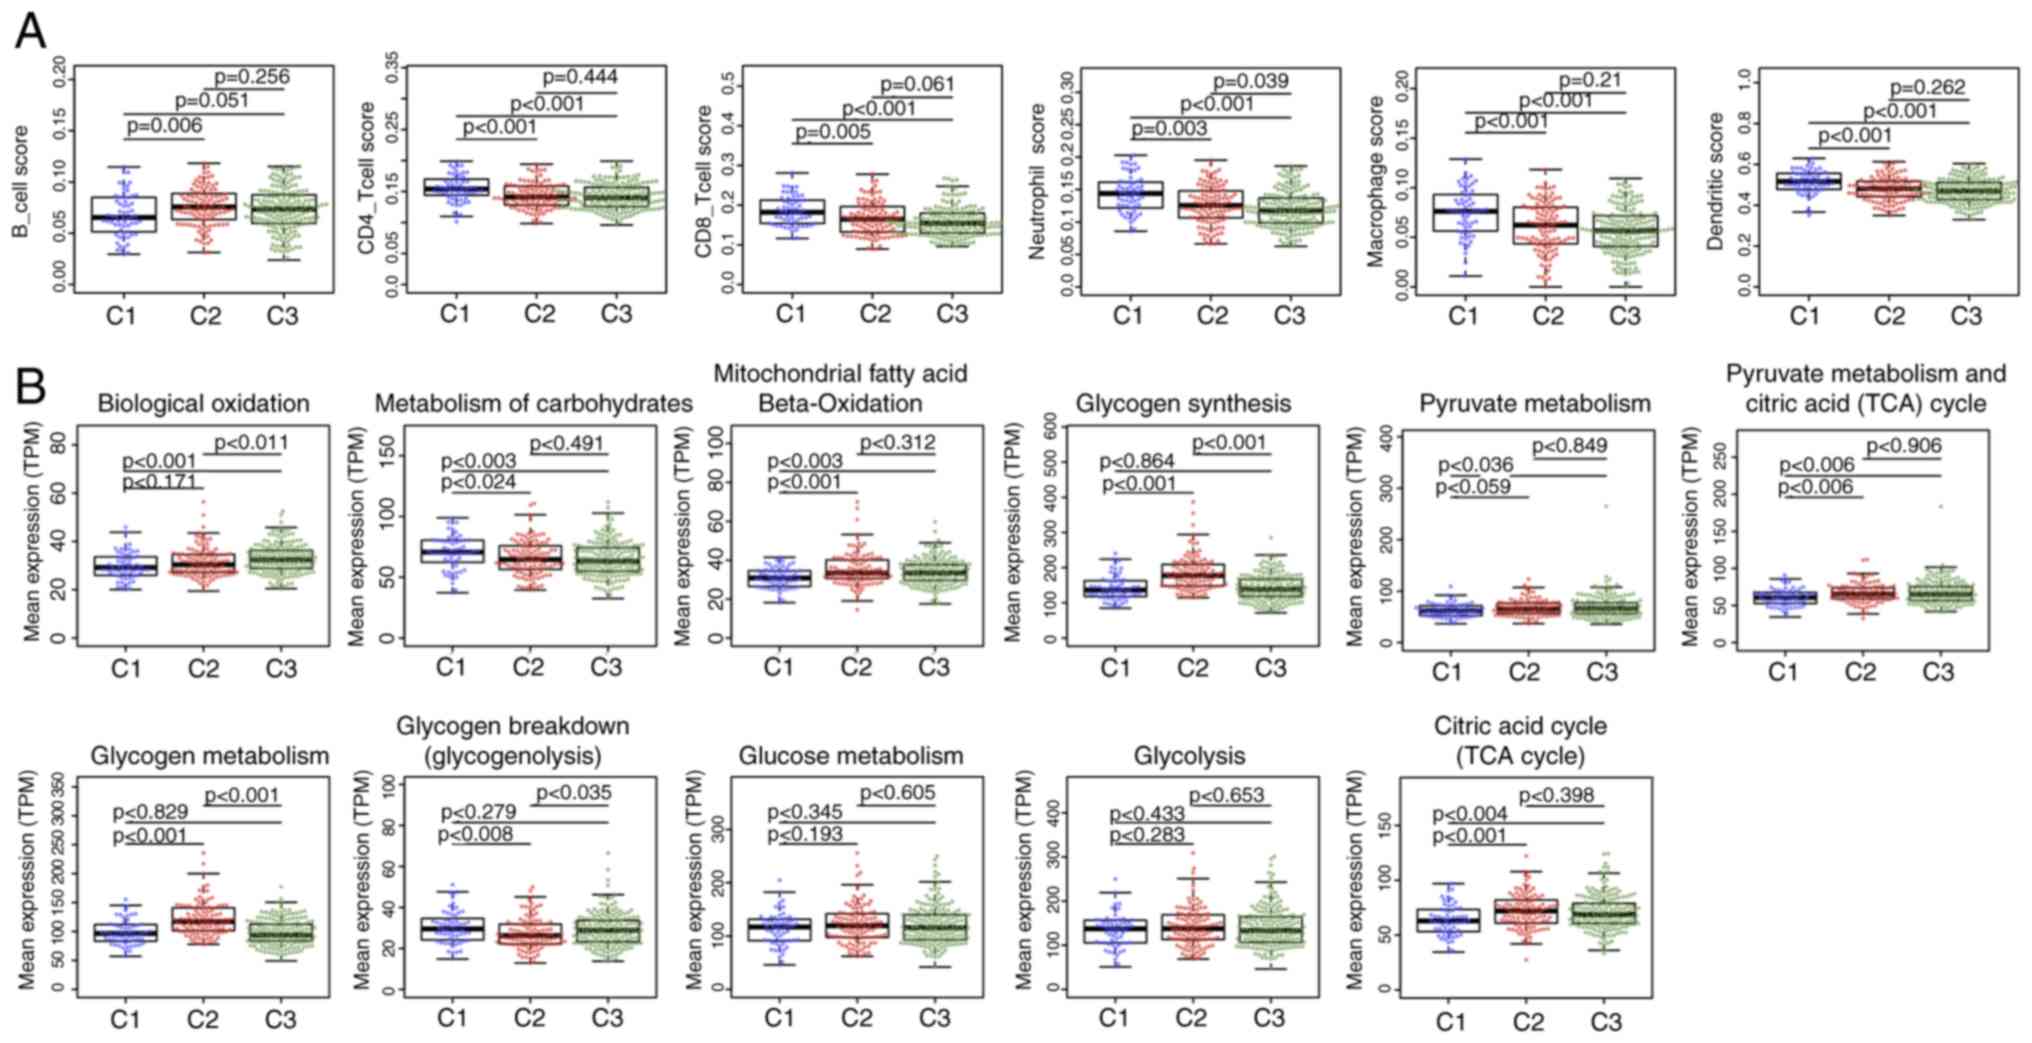
clinical outcomes of the three subtypes. The tumor
microenvironments were analyzed, and the immune cell contents of
the three subtypes were compared; the B-cell score was
significantly lower, whereas CD4 and CD8 cell, neutrophil,
macrophage and dendritic cell scores were higher in the C1 subtype
compared with those in the C2 and C3 subtypes (Fig. 3A), which suggested that the immune
cells of the tumor microenvironment in the C1 subtype was more
active; in addition, a gene expression matrix was extracted based
on the gene set in the 11 energy metabolism-related pathways, the
values of which were defined by the mean value of the corresponding
gene in each sample, and the expression levels of the genes in
these pathways in the different subtypes were determined. The
results demonstrated that the expression of genes in ‘Biological
oxidations’ in C3 was significantly higher compared with that in C1
and C2, whereas the expression of genes in ‘Metabolism of
carbohydrates’ was higher in C1 compared with that in C2 and C3.
The expression levels of genes in the pathways ‘Mitochondrial fatty
acid beta-oxidation’, ‘Pyruvate metabolism’, ‘Citric acid cycle
(TCA cycle)’ and ‘Pyruvate metabolism and Citric Acid (TCA) cycle’
was significantly lower in C1 compared with those in C2 and C3,
whereas the expression of genes in ‘Glycogen synthesis’ and
‘Glycogen metabolism’ in C2 were higher compared with those in C1
and C3; in addition, the expression of genes in ‘Glycogen breakdown
(glycogenolysis)’ in C2 was lower compared with that in C1 and C3,
and no significant differences in the genes in ‘Glucose metabolism’
and ‘Glycolysis’ were observed among the three subtypes (Fig. 3B). These results suggested that most
of the energy metabolism pathways in the three subtypes were
different, and these subtypes exhibit different metabolic
patterns.
| Table III.Clinical information statistics of
three molecular subtypes. |
Table III.
Clinical information statistics of
three molecular subtypes.
| Clinical
features | C1 | C2 | C3 |
|---|
| Status |
|
|
|
|
Alive | 17 | 46 | 78 |
|
Dead | 45 | 64 | 112 |
| Stage |
|
|
|
| I | 0 | 0 | 1 |
| II | 0 | 8 | 12 |
|
III | 51 | 80 | 153 |
| IV | 10 | 21 | 23 |
| Grade |
|
|
|
| G1 | 1 | 0 | 0 |
| G2 | 5 | 10 | 27 |
| G3 | 56 | 96 | 157 |
| G4 | 0 | 1 | 4 |
| Age, years |
|
|
|
|
≤60 | 31 | 66 | 102 |
|
>60 | 31 | 44 | 88 |
Identification of differentially
expressed genes in the C1 subtype
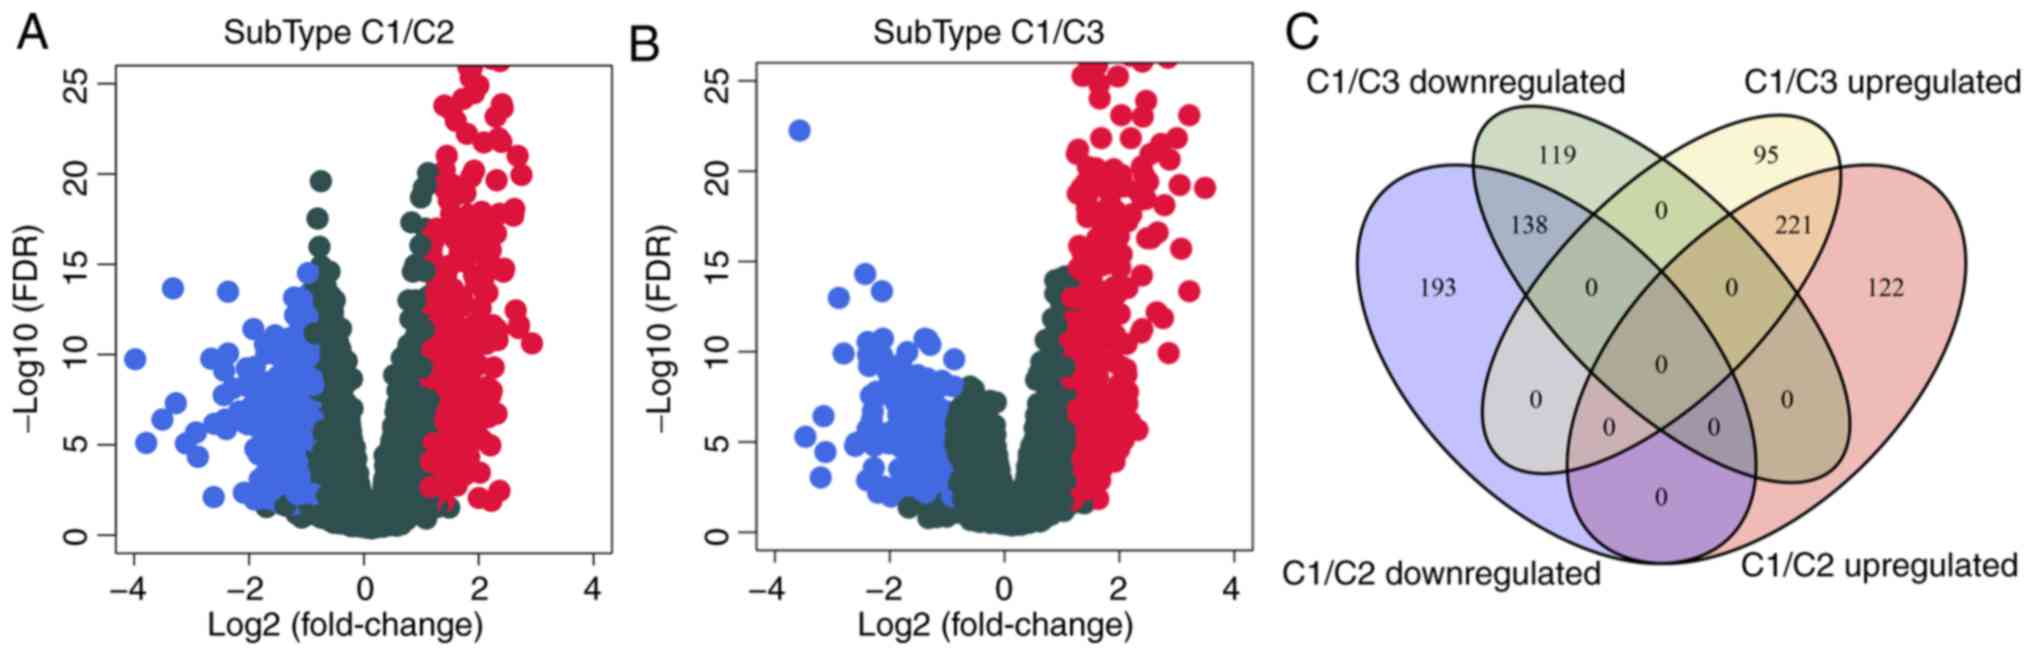
To analyze the molecular mechanism underlying the
poor prognosis of patients with the C1 subtype, the gene expression
differences between C1 and C2 or C3 were evaluated. Compared with
C2, 342 genes were upregulated and 331 were downregulated in C1
(Fig. 4A); similarly, compared with
C3, 316 genes were upregulated and 257 were downregulated in C1
(Fig. 4B). The differentially
expressed genes contained a total of 888 genes (Table SV), of which 359 were shared
between C2 and C3 (Fig. 4C). GO
biological process and KEGG functional enrichment analysis was
performed on the 888 DEGs, which identified 28 enriched KEGG
pathways (Table SVI), suggesting
that the 28 shared pathways may be involved cancer progression; the
enriched KEGG pathways included the ‘PI3K-Akt signaling pathway’,
‘cAMP signaling pathway’ and ‘ECM-receptor interaction’ (Fig. 4E). In addition, 515 GO terms were
enriched in the C1 subtype in the biological process category
(Table SVII), including
‘angiogenesis’ and ‘regulation of trans-synaptic signaling’
(Fig. 4D), which were also
associated with the development of cancer.
Identification of 8-gene signature for
ovarian cancer survival
The association between the differentially expressed
genes in C1 and prognosis was analyzed, and 82 significant
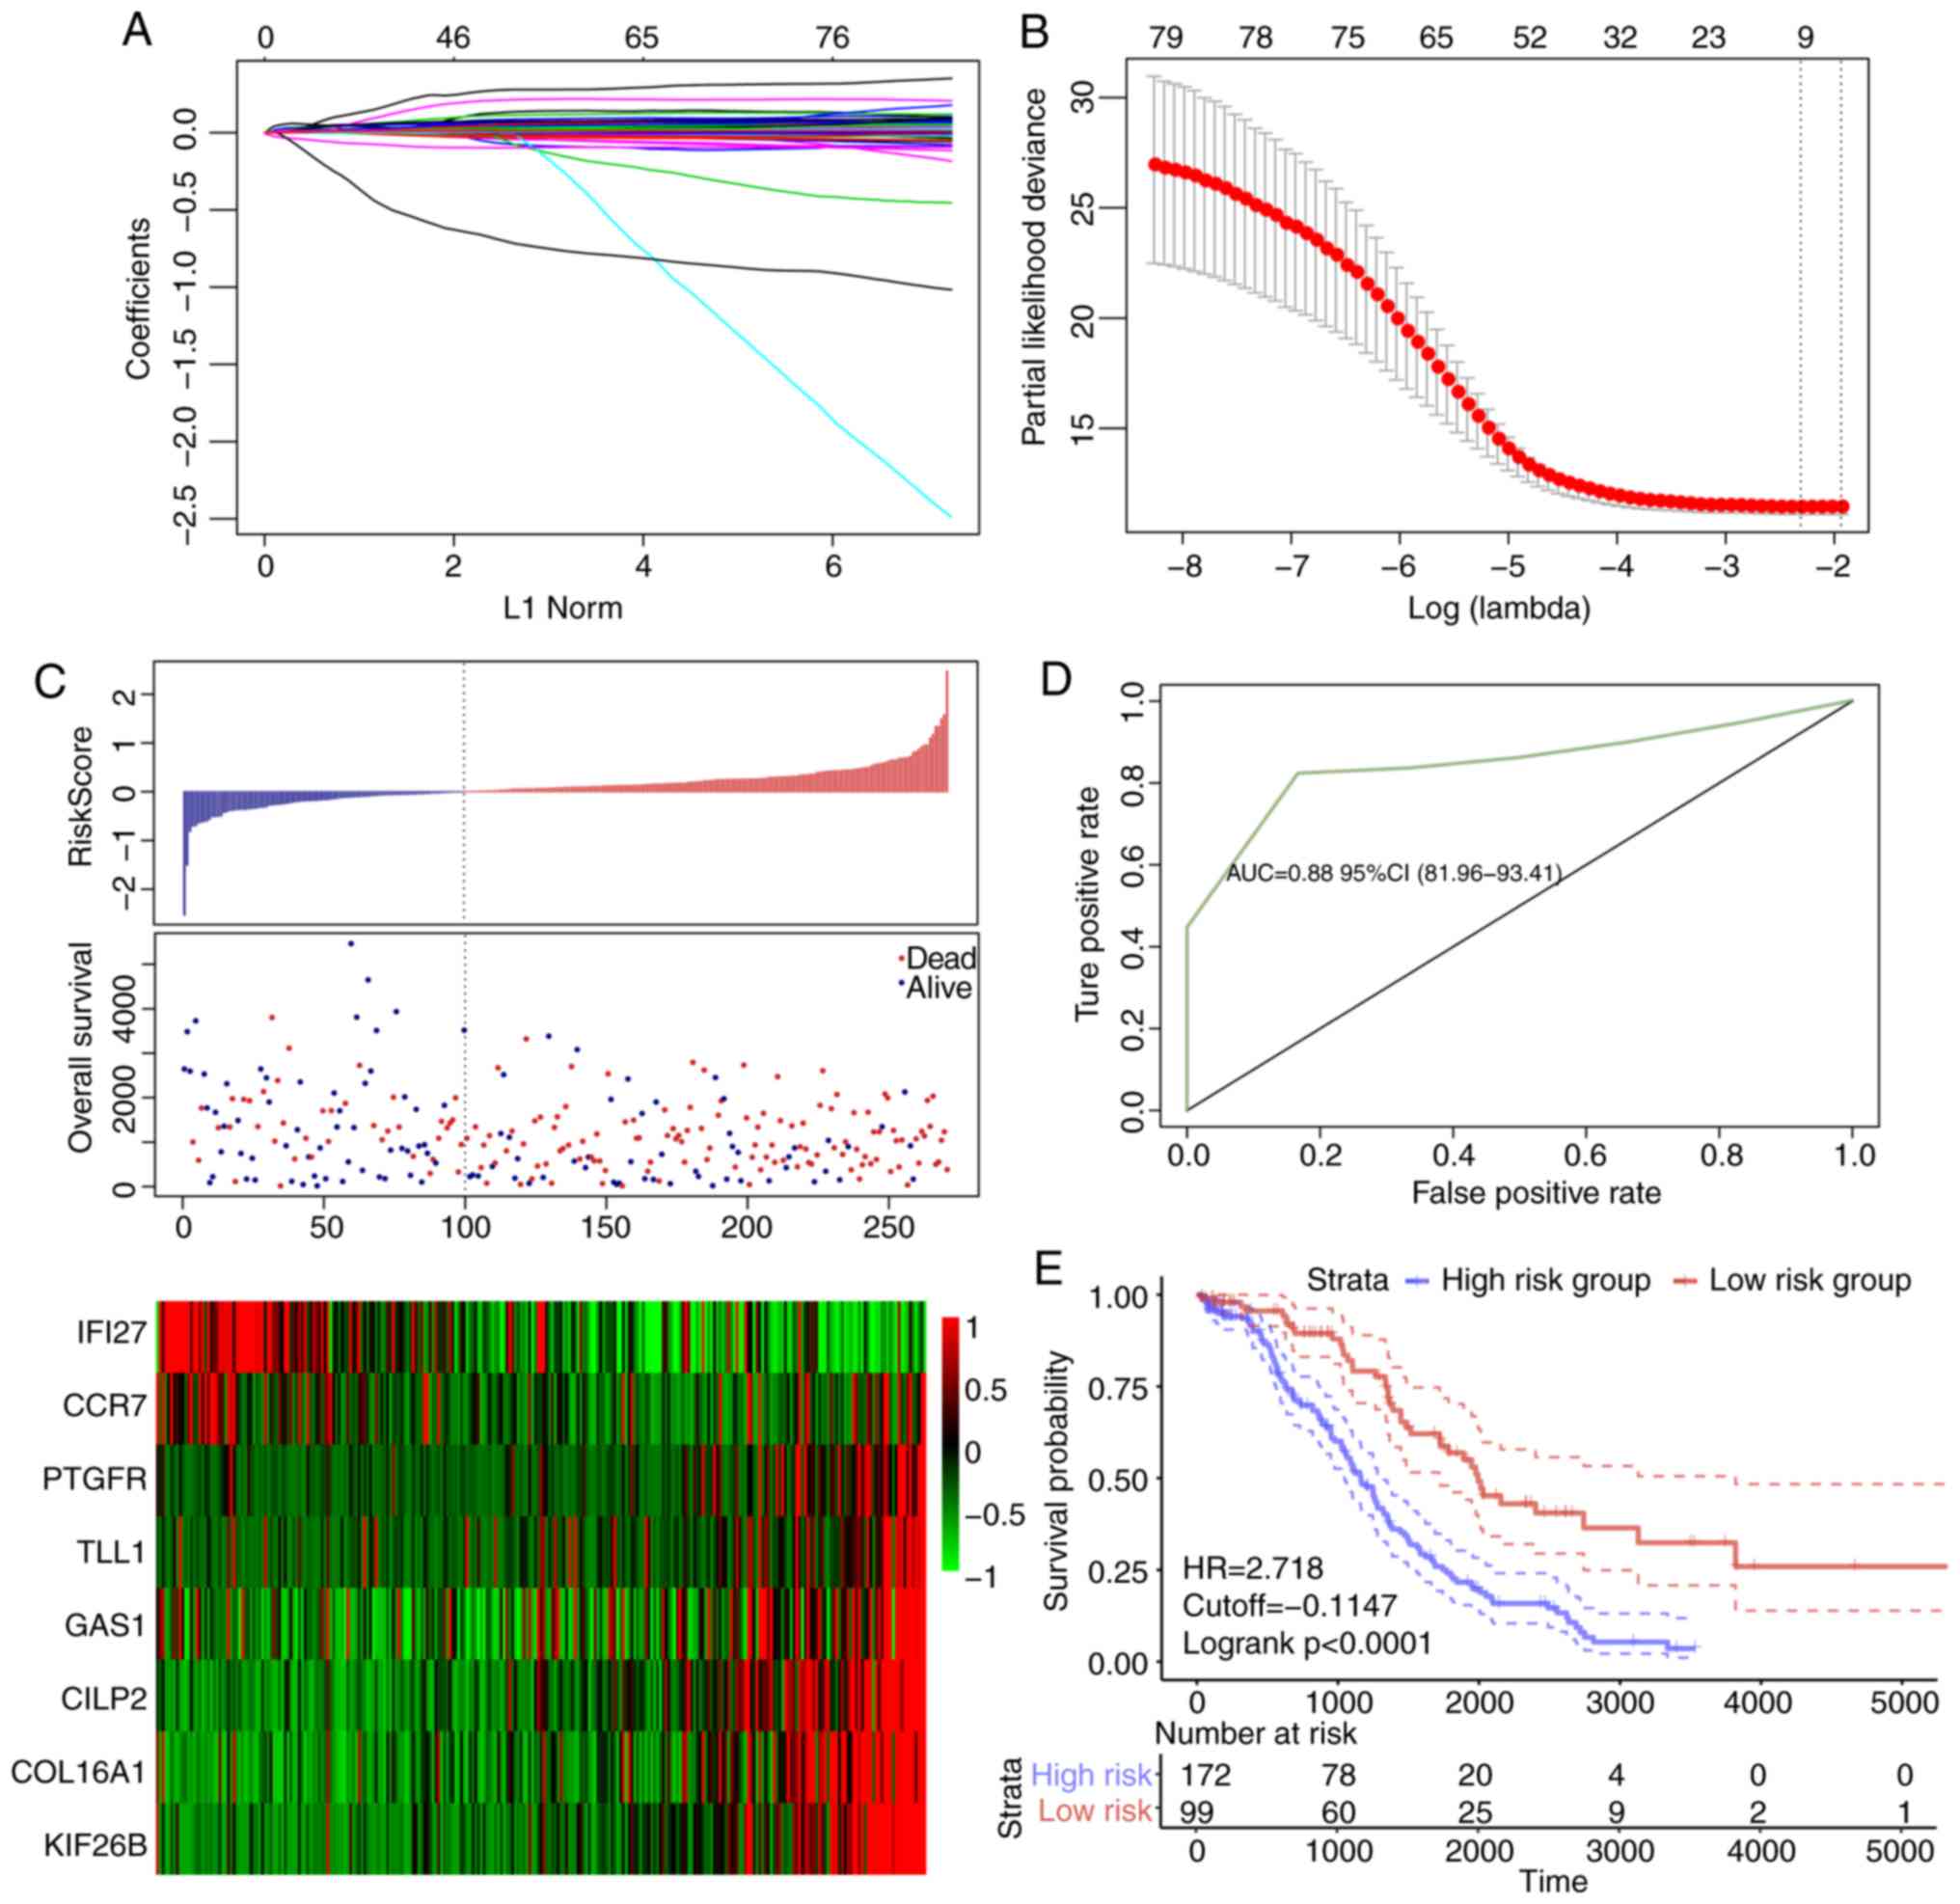
prognostic factors were selected as candidate genes (Table SVIII). Dimensional-reduction
analysis was performed by LASSO, with the choice of 10-fold
cross-validation and minimized error rate when λ=0.0992708
(Fig. 5A and B); as a result,
Tolloid-like 1 gene (TLL1), Type XVI collagen (COL16A1),
prostaglandin F2 alpha (PTGFR), cartilage intermediate layer
protein 2 (CILP2), kinesin family member 26b (KIF26B), interferon
inducible protein 27 (IFI27), growth arrest-specific gene 1 (GAS1)
and chemokine receptor 7 (CCR7) were selected, a number of which
were associated with the development of ovarian cancer. For
example, COL16A1 is associated with the development of ovarian
cancer (54), PTGFR is a potential
serum marker for early diagnosis of ovarian cancer (55), upregulation of KIF26B enhances the
proliferation and migration of ovarian cancer cells (56), and IFI27 promotes
epithelial-mesenchymal transformation and induces ovarian
tumorigenicity (57). The 8-gene
signature was established by a multi-factor COX regression analysis
using the following model: Risk Score=0.0603 × expTLL1 +
0.006 × expCOL16A1 + 0.1139 × expPTGFR +
0.0011 × expCILP2 + 0.0142 × expKIF26B -
0.0003 × expIFI27 + 0.0011 × expGAS1−0.0898 ×
expCCR7. The risk score of each sample was calculated.
The results demonstrated that as the risk score increased, the
survival time gradually reduced (Fig.
5C). In addition, when the expression levels s of IFI27 and
CCR7 decreased, the expression levels of TLL1, COL16A1, PTGFR,
CILP2, KIF26B and GAS1 increased (Fig.
5C). The ROC analysis demonstrated that the AUC was 0.83
(Fig. 5D), and when the samples
were grouped according to the Youden's index of the ROC (cut-off,
−0.1147472), a highly significant difference was observed in the
prognosis between the high- and low-risk groups (Fig. 5E).
The robustness of the 8-gene signature
model
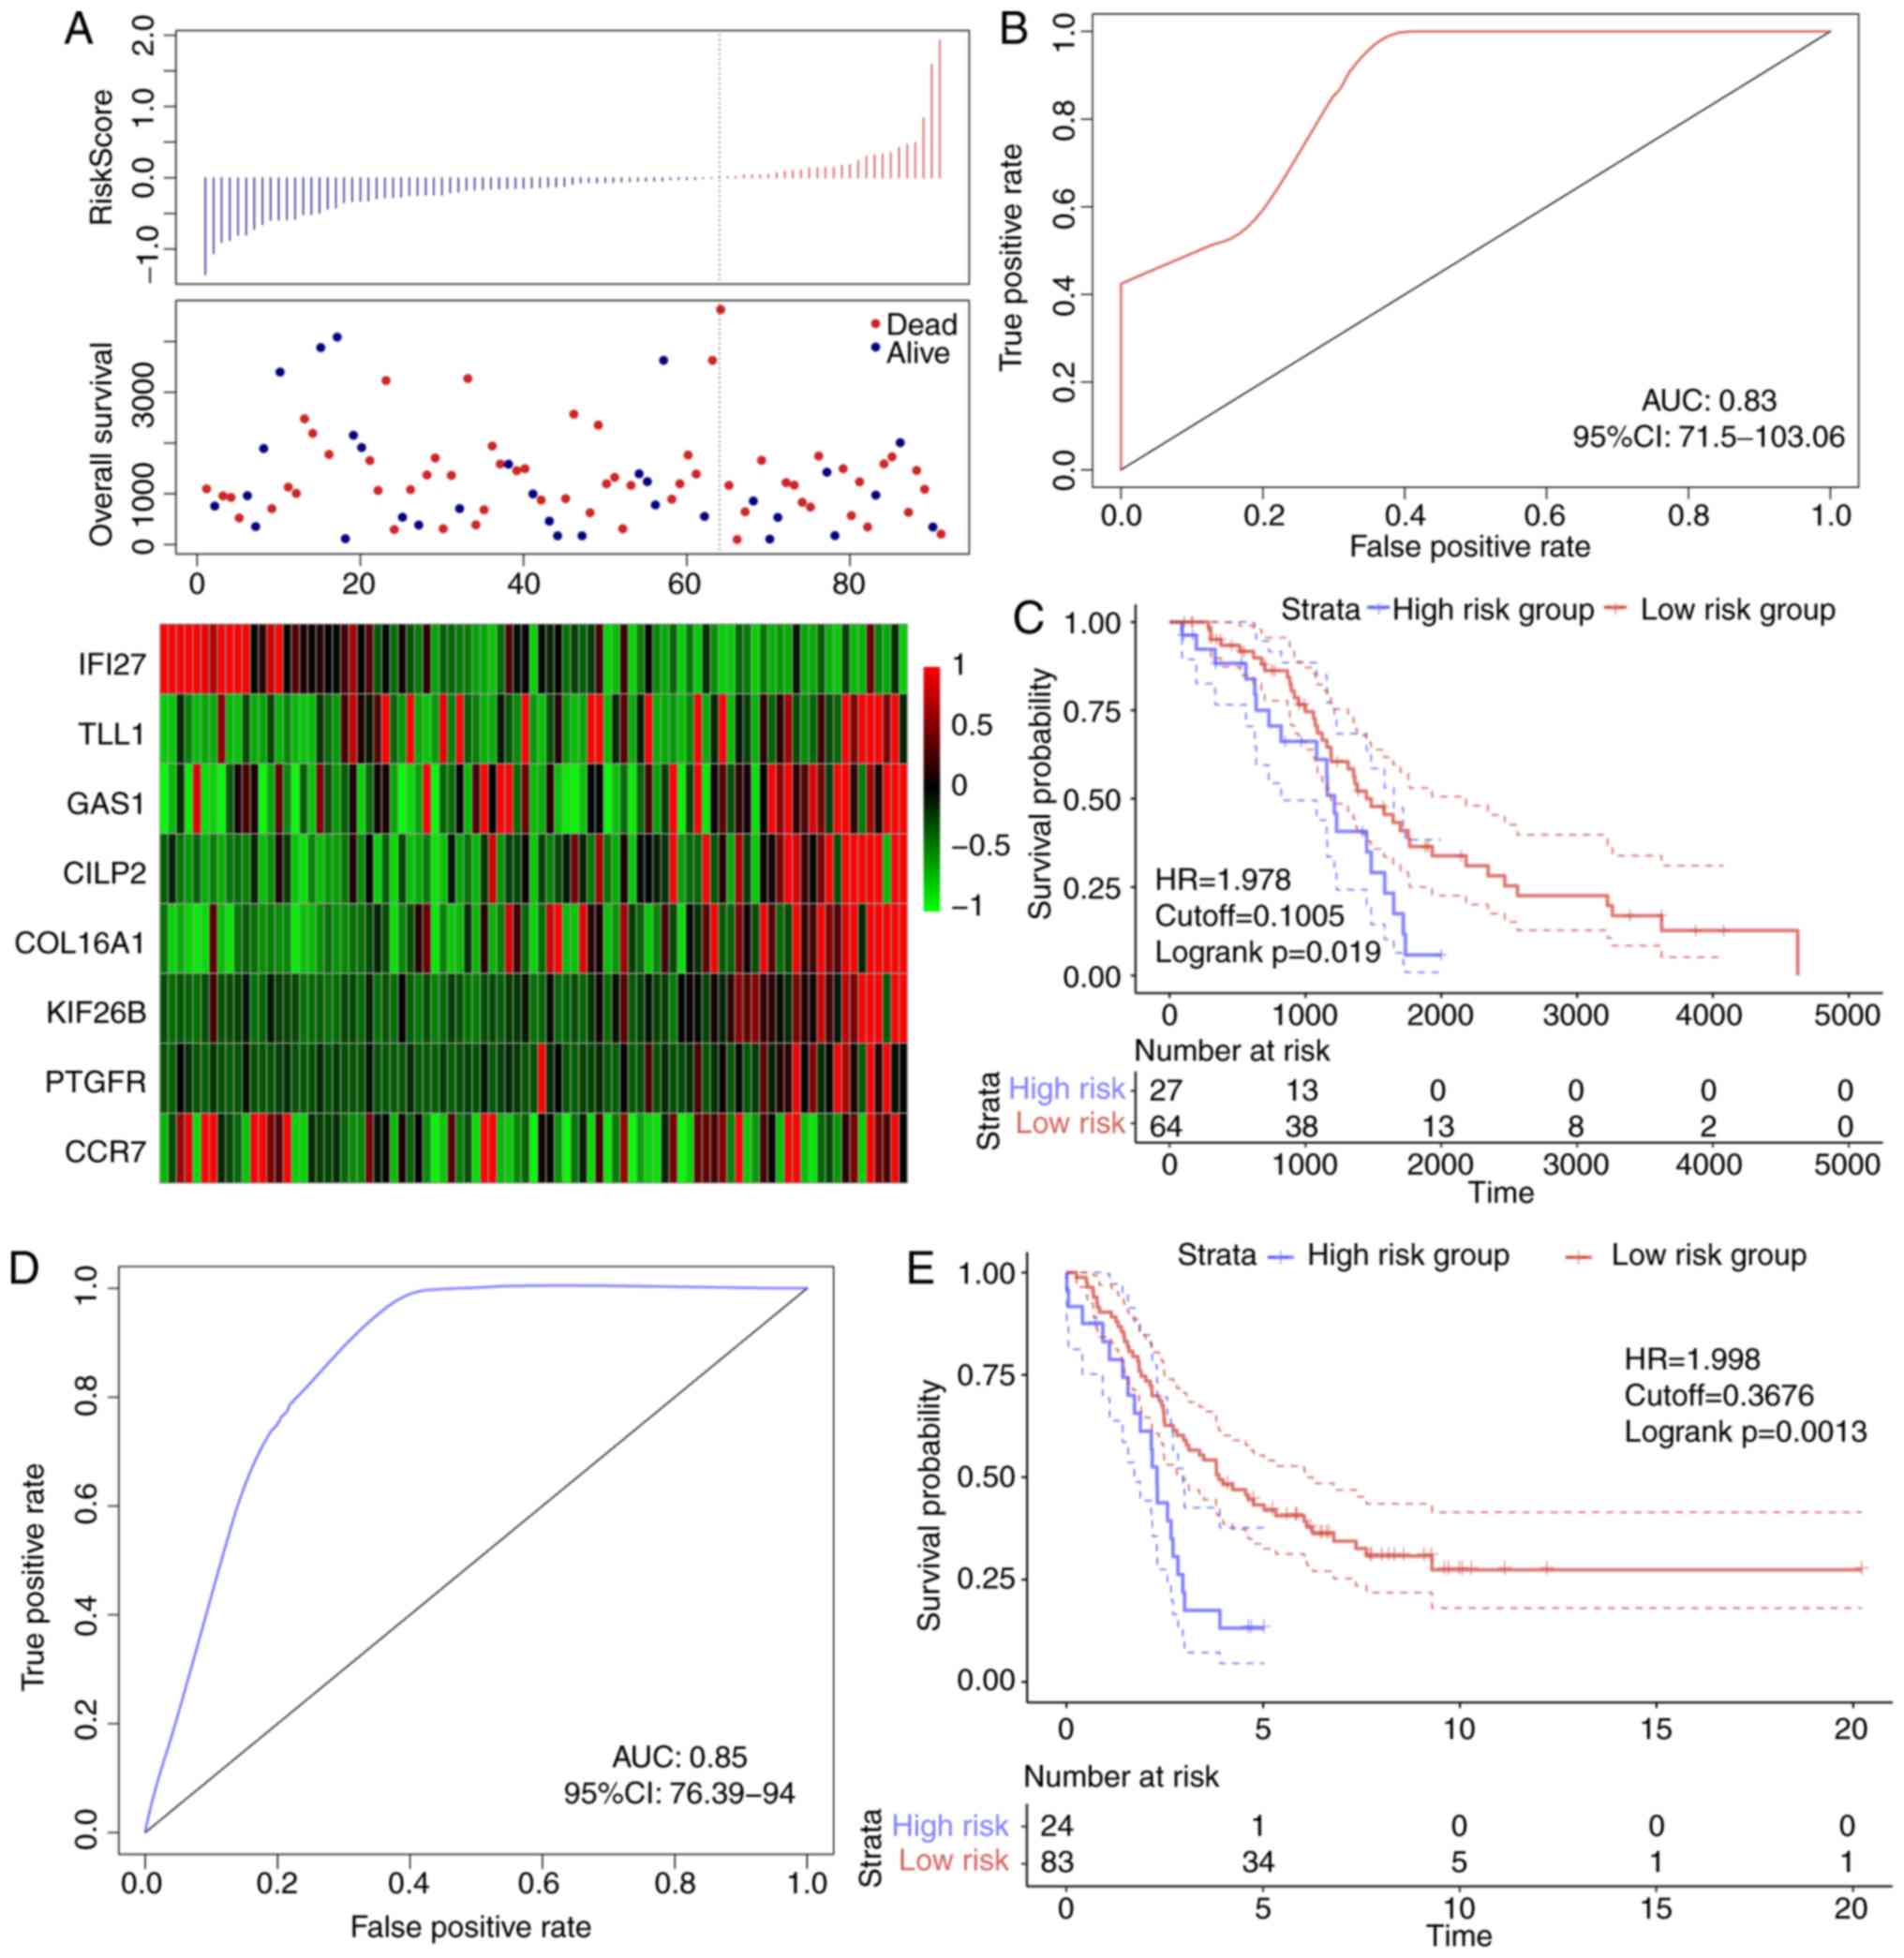
In order to verify the robustness of the 8-gene
signature model, the risk score of each sample in the TCGA
validation dataset was first calculated. The association between
the risk score and gene expression was consistent with the training
set (Fig. 6A), and the AUC in the
TCGA validation dataset was 0.67 (Fig.
6B). The TCGA validation dataset samples were divided into
high- and low-risk groups according to the threshold of the
training set, and significant prognostic differences were
identified between the two groups (Fig.
6C). The model was verified in the external validation set
(GSE26193), and the ROC analysis demonstrated that the AUC was 0.63
(Fig. 6D), and the low-risk group
exhibited a significantly better prognostic result compared with
the high-risk group (Fig. 6E).
Therefore, the model exhibited effective prognostic classification
performance in the test and external validation sets.
Clinical independence of the 8-gene
signature model
To identify the independence of the 8-gene signature
model in clinical applications, relevant hazard ratio (HR), 95%
confidence interval (CI) of HR and P-value were analyzed by
univariate and multivariate COX regression in TCGA training set,
TCGA test set and the GEO validation set. The clinical information
of TCGA, GSE44001 patient records, including age, differentiation,
clinical stage, and grouping information of the 8-gene signature
were systematically processed (Table
IV). In TCGA training set, univariate COX regression analysis
demonstrated that the high-risk group and age were significantly
associated with survival; however, the corresponding multivariate
COX regression analysis identified that only the high-risk group
(HR, 2.56; 95% CI, 1.82–3.59; P=5.66×10⁻⁸) exhibited
clinical independence. In TCGA test set, univariate and
multivariate COX regression analysis demonstrated that the
high-risk group was significantly associated with survival (HR,
1.682; 95% CI, 0.729–3.882; P=0.022). In GSE44001, univariate COX
regression analysis demonstrated that the high-risk group and stage
were associated with survival; corresponding multivariate COX
regression analysis revealed that the high-risk group (HR, 1.604,
95% CI, 0.494–50.041; P=0.017) and grade (HR, 2.203; 95% CI,
1.628–2.982; P=3.12×10⁻⁷) exhibited significant
differences in predicting ovarian cancer prognosis. The expression
trends of the eight genes were also analyzed in different groups
based on age (>60 and ≤60 years), stage, grade and lymphatic
invasion. Among them, IFI27 was significantly upregulated in the
≤60 years group, G3 and G4; COL16A1, PTGF and KIF26B were
significantly upregulated in patients with lymphatic invasion
(Fig. S3). TLL1, COL16A1, PTGFR,
CILP2, KIF26B, IFI27, GAS1 and CCR7 were significantly upregulated
in tumor samples compared with normal samples (Fig. S4). These results suggested that the
8-gene signature was a prognostic indicator independent of other
clinical factors and had clinical value.
| Table IV.Univariate and multivariate Cox
regression analysis of prognostic clinical factors and clinical
independence. |
Table IV.
Univariate and multivariate Cox
regression analysis of prognostic clinical factors and clinical
independence.
| A, TCGA training
datasets |
|---|
|
|---|
|
| Univariate
analysis | Multivariate
analysis |
|---|
|
|
|
|
|---|
| Variable | HR | 95% CI | P-value | HR | 95% CI | P-value |
|---|
| 8-gene risk score,
High vs. low | 3.233 | 2.163–4.833 |
<0.001a | 2.56 | 1.8227–3.592 |
<0.001a |
| Age, >60 vs. ≤60
years | 1.016 | 1.002–1.031 | 0.020a | 1.014 | 0.9994–1.028 | 0.986 |
| Grade, G3/G4 vs.
G1/G2 | 1.201 | 0.757–1.904 | 0.436 | 1.112 | 0.7914–1.563 | 0.539 |
| Stage, III vs.
I/II | 1.991 | 0.812–4.877 | 0.131 | 1.216 | 0.7877–1.877 | 0.377 |
| Stage, IV vs.
I/II | 1.402 | 0.865–2.272 | 0.170 |
|
|
|
|
| B, TCGA test
datasets |
|
|
| Univariate
analysis | Multivariate
analysis |
|
|
|
|
|
Variable | HR | 95% CI | P-value | HR | 95% CI | P-value |
|
| 8-gene risk score,
High vs. low | 1.958 | 1.103–3.473 | 0.021a | 1.682 | 0.729–3.882 | 0.022a |
| Age, >60 vs. ≤60
years | 1.024 | 0.996–1.052 | 0.083 | 1.026 | 0.997–1.056 | 0.075 |
| Grade, G3/G4 vs.
G1/G2 | 1.118 | 0.477–2.618 | 0.796 | 1.875 | 0.880–3.997 | 0.103 |
| Stage, III vs.
I/II | 1.615 | 0.222–11.760 | 0.635 | 0.956 | 0.399–2.294 | 0.921 |
| Stage, IV vs.
I/II | 1.379 | 0.479–3.972 | 0.551 |
|
|
|
|
| C,
GSE26193 |
|
| Univariate
analysis | Multivariate
analysis |
|
|
|
|
|
Variable | HR | 95% CI | P-value | HR | 95% CI | P-value |
|
| 8-gene risk score,
High vs. low | 2.341 | 1.374–3.988 | 0.002a | 1.604 | 0.494–50.041 | 0.017a |
| Grade, G3/G4 vs.
G1/G2 | 1.062 | 0.661–1.709 | 0.801 | 2.203 | 1.628–2.982 |
<0.001a |
| Stage, III vs.
I/II | 3.799 | 1.959–7.366 |
<0.001a | 0.729 | 0.483–1.099 | 0.132 |
| Stage, IV vs.
I/II | 2.442 | 1.582–3.768 |
<0.001a |
|
|
|
GSEA analysis of enriched pathway
differences between the high- and low-risk groups
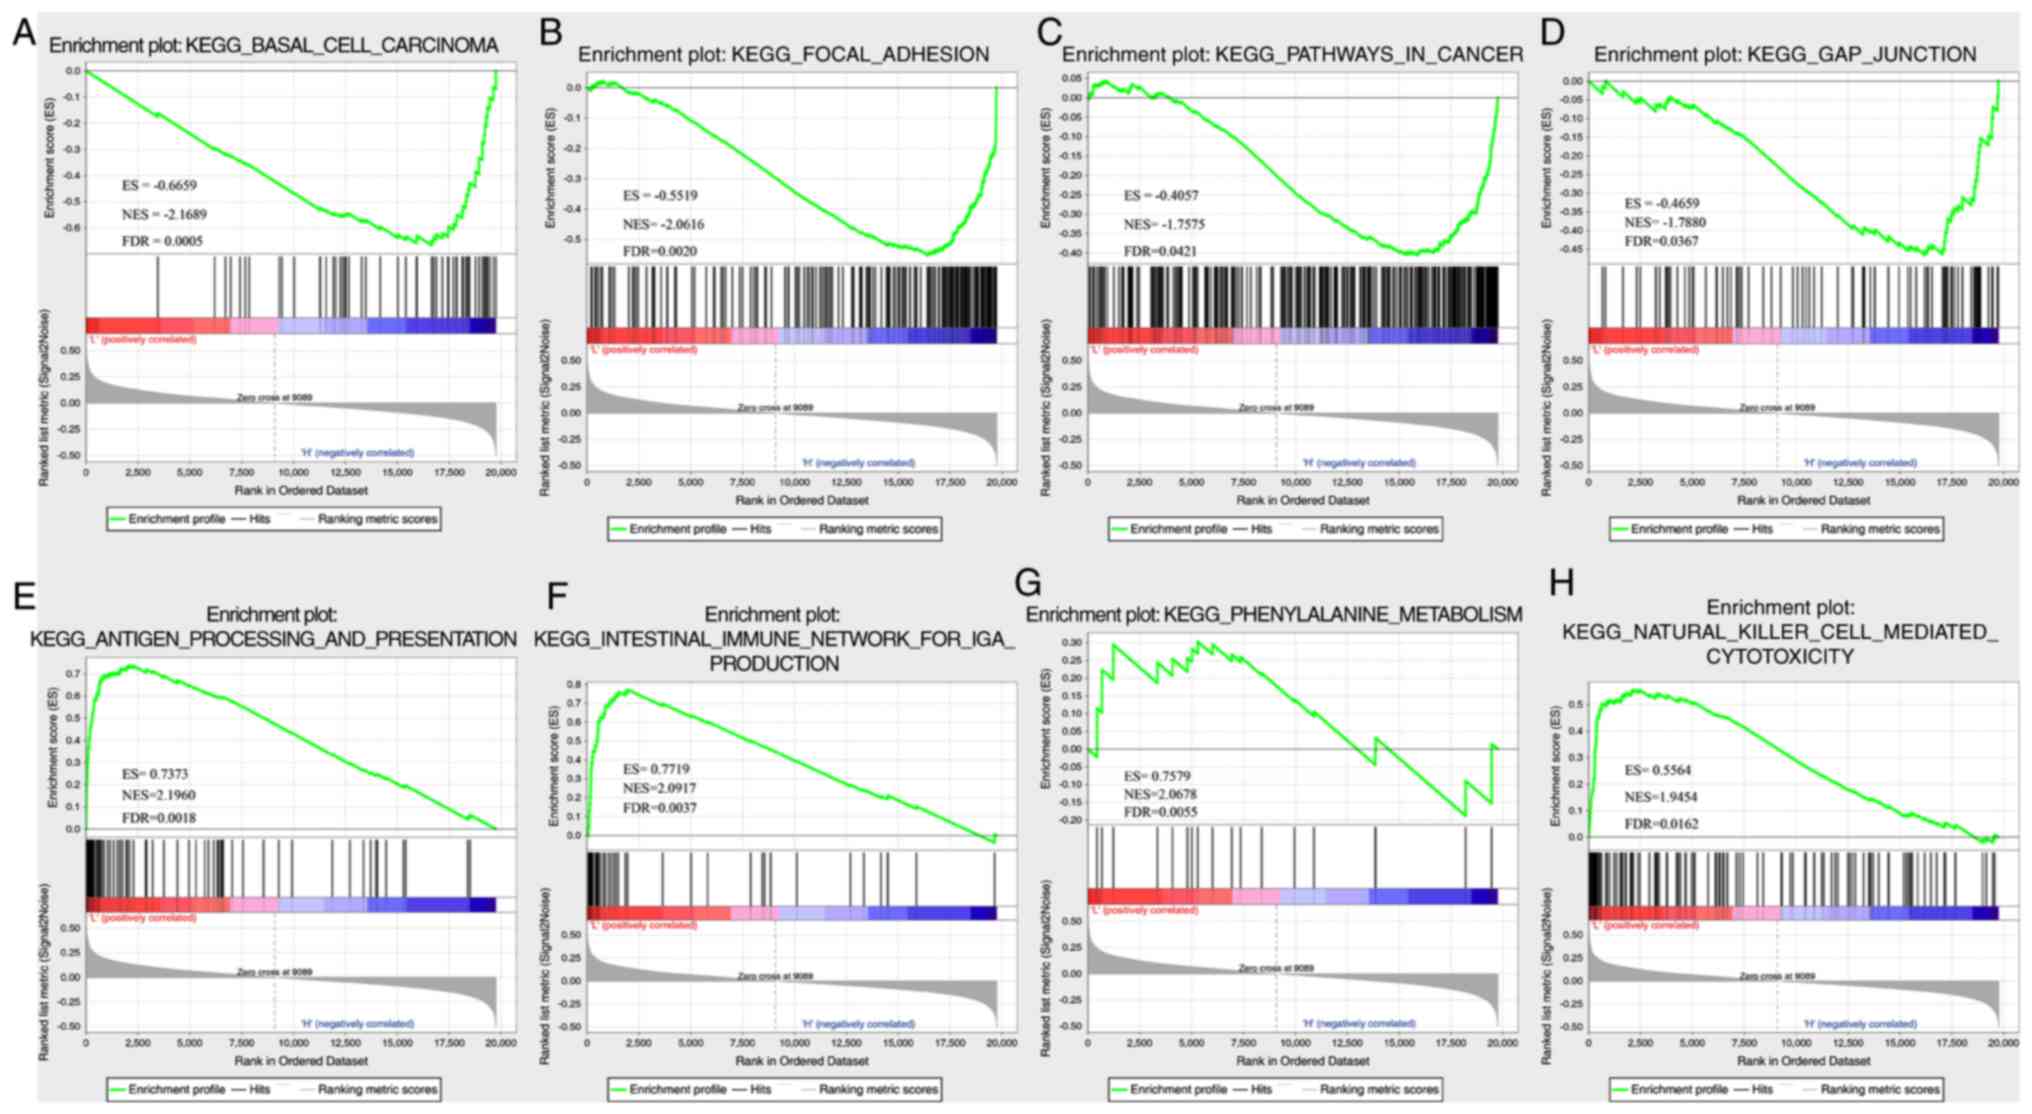
In TCGA dataset, GSEA was performed to determine the
significantly enriched pathways in the high- and low-risk groups,
and a total of 26 pathways were identified (Table SIX). In the high-risk group, the
enriched pathways were mainly associated with the occurrence,
invasion and metastasis of ovarian cancer, including ‘basal cell
carcinoma’, ‘focal differentiation’, ‘pathways in cancer’ and ‘gap
junction’ (Fig. 7A-D). In the
low-risk group, mainly immune-related pathways were enriched, such
as ‘antigen processing and presentation’, ‘intestinal immune
network for IGA PRODUCTIO’, ‘primary immunodeficiency’ and ‘natural
killer cell-mediated cytotoxicity’ (Fig. 7E-H). Thus, the 8-gene signature may
be involved in important biological processes in the development
and progression of ovarian cancer.
The performance of the 8-gene
signature
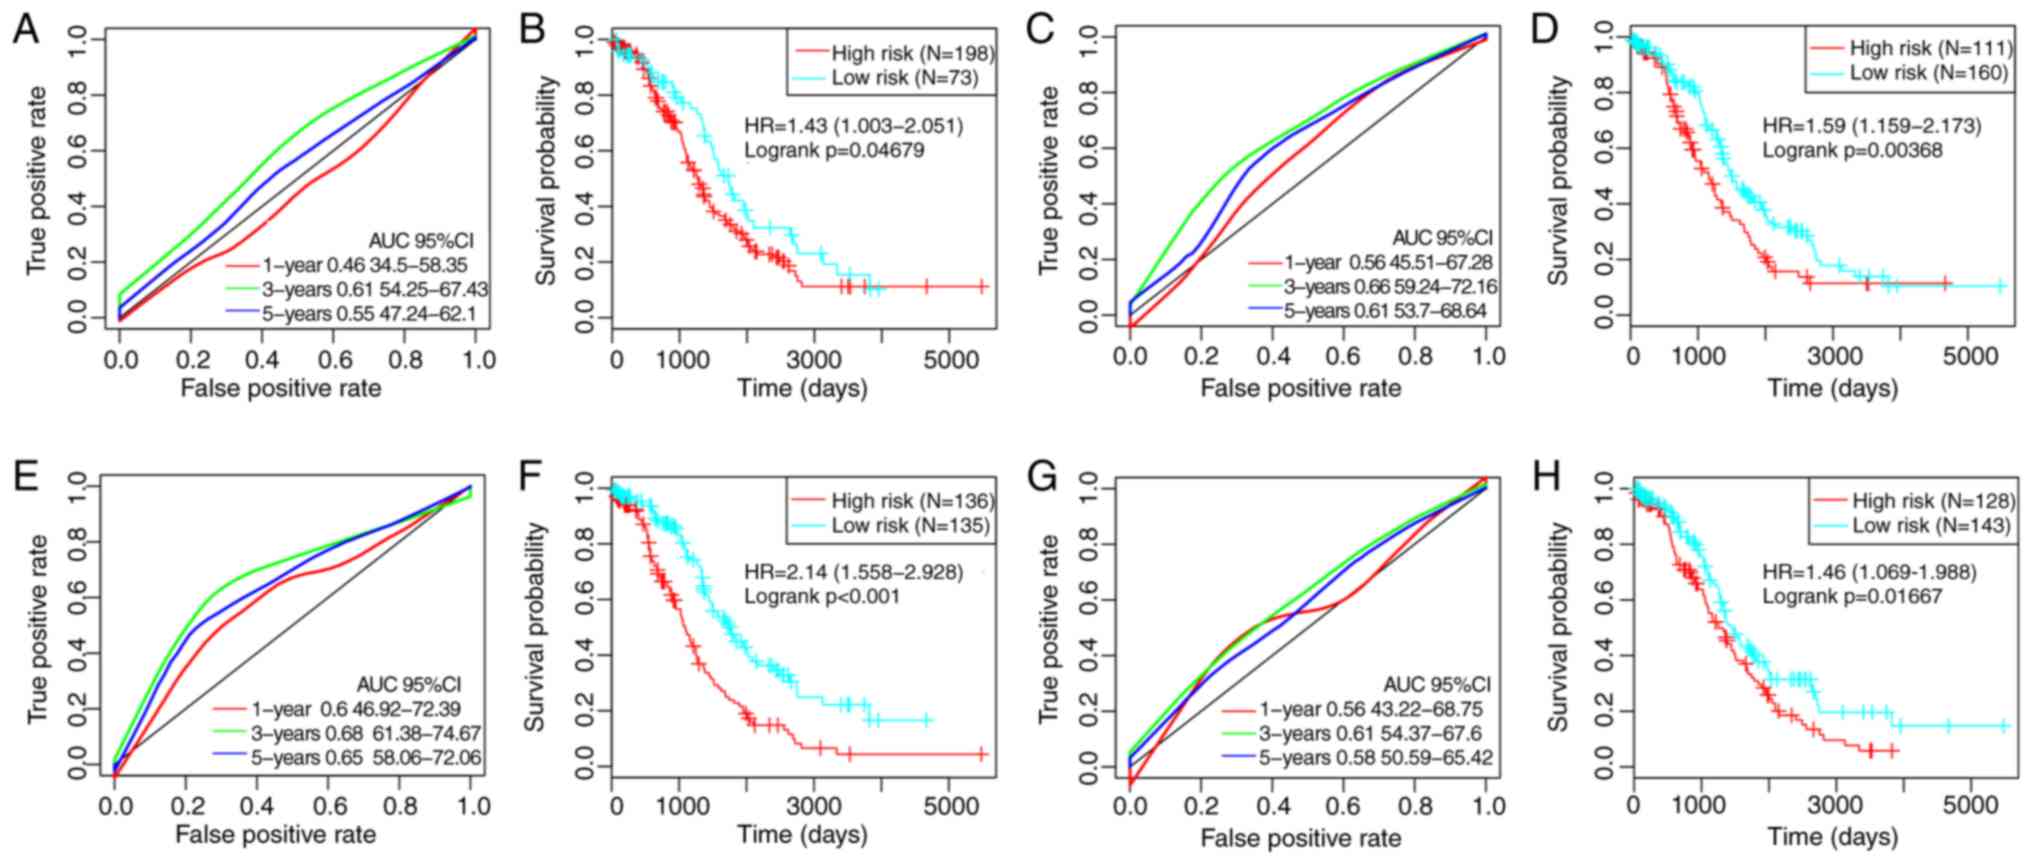
By referring to previous studies, four robust
prognostic risk models were identified, including a 3-gene
(49), a 6-gene (50), an 8-gene (51) and a 5-gene (52) signature. To improve the
comparability of the models, the risk score of each ovarian cancer
sample in TCGA was calculated according to the corresponding genes
in the four models by applying the same method. The ROC of each
model was evaluated, the samples were divided into high- and
low-risk groups according to the median risk score, and the OS
differences between the two groups were calculated (Fig. 8). Significant differences were
observed in the four models in predicting OS prognosis between the
two groups (P<0.05). However, the AUCs of the four gene models
were lower compared with the 8-gene signature developed in the
present study, indicating that the 8-gene signature in the present
study exhibited a better predictive performance.
Discussion
Previous studies have demonstrated that abnormal
metabolism is one of the markers of cancer cells, and that there
are differences between healthy and tumor cells in energy
metabolism (58–60); in addition, various catabolic
pathways, for example, glycolysis, OXPHOS and fatty acid
metabolism, are involved in energy metabolism (61). In the current study, RNA-seq data
were used to detect local energy metabolism-related gene expression
status and their prognostic value for patients with ovarian cancer.
The results identified three energy metabolism-related molecular
subtypes, of which C1 was associated with a poor prognosis, and the
profile of the immune cells in the tumor microenvironment in this
subtype was different from the other two subtypes. Previous studies
have demonstrated that the interaction between cancer cells and the
tumor microenvironment affects cancer proliferation, energy
metabolism, metastasis and recurrence (62), and energy metabolism serves an
important role in immune regulation (63). The occurrence of aerobic glycolysis
in tumor cells can shape the immune system by increasing the
transcription of cytokines and inhibiting the differentiation of
monocytes into dendritic cells (64,65).
Therefore, abnormal energy metabolism may lead to different
prognostic outcomes by altering the state of immune cells in the
tumor microenvironment.
Ovarian cancer is a highly heterogeneous disease, as
patients with similar Tumor-Node-Metastasis (TNM) staging have
different survival times (66). At
present, traditional clinicopathological indicators such as tumor
size, vascular invasion, portal vein tumor thrombus and TNM staging
do not satisfy the current needs in predicting individual outcomes,
especially risk stratification, and the ‘one-size-fits-all’
treatment strategy has been demonstrated to be ineffective
(67,68). Screening prognostic molecular
markers that fully reflect the biological characteristics of tumors
has value in individualized prevention and treatment of patients
with ovarian cancer (69,70). In the current study, abnormal tumor
energy metabolism was associated with poor prognosis. Energy
metabolism-related gene expression levels were associated with
clinical and molecular characteristics of patients with ovarian
cancer. Thus, the present study developed a signature based on
subtypes of abnormal energy metabolism that could stratify high-
and low-risk patients. Of note, such energy metabolism-related
genes may serve as a powerful prognostic indicator and help decide
targeted therapies for patients with ovarian cancer based on energy
metabolism.
In the 8-gene signature developed in the present
study, TLL1, COL16A1, PTGFR, CILP2, KIF26B and GAS1 were identified
as risk factors, whereas IFI27 and CCR7 were protective factors.
Previous studies have reported that COL16A1 is involved in the
progression of ovarian cancer (53), PTGFR is a potential serum marker for
early diagnosis of ovarian cancer (54), upregulation of KIF26B promotes the
proliferation and migration of ovarian cancer cells (55), and IFI27 promotes
epithelial-mesenchymal transition and induces ovarian
tumorigenicity (56). Thus, these
genes are associated with the prognosis of ovarian cancer. The GSEA
results of the present study revealed that the eight genes were
enriched in the pathways and biological processes of ovarian cancer
development. These results suggested that the signature may have
clinical value and may provide a potential target for the diagnosis
of ovarian cancer.
Although the association between the expression
levels of energy metabolism-related genes and the prognosis of
ovarian cancer were analyzed by bioinformatics and the
characteristics related to energy metabolism were explored, the
current study had limitations; for example, a number of samples
lacked clinical follow-up information, and factors such as the
presence of other diseases were not considered to distinguish their
effects from those of prognostic biomarkers. In addition, the
results were obtained only through bioinformatics analysis; other
experiments should be performed to ensure the accuracy of the
current results. Finally, key proteins in all metabolic pathways
are under the control of post-translational modifications, and not
necessarily by up/downregulation of their absolute levels.
In conclusion, the current study determined the
expression levels of energy metabolism-related genes and their
predictive values in ovarian cancer prognosis and established an
8-gene signature related to energy metabolism, which was be able to
determine the risk levels in patients with ovarian cancer. The test
and validation datasets exhibited high AUCs, and the results were
independent of clinical features. Compared with clinical features,
the 8-gene signature exhibited improved survival risk prediction
for patients with ovarian cancer. Thus, the 8-gene signature
developed in the present study may be used as a molecular
diagnostic test in assessing the prognosis of patients with ovarian
cancer.
Supplementary Material
Supporting Data
Supporting Data
Supporting Data
Supporting Data
Supporting Data
Supporting Data
Supporting Data
Supporting Data
Supporting Data
Supporting Data
Acknowledgements
Not applicable.
Funding
The current study was supported by the General
Hospital Project of Shengjing Hospital (grant no. M0132).
Availability of data and materials
The datasets generated and analyzed during the
current study are available from the corresponding author on
reasonable request. Table SII is
available at https://github.com/biocn/OD_data/blob/master/Table%20S2.docx.
Authors' contributions
LW conceived and guided the study, analyzed the data
and wrote the manuscript. XQL conceived the study and edited the
manuscript. Both authors read and approved the final
manuscript.
Ethics approval and consent to
participate
Not applicable.
Patient consent for publication
Not applicable.
Competing interests
The authors declare that they have no competing
interests.
Glossary
Abbreviations
Abbreviations:
|
TCGA
|
The Cancer Genome Atlas
|
|
NMF
|
nonnegative matrix factorization
|
|
GEO
|
Gene Expression Omnibus
|
|
OXPHOS
|
oxidative phosphorylation
|
|
TCA
|
tricarboxylic acid
|
|
KEGG
|
Kyoto Encyclopedia of Genes and
Genomes
|
|
GO
|
Gene Ontology
|
|
OS
|
overall survival
|
References
|
1
|
Gansler T, Ganz PA, Grant M, Greene FL,
Johnstone P, Mahoney M, Newman LA, Oh WK, Thomas CR Jr, Thun MJ, et
al: Sixty years of CA: A cancer journal for clinicians. CA Cancer J
Clin. 60:345–350. 2010. View Article : Google Scholar : PubMed/NCBI
|
|
2
|
Coward JI, Middleton K and Murphy F: New
perspectives on targeted therapy in ovarian cancer. Int J Womens
Health. 7:189–203. 2015. View Article : Google Scholar : PubMed/NCBI
|
|
3
|
Cannistra SA: Cancer of the ovary. N Engl
J Med. 351:2519–2529. 2004. View Article : Google Scholar : PubMed/NCBI
|
|
4
|
Kreienbring K, Franz A, Richter R, Dragun
D, Heidecke H, Müller D, Mentze M, Dechend R, Sehouli J and Braicu
EI: The role of PAR1 autoantibodies in patients with primary
epithelial ovarian cancer. Anticancer Res. 38:3619–3625. 2018.
View Article : Google Scholar : PubMed/NCBI
|
|
5
|
du Bois A, Reuss A, Pujade-Lauraine E,
Harter P, Ray-Coquard I and Pfisterer J: Role of surgical outcome
as prognostic factor in advanced epithelial ovarian cancer: A
combined exploratory analysis of 3 prospectively randomized phase 3
multicenter trials: By the Arbeitsgemeinschaft Gynaekologische
Onkologie Studiengruppe Ovarialkarzinom (AGO-OVAR) and the Groupe
d'Investigateurs Nationaux Pour les Etudes des Cancers de l'Ovaire
(GINECO). Cancer. 115:1234–1244. 2009. View Article : Google Scholar : PubMed/NCBI
|
|
6
|
Ozols RF, Bundy BN, Greer BE, Fowler JM,
Clarke-Pearson D, Burger RA, Mannel RS, DeGeest K, Hartenbach EM
and Baergen R; Gynecologic Oncology Group, : Phase III trial of
carboplatin and paclitaxel compared with cisplatin and paclitaxel
in patients with optimally resected stage III ovarian cancer: A
Gynecologic Oncology Group study. J Clin Oncol. 21:3194–3200. 2003.
View Article : Google Scholar : PubMed/NCBI
|
|
7
|
Derlatka P, Sienko J, Grabowska-Derlatka
L, Palczewski P, Danska-Bidzinska A, Bidzinski M and Czajkowski K:
Results of optimal debulking surgery with bowel resection in
patients with advanced ovarian cancer. World J Surg Oncol.
14:582016. View Article : Google Scholar : PubMed/NCBI
|
|
8
|
Bristow RE, Tomacruz RS, Armstrong DK,
Trimble EL and Montz FJ: Survival effect of maximal cytoreductive
surgery for advanced ovarian carcinoma during the platinum era: A
meta-analysis. J Clin Oncol. 20:1248–1259. 2002. View Article : Google Scholar : PubMed/NCBI
|
|
9
|
Dressman HK, Berchuck A, Chan G, Zhai J,
Bild A, Sayer R, Cragun J, Clarke J, Whitaker RS, Li L, et al: An
integrated genomic-based approach to individualized treatment of
patients with advanced-stage ovarian cancer. J Clin Oncol.
25:517–525. 2007. View Article : Google Scholar : PubMed/NCBI
|
|
10
|
Cramer DW, Harlow BL, Willett WC, Welch
WR, Bell DA, Scully RE, Ng WG and Knapp RC: Galactose consumption
and metabolism in relation to the risk of ovarian cancer. Lancet.
2:66–71. 1989. View Article : Google Scholar : PubMed/NCBI
|
|
11
|
Webb PM, Bain CJ, Purdie DM, Harvey PW and
Green A: Milk consumption, galactose metabolism and ovarian cancer
(Australia). Cancer Causes Control. 9:637–644. 1998. View Article : Google Scholar : PubMed/NCBI
|
|
12
|
Nieman KM, Kenny HA, Penicka CV, Ladanyi
A, Buell-Gutbrod R, Zillhardt MR, Romero IL, Carey MS, Mills GB,
Hotamisligil GS, et al: Adipocytes promote ovarian cancer
metastasis and provide energy for rapid tumor growth. Nat Med.
17:1498–1503. 2011. View Article : Google Scholar : PubMed/NCBI
|
|
13
|
Warburg O: On the origin of cancer cells.
Science. 123:309–314. 1956. View Article : Google Scholar : PubMed/NCBI
|
|
14
|
Gambhir SS: Molecular imaging of cancer
with positron emission tomography. Nat Rev Cancer. 2:683–693. 2002.
View Article : Google Scholar : PubMed/NCBI
|
|
15
|
Lunt SY and Vander Heiden MG: Aerobic
glycolysis: Meeting the metabolic requirements of cell
proliferation. Annu Rev Cell Dev Biol. 27:441–464. 2011. View Article : Google Scholar : PubMed/NCBI
|
|
16
|
Schornack PA and Gillies RJ: Contributions
of cell metabolism and H+ diffusion to the acidic pH of tumors.
Neoplasia. 5:135–145. 2003. View Article : Google Scholar : PubMed/NCBI
|
|
17
|
Smallbone K, Gavaghan DJ, Gatenby RA and
Maini PK: The role of acidity in solid tumour growth and invasion.
J Theor Biol. 235:476–484. 2005. View Article : Google Scholar : PubMed/NCBI
|
|
18
|
Fumarola C, Petronini PG and Alfieri R:
Impairing energy metabolism in solid tumors through agents
targeting oncogenic signaling pathways. Biochem Pharmacol.
151:114–125. 2018. View Article : Google Scholar : PubMed/NCBI
|
|
19
|
Sonveaux P, Végran F, Schroeder T, Wergin
MC, Verrax J, Rabbani ZN, De Saedeleer CJ, Kennedy KM, Diepart C,
Jordan BF, et al: Targeting lactate-fueled respiration selectively
kills hypoxic tumor cells in mice. J Clin Invest. 118:3930–3942.
2008.PubMed/NCBI
|
|
20
|
Whitaker-Menezes D, Martinez-Outschoorn
UE, Flomenberg N, Birbe RC, Witkiewicz AK, Howell A, Pavlides S,
Tsirigos A, Ertel A, Pestell RG, et al: Hyperactivation of
oxidative mitochondrial metabolism in epithelial cancer cells in
situ: Visualizing the therapeutic effects of metformin in tumor
tissue. Cell Cycle. 10:4047–4064. 2011. View Article : Google Scholar : PubMed/NCBI
|
|
21
|
Faubert B, Li KY, Cai L, Hensley CT, Kim
J, Zacharias LG, Yang C, Do QN, Doucette S, Burguete D, et al:
Lactate metabolism in human lung tumors. Cell. 171:358–371.e9.
2017. View Article : Google Scholar : PubMed/NCBI
|
|
22
|
Bonuccelli G, Tsirigos A, Whitaker-Menezes
D, Pavlides S, Pestell RG, Chiavarina B, Frank PG, Flomenberg N,
Howell A, Martinez-Outschoorn UE, et al: Ketones and lactate ‘fuel’
tumor growth and metastasis: Evidence that epithelial cancer cells
use oxidative mitochondrial metabolism. Cell Cycle. 9:3506–3514.
2010. View Article : Google Scholar : PubMed/NCBI
|
|
23
|
Le A, Lane AN, Hamaker M, Bose S, Gouw A,
Barbi J, Tsukamoto T, Rojas CJ, Slusher BS, Zhang H, et al:
Glucose-independent glutamine metabolism via TCA cycling for
proliferation and survival in B cells. Cell Metab. 15:110–121.
2012. View Article : Google Scholar : PubMed/NCBI
|
|
24
|
Prudkov PN: Mental effort and fatigue as
consequences of monotony. Behav Brain Sci. 36:702–703; discussion
707–726. 2013. View Article : Google Scholar : PubMed/NCBI
|
|
25
|
Wu F, Zhao Z, Chai RC, Liu YQ, Li GZ,
Jiang HY and Jiang T: Prognostic power of a lipid metabolism gene
panel for diffuse gliomas. J Cell Mol Med. 23:7741–7748. 2019.
View Article : Google Scholar : PubMed/NCBI
|
|
26
|
Zhou Z, Huang R, Chai R, Zhou X, Hu Z,
Wang W, Chen B, Deng L, Liu Y and Wu F: Identification of an energy
metabolism-related signature associated with clinical prognosis in
diffuse glioma. Aging (Albany NY). 10:3185–3209. 2018. View Article : Google Scholar : PubMed/NCBI
|
|
27
|
Liu YQ, Chai RC, Wang YZ, Wang Z, Liu X,
Wu F and Jiang T: Amino acid metabolism-related gene
expression-based risk signature can better predict overall survival
for glioma. Cancer Sci. 110:321–333. 2019. View Article : Google Scholar : PubMed/NCBI
|
|
28
|
Ma B, Jiang H, Wen D, Hu J, Han L, Liu W,
Xu W, Shi X, Wei W, Liao T, et al: Transcriptome analyses identify
a metabolic gene signature indicative of dedifferentiation of
papillary thyroid cancer. J Clin Endocrinol Metab. 104:3713–3725.
2019. View Article : Google Scholar : PubMed/NCBI
|
|
29
|
Luo X, Yu H, Song Y and Sun T: Integration
of metabolomic and transcriptomic data reveals metabolic pathway
alteration in breast cancer and impact of related signature on
survival. J Cell Physiol. 234:13021–13031. 2019. View Article : Google Scholar : PubMed/NCBI
|
|
30
|
Liu GM, Xie WX, Zhang CY and Xu JW:
Identification of a four-gene metabolic signature predicting
overall survival for hepatocellular carcinoma. J Cell Physiol.
235:1624–1636. 2020. View Article : Google Scholar : PubMed/NCBI
|
|
31
|
Gentric G, Kieffer Y, Mieulet V, Goundiam
O, Bonneau C, Nemati F, Hurbain I, Raposo G, Popova T, Stern MH, et
al: PML-regulated mitochondrial metabolism enhances
chemosensitivity in human ovarian cancers. Cell Metab.
29:156–173.e10. 2019. View Article : Google Scholar : PubMed/NCBI
|
|
32
|
Fabregat A, Jupe S, Matthews L,
Sidiropoulos K, Gillespie M, Garapati P, Haw R, Jassal B, Korninger
F, May B, et al: The reactome pathway knowledgebase. Nucleic Acids
Res. 46:D649–D655. 2018. View Article : Google Scholar : PubMed/NCBI
|
|
33
|
Gautier L, Cope L, Bolstad BM and Irizarry
RA: Affy-analysis of Affymetrix GeneChip data at the probe level.
Bioinformatics. 20:307–315. 2004. View Article : Google Scholar : PubMed/NCBI
|
|
34
|
Guo JC, Wu Y, Chen Y, Pan F, Wu ZY, Zhang
JS, Wu JY, Xu XE, Zhao JM, Li EM, et al: Protein-coding genes
combined with long noncoding RNA as a novel transcriptome molecular
staging model to predict the survival of patients with esophageal
squamous cell carcinoma. Cancer Commun (Lond). 38:42018. View Article : Google Scholar : PubMed/NCBI
|
|
35
|
Mirzal A: Nonparametric tikhonov
regularized NMF and its application in cancer clustering. IEEE/ACM
Trans Comput Biol Bioinform. 11:1208–1217. 2014. View Article : Google Scholar : PubMed/NCBI
|
|
36
|
Yu N, Gao YL, Liu JX, Shang J, Zhu R and
Dai LY: Co-differential gene selection and clustering based on
graph regularized multi-view NMF in cancer genomic data. Genes
(Basel). 9:E5862018. View Article : Google Scholar : PubMed/NCBI
|
|
37
|
Ye C, Toyoda K and Ohtsuki T: Blind source
separation on non-contact heartbeat detection by non-negative
matrix factorization algorithms. IEEE Trans Biomed Eng. 67:482–494.
2019. View Article : Google Scholar : PubMed/NCBI
|
|
38
|
Li B, Severson E, Pignon JC, Zhao H, Li T,
Novak J, Jiang P, Shen H, Aster JC, Rodig S, et al: Comprehensive
analyses of tumor immunity: Implications for cancer immunotherapy.
Genome Biol. 17:1742016. View Article : Google Scholar : PubMed/NCBI
|
|
39
|
Love MI, Huber W and Anders S: Moderated
estimation of fold change and dispersion for RNA-seq data with
DESeq2. Genome Biol. 15:5502014. View Article : Google Scholar : PubMed/NCBI
|
|
40
|
Hänzelmann S, Castelo R and Guinney J:
GSVA: Gene set variation analysis for microarray and RNA-seq data.
BMC Bioinformatics. 14:72013. View Article : Google Scholar : PubMed/NCBI
|
|
41
|
Yu G, Wang LG, Han Y and He QY:
clusterProfiler: An R package for comparing biological themes among
gene clusters. OMICS. 16:284–287. 2012. View Article : Google Scholar : PubMed/NCBI
|
|
42
|
Kostareli E, Hielscher T, Zucknick M,
Baboci L, Wichmann G, Holzinger D, Mücke O, Pawlita M, Del Mistro
A, Boscolo-Rizzo P, et al: Gene promoter methylation signature
predicts survival of head and neck squamous cell carcinoma
patients. Epigenetics. 11:61–73. 2016. View Article : Google Scholar : PubMed/NCBI
|
|
43
|
Zhang JX, Song W, Chen ZH, Wei JH, Liao
YJ, Lei J, Hu M, Chen GZ, Liao B, Lu J, et al: Prognostic and
predictive value of a microRNA signature in stage II colon cancer:
A microRNA expression analysis. Lancet Oncol. 14:1295–1306. 2013.
View Article : Google Scholar : PubMed/NCBI
|
|
44
|
Papaemmanuil E, Gerstung M, Malcovati L,
Tauro S, Gundem G, Van Loo P, Yoon CJ, Ellis P, Wedge DC,
Pellagatti A, et al: Clinical and biological implications of driver
mutations in myelodysplastic syndromes. Blood. 122:3616–3627; quiz
3699. 2013. View Article : Google Scholar : PubMed/NCBI
|
|
45
|
Yuan Y, Van Allen EM, Omberg L, Wagle N,
Amin-Mansour A, Sokolov A, Byers LA, Xu Y, Hess KR, Diao L, et al:
Assessing the clinical utility of cancer genomic and proteomic data
across tumor types. Nat Biotechnol. 32:644–652. 2014. View Article : Google Scholar : PubMed/NCBI
|
|
46
|
Friedman J, Hastie T and Tibshirani R:
Regularization paths for generalized linear models via coordinate
descent. J Stat Softw. 33:1–22. 2010. View Article : Google Scholar : PubMed/NCBI
|
|
47
|
Subramanian A, Kuehn H, Gould J, Tamayo P
and Mesirov JP: GSEA-P: A desktop application for gene set
enrichment analysis. Bioinformatics. 23:3251–3253. 2007. View Article : Google Scholar : PubMed/NCBI
|
|
48
|
Liberzon A, Subramanian A, Pinchback R,
Thorvaldsdóttir H, Tamayo P and Mesirov JP: Molecular signatures
database (MSigDB) 3.0. Bioinformatics. 27:1739–1740. 2011.
View Article : Google Scholar : PubMed/NCBI
|
|
49
|
Zhou J, Yi Y, Wang C, Su C and Luo Y:
Identification of a 3-mRNA signature as a novel potential
prognostic biomarker in patients with ovarian serous
cystadenocarcinoma in G2 and G3. Oncol Lett. 18:3545–3552.
2019.PubMed/NCBI
|
|
50
|
Wang Q, Lu Z, Ma J, Zhang Q, Wang N, Qian
L, Zhang J, Chen C and Lu B: Six-mRNA risk score system and
nomogram constructed for patients with ovarian cancer. Oncol Lett.
18:1235–1245. 2019.PubMed/NCBI
|
|
51
|
An Y, Bi F, You Y, Liu X and Yang Q:
Development of a novel autophagy-related prognostic signature for
serous ovarian cancer. J Cancer. 9:4058–4071. 2018. View Article : Google Scholar : PubMed/NCBI
|
|
52
|
Wang R, Ye XH, Zhao XL, Liu JL and Zhang
CY: Development of a five-gene signature as a novel prognostic
marker in ovarian cancer. Neoplasma. 66:343–349. 2019. View Article : Google Scholar : PubMed/NCBI
|
|
53
|
Verhaak RG, Tamayo P, Yang JY, Hubbard D,
Zhang H, Creighton CJ, Fereday S, Lawrence M, Carter SL, Mermel CH,
et al: Prognostically relevant gene signatures of high-grade serous
ovarian carcinoma. J Clin Invest. 123:517–525. 2013.PubMed/NCBI
|
|
54
|
Yoshihara K, Tajima A, Komata D, Yamamoto
T, Kodama S, Fujiwara H, Suzuki M, Onishi Y, Hatae M, Sueyoshi K,
et al: Gene expression profiling of advanced-stage serous ovarian
cancers distinguishes novel subclasses and implicates ZEB2 in tumor
progression and prognosis. Cancer Sci. 100:1421–1428. 2009.
View Article : Google Scholar : PubMed/NCBI
|
|
55
|
Anderson KS, Cramer DW, Sibani S,
Wallstrom G, Wong J, Park J, Qiu J, Vitonis A and LaBaer J:
Autoantibody signature for the serologic detection of ovarian
cancer. J Proteome Res. 14:578–586. 2015. View Article : Google Scholar : PubMed/NCBI
|
|
56
|
Yang X, Zhang L and Xie L: Upregulation of
KIF26B, cell migration and proliferation of human ovarian cancer
cell lines in vitro, and patient outcomes from human bioinformatic
analysis. Med Sci Moni. 24:3863–3872. 2018. View Article : Google Scholar
|
|
57
|
Li S, Xie Y, Zhang W, Gao J, Wang M, Zheng
G, Yin X, Xia H and Tao X: Interferon alpha-inducible protein 27
promotes epithelial-mesenchymal transition and induces ovarian
tumorigenicity and stemness. J Surg Res. 193:255–264. 2015.
View Article : Google Scholar : PubMed/NCBI
|
|
58
|
Joshi A, Dai L, Liu Y, Lee J, Ghahhari NM,
Segala G, Beebe K, Jenkins LM, Lyons GC, Bernasconi L, et al: The
mitochondrial HSP90 paralog TRAP1 forms an OXPHOS-regulated
tetramer and is involved in mitochondrial metabolic homeostasis.
BMC Biol. 18:102020. View Article : Google Scholar : PubMed/NCBI
|
|
59
|
Valle-Mendiola A and Soto-Cruz I: Energy
metabolism in cancer: The roles of STAT3 and STAT5 in the
regulation of metabolism-related genes. Cancers (Basel).
12:E1242020. View Article : Google Scholar : PubMed/NCBI
|
|
60
|
Meng N, Glorieux C, Zhang Y, Liang L, Zeng
P, Lu W and Huang P: Oncogenic K-ras induces mitochondrial OPA3
expression to promote energy metabolism in pancreatic cancer cells.
Cancers (Basel). 12:E652019. View Article : Google Scholar : PubMed/NCBI
|
|
61
|
Ha JH, Radhakrishnan R, Jayaraman M, Yan
M, Ward JD, Fung KM, Moxley K, Sood AK, Isidoro C, Mukherjee P, et
al: LPA induces metabolic reprogramming in ovarian cancer via a
pseudohypoxic response. Cancer Res. 78:1923–1934. 2018. View Article : Google Scholar : PubMed/NCBI
|
|
62
|
Cateau X, Simon P and Noël JC: Stromal
expression of matrix metalloproteinase 2 in cancer-associated
fibroblasts is strongly related to human epidermal growth factor
receptor 2 status in invasive breast carcinoma. Mol Clin Oncol.
4:375–378. 2016. View Article : Google Scholar : PubMed/NCBI
|
|
63
|
Thurnher M, Gruenbacher G and Nussbaumer
O: Regulation of mevalonate metabolism in cancer and immune cells.
Biochim Biophys Acta. 1831:1009–1015. 2013. View Article : Google Scholar : PubMed/NCBI
|
|
64
|
Ghesquière B, Wong BW, Kuchnio A and
Carmeliet P: Metabolism of stromal and immune cells in health and
disease. Nature. 511:167–176. 2014. View Article : Google Scholar : PubMed/NCBI
|
|
65
|
Becker JC, Andersen MH, Schrama D and Thor
Straten P: Immune-suppressive properties of the tumor
microenvironment. Cancer Immunol Immunother. 62:1137–1148. 2013.
View Article : Google Scholar : PubMed/NCBI
|
|
66
|
Colombo I, Garg S, Danesh A, Bruce J, Shaw
P, Tan Q, Quevedo R, Braunstein M, Oza AM, Pugh T and Lheureux S:
Heterogeneous alteration of the ERBB3-MYC axis associated with MEK
inhibitor resistance in a KRAS-mutated low-grade serous ovarian
cancer patient. Cold Spring Harb Mol Case Stud. 5:a0043412019.
View Article : Google Scholar : PubMed/NCBI
|
|
67
|
Llovet JM, Ricci S, Mazzaferro V, Hilgard
P, Gane E, Blanc JF, de Oliveira AC, Santoro A, Raoul JL, Forner A,
et al: Sorafenib in advanced hepatocellular carcinoma. N Engl J
Med. 359:378–390. 2008. View Article : Google Scholar : PubMed/NCBI
|
|
68
|
Cheng AL, Kang YK, Chen Z, Tsao CJ, Qin S,
Kim JS, Luo R, Feng J, Ye S, Yang TS, et al: Efficacy and safety of
sorafenib in patients in the Asia-Pacific region with advanced
hepatocellular carcinoma: A phase III randomised, double-blind,
placebo-controlled trial. Lancet Oncol. 10:25–34. 2009. View Article : Google Scholar : PubMed/NCBI
|
|
69
|
Wang Y: Comment on ‘Circular RNAs and
their emerging roles as diagnostic and prognostic biomarkers in
ovarian cancer,’. Cancer Lett. 2020 Jan 2; 473 (2020) 139–147.
Cancer Lett. 475:12020. View Article : Google Scholar : PubMed/NCBI
|
|
70
|
Martin de la Fuente L, Westbom-Fremer S,
Arildsen NS, Hartman L, Malander S, Kannisto P, Måsbäck A and
Hedenfalk I: PD-1/PD-L1 expression and tumor-infiltrating
lymphocytes are prognostically favorable in advanced high-grade
serous ovarian carcinoma. Virchows Arch. Jan 24–2020.(Epub ahead of
print). View Article : Google Scholar : PubMed/NCBI
|