Introduction
Renal cell carcinoma (RCC) is one of the most common
malignant tumor types worldwide, representing approximately 3–4% of
all human cancers (1). The major
histological type of RCC is clear cell RCC (ccRCC), which accounts
for >70% of all types of kidney cancers (2). The early detection of ccRCC
contributes to a better prognosis (3). In the past decade, the genetic
alterations behind ccRCC have been studied using bioinformatics
analyses (4,5). Bioinformatics analyses have become one
of the most effective tools for analyzing human diseases (6). In addition, rapid technological
advances led by academic institutions have continued to broaden the
application of high-throughput sequencing technology from research
to the clinic (7). Furthermore,
scientists have proposed numerous potential genes that are related
to the prognosis for patients with ccRCC. However, few genes have
been discovered that are valid targets for diagnosis or treatment
(3,8). Therefore, finding further novel
biomarkers of ccRCC, for the diagnosis or treatment, remains
fruitful.
ccRCC is a highly immune-infiltrated tumor (9). Historically, ccRCC was one of the
first malignant tumor types that responded to immunotherapy and
continues to be among the most responsive (10,11).
Previous studies have shown that T cells are the most abundant
immune-infiltrating cells in ccRCC (12). Hence, genes that regulate the
functions of immune cells, especially T cells, may be correlated
with the prognosis and effectiveness of immunotherapy for patients
with ccRCC.
DEF6 guanine nucleotide exchange factor [GEF
(DEF6)], is a 631 amino acid Rho-family GEF (13,14).
It is highly expressed in T and B cells, and regulates various
immune-related processes such as the activation of CD4+
T cells and the differentiation of T helper cells (15,16).
It also regulates cell morphology in cooperation with activated
Rac1, and affects cell differentiation in collaboration with
integrins (17,18). More importantly, as a GEF, DEF6 can
activate genes from the Rho-GTPase family, which contribute to
tumor proliferation, migration and invasion (19). Previous studies have indicated that
high expression levels of DEF6 predict a poor prognosis for
colorectal cancer, ovarian carcinoma and breast cancer (20–22).
It has also been demonstrated that there are high expression levels
of DEF6 in RCC (23). Nevertheless,
to the best of our knowledge, the relationship between DEF6 and
ccRCC is unknown. Therefore, the present study explored the
relationship between DEF6 expression and the prognosis for
ccRCC.
To assess the relationship between the expression of
DEF6 and its prognostic value and potential biological functions
for patients with ccRCC, DEF6 was explored in the TCGA database,
GEO database, TISIDB and the clinical database of Peking University
First Hospital, Beijing, China. It was found that high DEF6
expression levels predicted a poor prognosis for patients with
ccRCC. Furthermore, bioinformatics analyses revealed that DEF6 may
regulate the components of the immune microenvironment to influence
the processes behind ccRCC.
Materials and methods
Extraction of clinical and gene
expression data from the ccRCC databases
Transcription profiles from high-throughput
sequencing fragments per kilobase per million (HTSeq-FPKM) and
corresponding clinical information were obtained from the TCGA
website (https://www.cancer.gov/about-nci/organization/ccg/research/structural-genomics/tcga),
which includes 539 ccRCC samples and 72 normal samples. Nine
microarray datasets were also downloaded from the GEO website
(https://www.ncbi.nlm.nih.gov/gds/).
The data from the GEO databases were translated into log2 values
for sequencing analysis. According to a previously reported method,
if standardized data were not available, the raw data were
downloaded. If a gene was found to have multiple probes in the same
chip, the average value of all probes was taken as the expression
value of the gene (24). Samples
which were neither ccRCC, nor adjacent kidney tissue, were excluded
from the present study. The ‘sva’ R package (version 3.6.1) was
used to remove the batch effect (25). There were more than 700 specimens
obtained from the following GEO datasets: GSE4282, GSE46699,
GSE53757, GSE15641, GSE68417, GSE14994, GSE40435, GSE71963 and
GSE76351.
Patients and specimens
A total of 146 paired samples from patients
diagnosed with ccRCC were included in the resent study. The
patients ranged in age from 20 to 83 years, including 97 males and
51 females. All patients underwent renal resection at Peking
University First Hospital between June 2008 and January 2011.
Clinical data of the recruited patients was obtained from medical
records, such as Fuhrman score and body mass index (BMI). The
present study was supported by the Ethics Committee of Peking
University First Hospital and written informed consent was obtained
from all patients. All procedures were performed according to the
World Medical Association Declaration of Helsinki.
Immunohistochemistry (IHC)
Firstly, the tissue samples were fixed in 10%
formalin for 24 h at room temperature. Subsequently, the 4-µm
paraffin-embedded tissue sections were prepared at room
temperature. Immunostaining was performed using a two-step
detection kit (cat. no. PV-9000; OriGene Technologies, Inc.)
according to the manufacturer's protocol. The sections were
deparaffinized in xylene at room temperature, rehydrated in a
graded alcohol series and then boiled in citrate buffer (pH 6.0)
for 30 min in an autoclave. Endogenous peroxidases were blocked by
incubation in 3% H2O2 for 30 min at room
temperature. The sections were washed in PBS, blocked with 10% goat
serum (OriGene Technologies, Inc.) at room temperature for 1 h and
incubated with anti-DEF6 (cat. no. ab247011; 1:20,000; Abcam) at
4°C overnight. The sections were washed in PBS solution three times
and incubated with a reaction enhancer kit (cat. no. PV-9000;
OriGene Technologies, Inc.) for 20 min at room temperature, then
washed in PBS solution three times. The sections were then
incubated with peroxidase-conjugated secondary antibodies (cat. no.
PV-9000; 1:1,000; OriGene Technologies, Inc.) for 30 min at room
temperature. All slides were counterstained with DAB solution for 3
min and 20% hematoxylin for 1 min at room temperature and
dehydrated. The primary antibody diluent was used as a negative
control.
Evaluation of immunostaining
staining
Two experienced independent investigators (ZZ and
CX) examined all tumor slides by examining five random fields of
view and observing 100 cells per view at ×400 magnification using a
light microscope (Olympus Corporation). The staining intensity was
classified as 0 (no staining), 1 (weak), 2 (moderate) or 3
(strong); The proportion of stained tumor cells was scored as 0
(0–5%), 1 (6–25%), 2 (26–50%), 3 (51–75%), 4 (>75%). The product
of these two variables was used to calculate a final score based on
a previous study (26), as follows:
0 (product of 0–3); 1 (product of 4–6); 2 (product of 7–9); 3
(product of 10–12).
Cell lines
HK-2, 293, 786-O, 769-P, Caki-1, ACHN, A498 and
OSCR2 were acquired from the American Type Culture Collection.
Cells were cultured in DMEM (Invitrogen; Thermo Fisher Scientific,
Inc.) or 1640 media (Invitrogen; Thermo Fisher Scientific)
containing 10% FCS (Invitrogen; Thermo Fisher Scientific, Inc.) and
1% penicillin-streptomycin (Gibco; Thermo Fisher Scientific, Inc.).
Cells were cultured in 10 mm culture dishes in a 5% humidified
atmosphere at 37°C.
Reverse transcription-quantitative PCR
(RT-qPCR)
Total RNA from 20 paired clinical samples was
obtained from 20 patients diagnosed with ccRCC by Peking University
First Hospital and extracted using TRIzol reagent®
according to the manufacturer's protocol (Invitrogen; Thermo Fisher
Scientific). Subsequently, cDNA was synthesized from 5–10 µg of
total RNA using the Super Master Mix synthesis kit (Takara Bio,
Inc), and the used condition of synthesizing cDNA were as follow:
15 min at 37°C, 5 sec at 85°C and 5 min at 4°C. Then,
quantification of all gene transcripts was performed by RT-qPCR
using the SYBR Premix ExTaq kit (Takara Bio, Inc.) and α-tubulin
was used as a normalizing control. The primer pairs used were as
follows: DEF6 forward primer, 5′-TACATGCCCTACCTCAACAAGT-3′ and
reverse primer, 5′-TGTTCCCGTTGCTATCTGCC-3′; α-tubulin forward
primer, 5′-ACCTTAACCGCCTTATTAGCCA-3′ and reverse primer,
5′-CACCACGGTACAACAGGCA-3′. Each reaction was performed four times
and the qPCR conditions used were as follows: 10 min at 95°C, 40
cycles of 15 sec at 95°C and 1 min at 60°C. The 2−ΔΔCq
method was used to calculate the relative gene expression level
(27). The relative mRNA expression
levels were further normalized using the following formula:
Z=(x-μ)/σ, where ‘x’ represents the observation of the sample
expression, ‘μ’ represents the sample mean expression, and ‘σ’
represents the sample SD (28).
Western blot analysis
Total proteins from cells were extracted using the
NP-40 lysis buffer (cat. no. P0013F; Beyotime Institute of
Biotechnology) and quantified using the BCA method. The supernatant
(20 µg of protein) was denatured and separated on 10% SDS-PAGE.
Samples were then transferred to 0.22-µm PVDF membranes and blocked
in skimmed milk for 1 h at room temperature. After that, samples
were incubated overnight at 4°C with the antibodies against DEF6
(cat. no. ab247011; 1:1,000; Abcam) and β-actin (cat. no. sc47778;
1:1,000; Santa Cruz Biotechnology, Inc.). After incubation with
peroxidase-coupled anti-rabbit IgG (cat. no. 7074; 1:1,000, Cell
Signaling Technology, Inc.) at 37°C for 2 h, bound proteins were
visualized using an ECL kit (Pierce; Thermo Fisher Scientific,
Inc.) and detected using a DNR Bioimaging System (DNR Bio-Imaging
Systems, Ltd.). Relative protein levels were quantified using
β-actin as the loading control.
Identification of differentially
expressed genes (DEGs) related to DEF6 expression
According to the DEF6 median expression in ccRCC
samples, the analyzed groups were divided into a low DEF6
expression group (n=269) and a high DEF6 expression group (n=270)
(29). Subsequently, the ‘DESeq2’
package and ‘edgeR’ R package (version 3.6.1) were used to screen
DEGs between samples. Those with an absolute log2 fold-change >1
and a false discovery rate (FDR) <0.05 in the TCGA or GEO
database were considered statistically significant.
Protein-protein interaction (PPI)
network analysis
STRING version 11.0 (https://string-db.org/) was used to evaluate the PPI
information of all DEGs related to DEF6 expression. The PPI network
included 108 nodes and 324 edges. Subsequently, Cytoscape (version
3.7.1; http://cytoscape.org/) was used to
analyze the PPI network, where a low degree value is correlated
with a small node size, and a low co-expression value is related to
a small edge size. Furthermore, genes with degrees ≥20 were
selected as hub genes, and interactions (combined score >0.4)
were considered significant. The interaction network of these
proteins was visualized using Cytoscape 3.7.1 and the molecular
complex detection (MCODE) plug selected necessary modules were
applied (both MCODE score and node number >4) (30).
Functional enrichment analyses of DEGs
related to DEF6 expression
To further explore the mechanism of action DEF6 in
regulating ccRCC, gene ontology (GO) enrichment analysis and Kyoto
Encyclopedia of Genes and Genomes (KEGG) pathway analysis were
performed using the ‘ggplot2’ R package (version 3.6.1; http://www.rstudio.com/). A P-value of <0.05 was
considered statistically significant (31).
Moreover, gene set enrichment analysis (GSEA) was
performed to identify the potential biological pathways. GSEA
software (version 4.0.3; http://software.broadinstitute.org/gsea/index.jsp) was
conducted on the JAVA 8.0 platform. By using the TCGA database, the
high group and low group were classified according to the average
mRNA expression levels of DEF6. For each analysis, gene set
permutations were implemented 1,000 times. Significantly enriched
gene sets were identified, which produced FDR q-values <0.05
(32).
TISIDB analysis
The TISIDB database (http://cis.hku.hk/TISIDB) integrated high-throughput
data from 988 reported immune-related anti-tumor genes. The
database enabled the analysis of correlations for the expression of
selected genes with the expression of lymphocytes, immunomodulators
and chemokines (33). In the
present study, the relationships between the expression levels of
DEF6 and lymphocytes as well as immunomodulators across various
types human cancers, especially ccRCC, were investigated.
Statistical analysis
In the present study, unpaired t-tests were used to
compare the mRNA expression levels in ccRCC tissues and normal
renal tissues from the TCGA and GEO database, using SPSS 26.0 (IBM
Corp.). One-way ANOVAs were conducted to calculate the difference
among multiple groups, and Bonferroni's corrections were used for
the post-hoc tests. Patients with unclear values (NX, MX, GX) or
missing values were excluded from subsequent analyses. Paired
t-tests were performed to calculate the differences between paired
samples and the Wilcoxon signed rank test was used to calculate the
differences among IHC scores of clinical samples. The Pearson's
correlation analysis was used to calculate the correlation between
DEF6 expression and clinical parameters. The Kaplan-Meier method
and Cox regression were used to compare the impact of DEF6
expression on the overall survival (OS) of patients alongside other
clinical variables in both the TCGA database and the present
clinical database. All P-values are based on a two-sided
statistical analysis, and P<0.05 was considered to indicate a
statistically significant difference.
Results
DEF6 mRNA expression levels are
upregulated in ccRCC
the DEF6 mRNA expression levels were assessed in
ccRCC using the GEO database, the TCGA database, clinical samples
collected from the present study and cell lines. Firstly, compared
with normal samples, in the ccRCC samples, the DEF6 mRNA expression
levels were upregulated in the 9 GEO datasets (Fig. 1A). Furthermore, a forest plot, based
on the standardized mean difference, showed the meta-analysis of 9
GEO datasets (Fig. 1E). The
outcomes similarly indicated that DEF6 mRNA expression levels in
ccRCC samples were upregulated in the 9 GEO datasets compared with
the normal samples. In the TCGA database, the DEF6 mRNA expression
levels were also increased in ccRCC (Fig. 1B). Furthermore, the DEF6 mRNA
expression levels were elevated in 20 paired clinical samples
(Fig. 1C). The relative DEF6 mRNA
expression levels between the ccRCC tissues and paired normal
tissues in each sample is also shown (Fig. 1F). In most samples, the mRNA
expression levels of DEF6 in the ccRCC tissues was higher than that
of the normal controls. In addition, the outcome of RT-qPCR in RCC
cell lines showed that the DEF6 mRNA expression levels were
significantly upregulated in the 786-O, ACHN, OSRC-2, and A498
cells compared to the HK-2 cells (Fig.
1D).
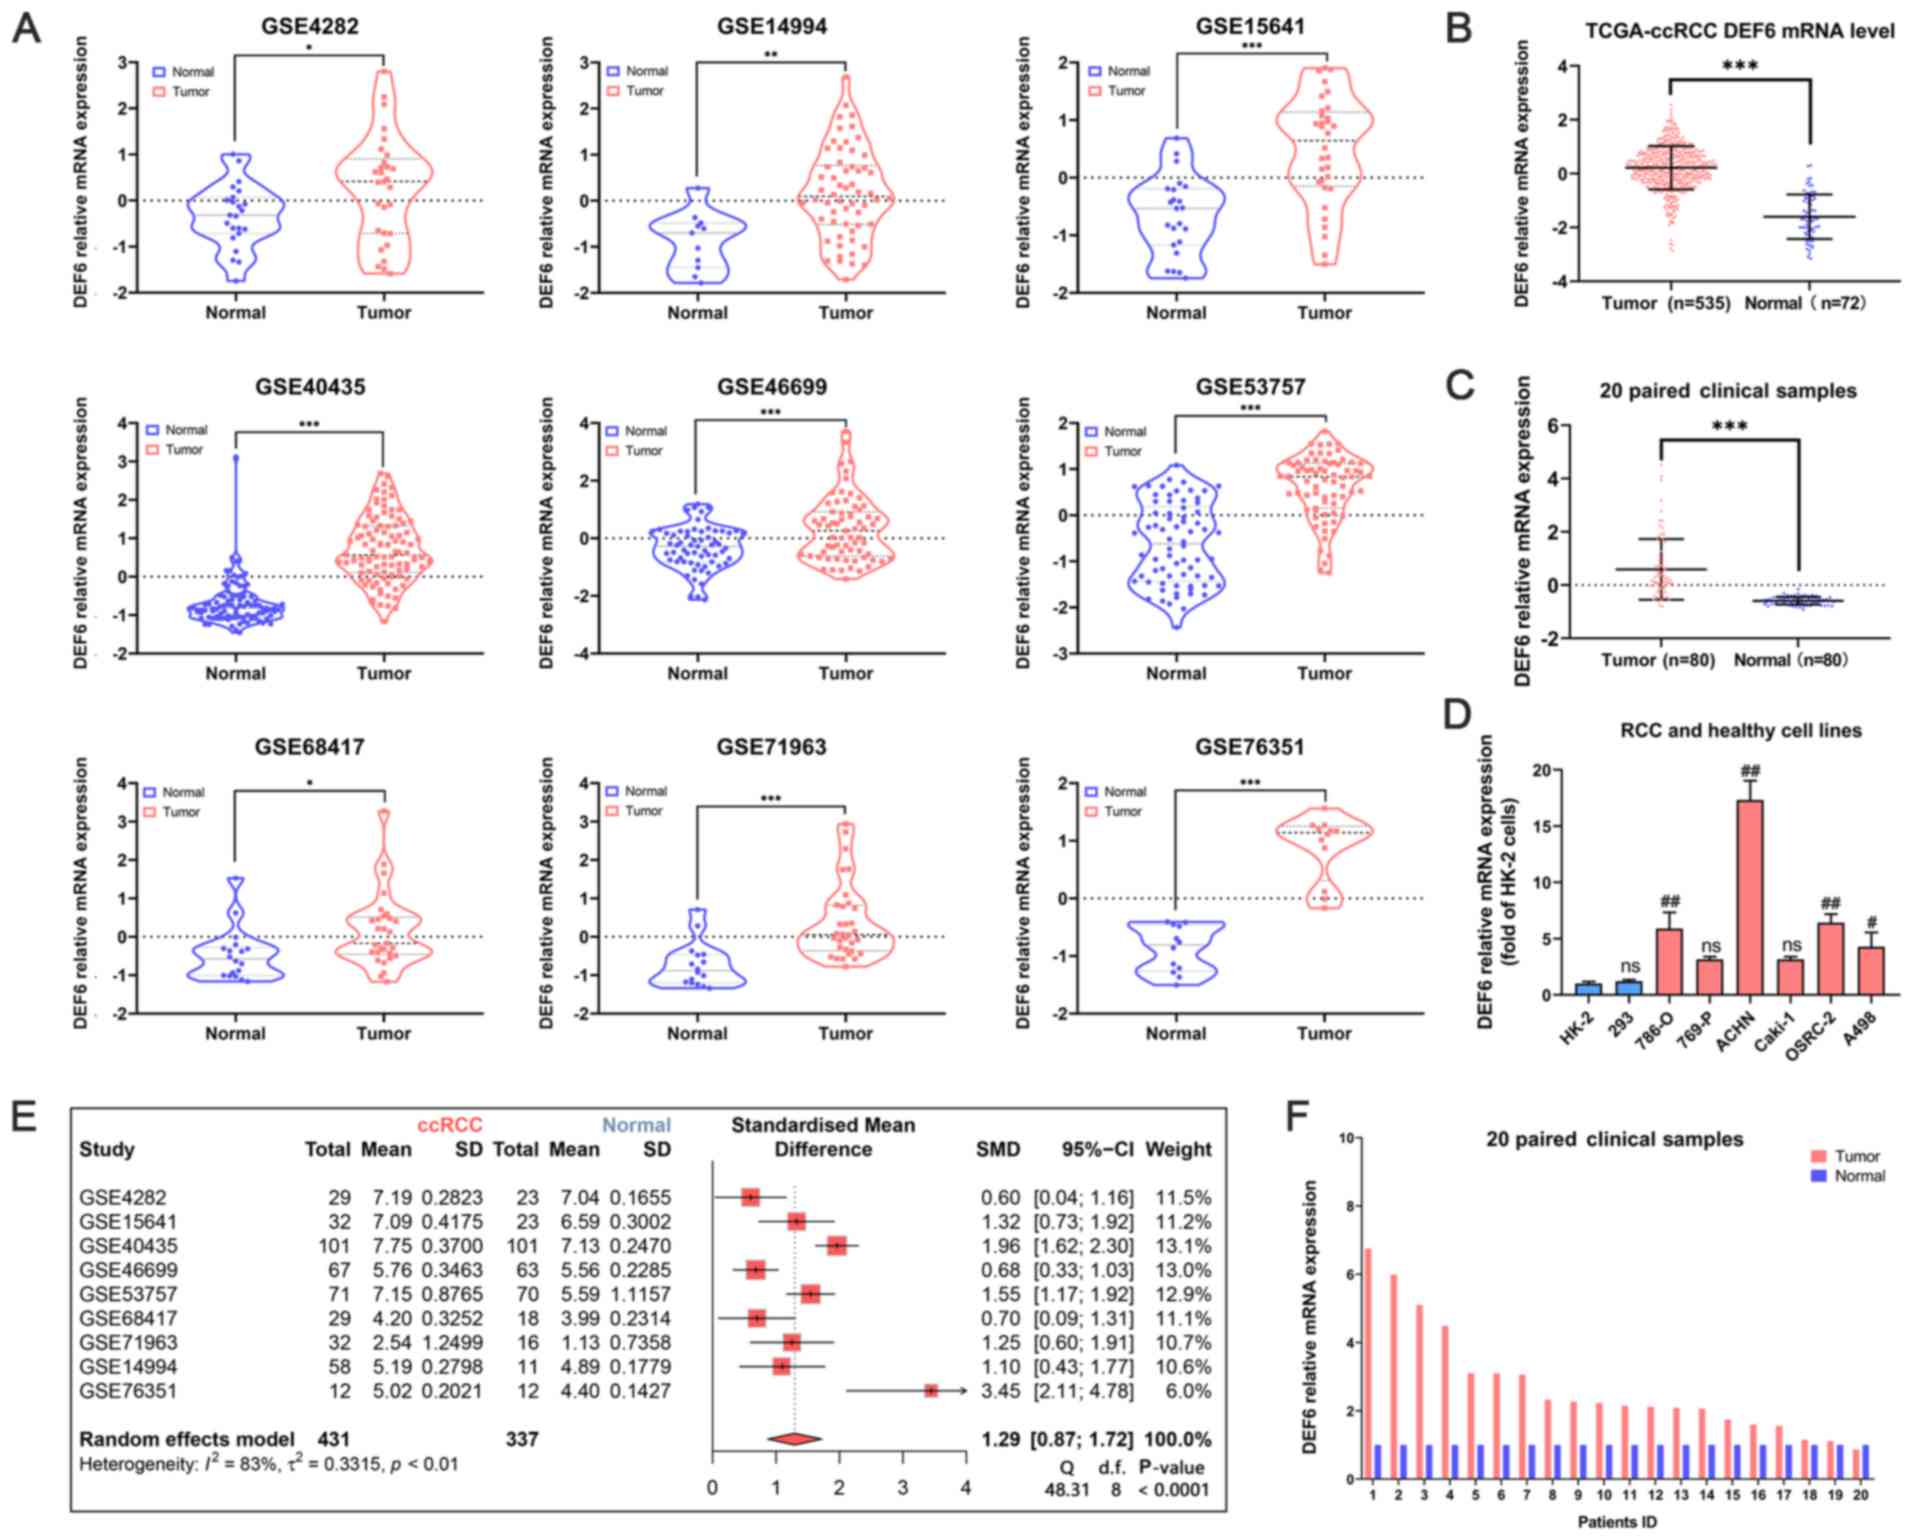 | Figure 1.The DEF6 mRNA expression levels in
ccRCC samples. (A) The mRNA expression levels of DEF6 in ccRCC
tissues and adjacent normal renal tissues was compared. Nine
databases were employed, namely, the GSE4282, GSE14994, GSE15641,
GSE40435, GSE46699, GSE53757, GSE68417, GSE71963 and GSE76351
databases. The colored lines surrounding the data show the
densities at the various expression levels in a violin chart. The
mRNA expression levels of DEF6 in ccRCC tissues and adjacent normal
renal tissues was compared in the (B) TCGA database and (C) 20
paired clinical samples. (D) The mRNA expression levels of DEF6 in
various kidney cell lines was explored. (E) A forest plot of nine
GEO databases was created. (F) The mRNA levels of 20 paired
clinical samples are shown. *P<0.05, **P<0.01, ***P<0.001.
#P<0.01, ##P<0.001 vs. HK-2 cells.
ccRCC, clear cell RCC; CI, confidence interval; DEF6, DEF6 guanine
nucleotide exchange factor; d.f., degrees of freedom; ns, not
significant; RCC, renal cell carcinoma; SMD, standardized mean
difference. |
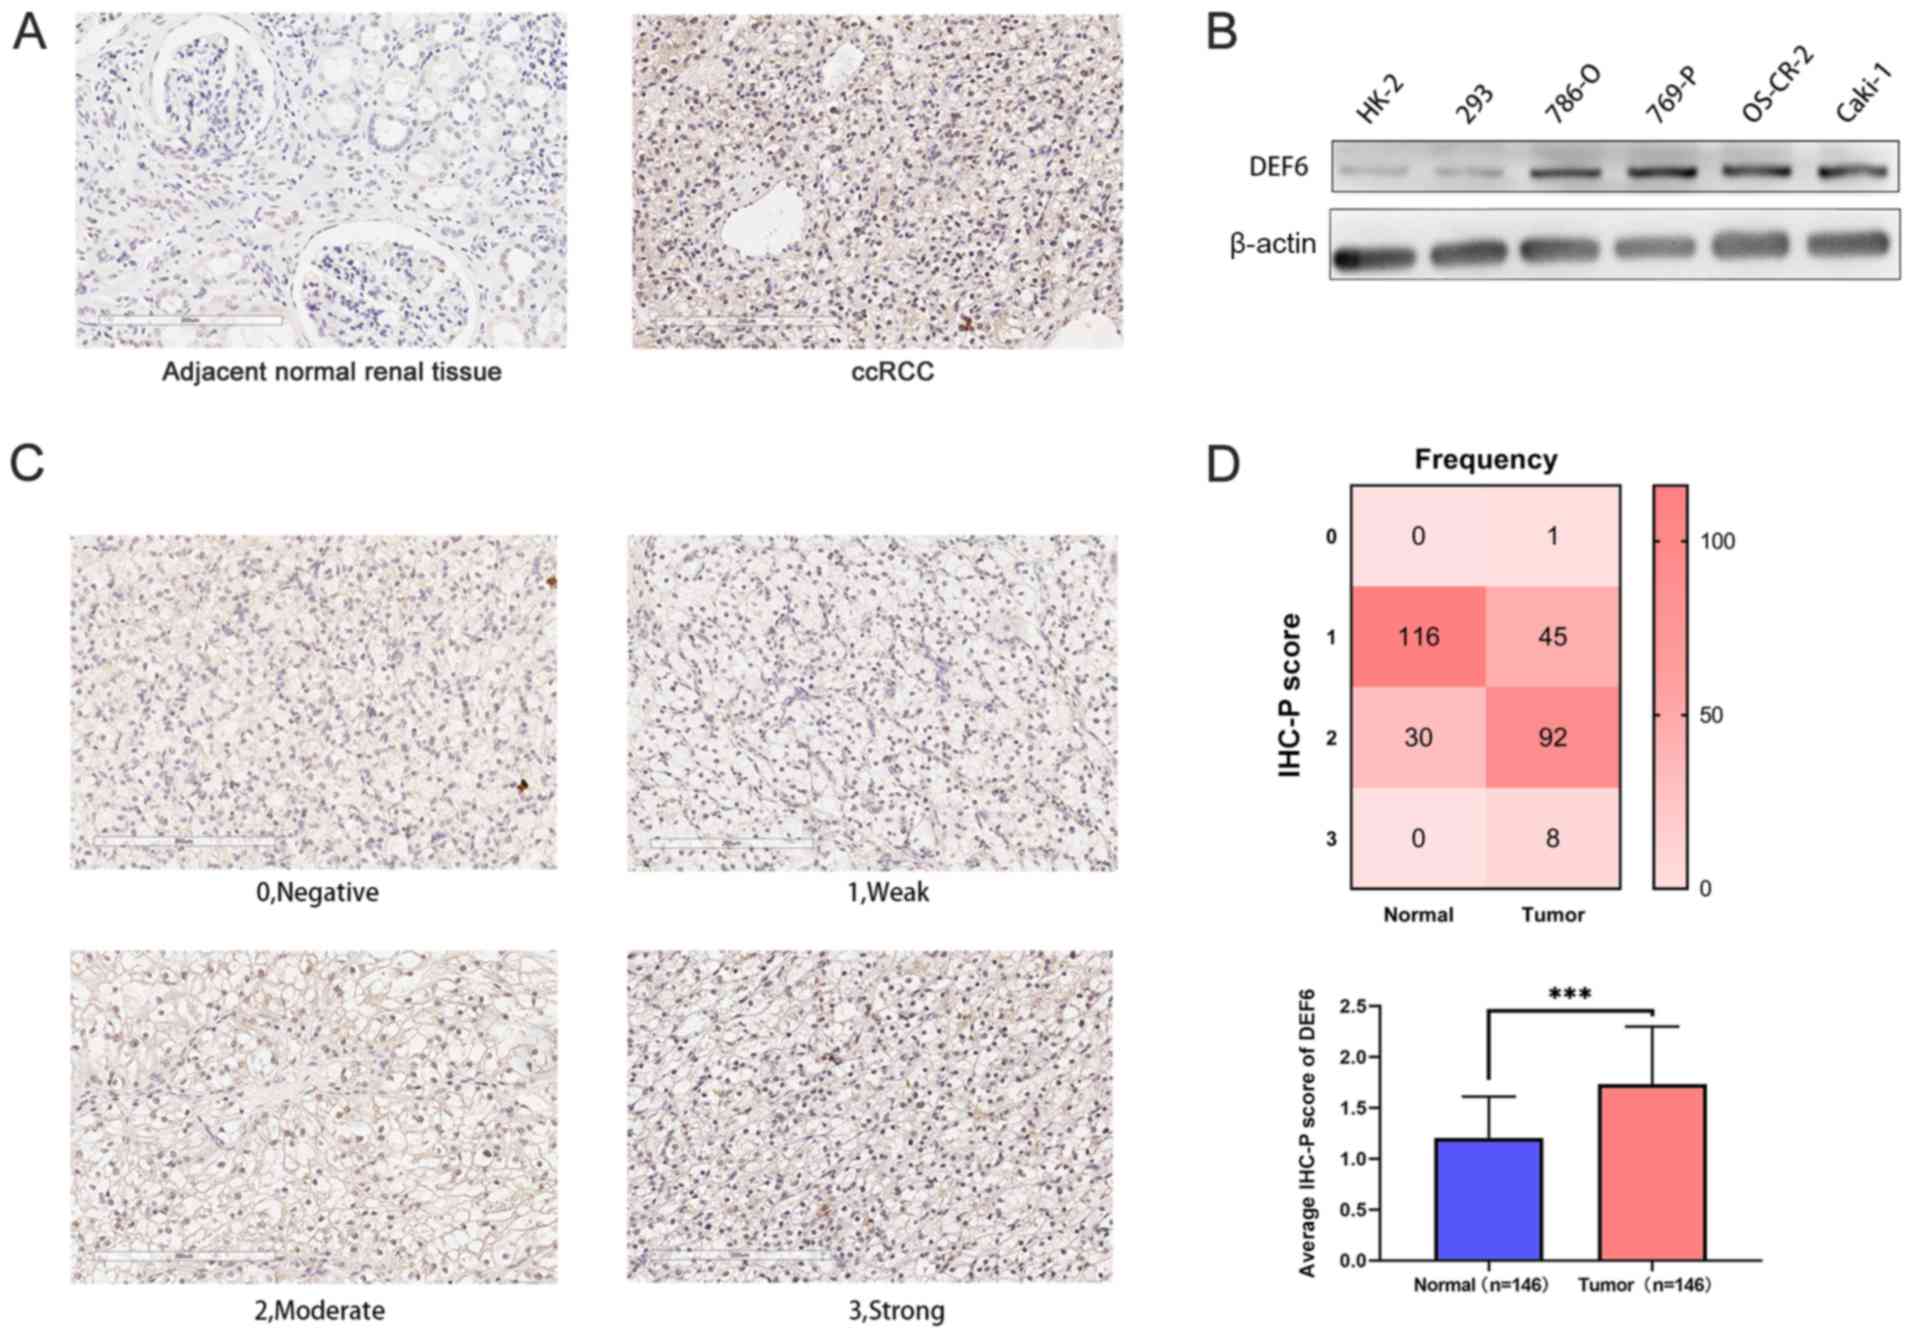
DEF6 protein expression levels are
upregulated in ccRCC
Representative staining of tissues (Fig. 2A) and the representative scores
(Fig. 2C) are shown. A higher DEF6
expression level was observed in the ccRCC tissue according to the
IHC scores of 146 paired ccRCC tissues and corresponding adjacent
normal renal tissues. The mean IHC scores of ccRCC tissues and
adjacent normal renal tissues were 1.73 and 1.20, which showed
significant difference. The frequency distribution of these scores
is demonstrated in Fig. 2D. Western
bolt analysis also showed that the DEF6 protein expression levels
were increased in the ccRCC cell lines compared with the healthy
cell lines (Fig. 2B).
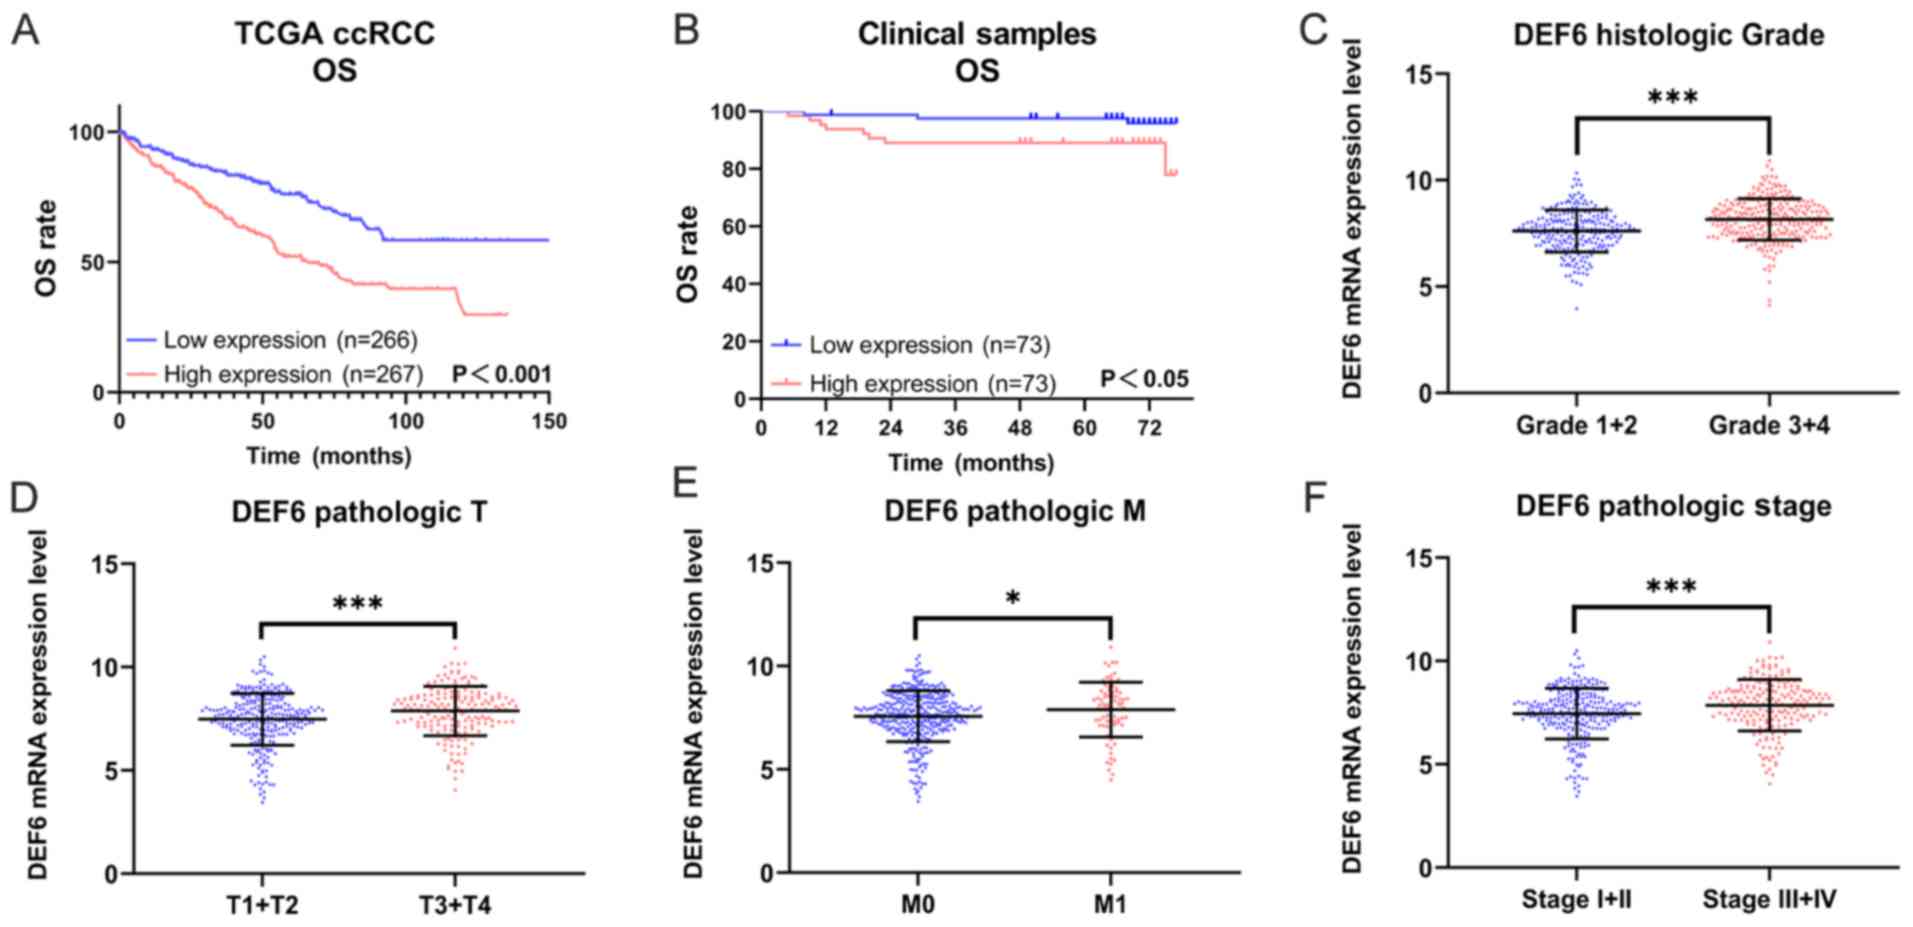
Overexpression of DEF6 is an
unfavorable prognostic factor for patients with ccRCC
To evaluate the prognostic value of DEF6 in ccRCC,
the patient OS in both the TCGA database and the present study's
clinical database were analyzed using the Kaplan-Meier log-rank
test. It was found that high DEF6 expression was correlated with a
poor prognosis for patients with ccRCC in both the TCGA database
and the present database (Fig. 3A and
B). Furthermore, the correlation between DEF6 expression and
clinicopathological characteristics in patients with ccRCC was
explored in the TCGA database. DEF6 expression was significantly
associated with the pathologic grade (Fig. 3C), pathologic T (Fig. 3D), pathologic M (Fig. 3E) and pathologic stage (Fig. 3F).
Whether DEF6 could be an independent prognostic
factor for patients with ccRCC was subsequently explored. Cox
regression analysis was conducted using both the TCGA database and
the present clinical database. Detailed patient information from
both the TCGA database (Table SI)
and the present clinical database (Table SII) is shown. As shown in Table SI, the clinical characteristics
(size, pathologic T, pathologic M and pathologic N) showed a
significant difference between the high- and low-DEF6 expression
groups in the TCGA database. Meanwhile, as shown in Table SII, the clinical characteristics
(size) showed a significant difference between the high- and
low-DEF6 expression groups in the present clinical database.
In the TCGA database, univariate Cox regression
analysis showed that DEF6 expression, age at diagnosis, tumor size,
histologic grade, pathologic T and pathologic M stages were
correlated with the OS of patients with ccRCC (Table I). Moreover, multivariate Cox
regression analysis indicated that DEF6 expression, age at
diagnosis and pathologic M stage were independent prognostic
factors for OS (Table I).
 | Table I.Univariate analysis and multivariate
analysis of overall survival in the TCGA database. |
Table I.
Univariate analysis and multivariate
analysis of overall survival in the TCGA database.
|
| Univariate
analysis | Multivariate
analysis |
|---|
|
|
|
|
|---|
| Parameters | HR (95% CI) | P-value | HR (95% CI) | P-value |
|---|
| DEF6 level, high
vs. low | 2.076 (1.502,
2.869) | <0.001 | 1.856 (1.335,
2.580) | <0.001 |
| Age at initial
pathologic diagnosis, >60 vs. <60 years | 1.734 (1.248,
2.410) | <0.01 | 1.593 (1.142,
2.222) | <0.01 |
| Gender, male vs.
female | 1.077 (0.776,
1.496) | 0.657 |
|
|
| Size, longest
dimension, ≥2 cm vs. <2 cm | 1.526 (1.114,
2.091) | <0.01 |
|
|
| Histologic grade,
G1 + G2 vs. G3 + G4 | 2.332 (1.640,
3.315) | <0.001 |
|
|
| Pathologic T, T3 +
T4 vs. T1 + T2 | 2.739 (2.003,
3.747) | <0.001 |
|
|
| Pathologic N, N1
vs. N0 | 0.983 (0.722,
1.338) | 0.912 |
|
|
| Pathologic M, M1
vs. M0 | 4.289 (3.126,
5.884) | <0.001 | 2.673 (1.819,
3.928) | <0.001 |
Moreover, in the present clinical database, DEF6
expression, tumor size and pathologic T were correlated with the OS
of patients with ccRCC (Table II).
In addition, multivariate Cox regression analysis indicated that
DEF6 expression and pathologic T stage were independent prognostic
factors for OS (Table II).
| Table II.Univariate analysis and multivariate
analysis of overall survival in the clinical database of the
present study. |
Table II.
Univariate analysis and multivariate
analysis of overall survival in the clinical database of the
present study.
|
| Univariate
analysis | Multivariate
analysis |
|---|
|
|
|
|
|---|
| Parameters | HR (95% CI) |
P-value | HR (95% CI) | P-value |
|---|
| DEF6 level, high
vs. low | 7.981
(1.058, 60.211) | <0.05 | 1.856 (1.335,
2.580) | <0.05 |
| Age at initial
pathologic diagnosis, ≥60 vs. <60 years | 1.898 (0.721,
4.966) | 0.194 |
|
|
| Gender, male vs.
female | 1.334 (0.468,
3.801) | 0.590 |
|
|
| Size, longest
dimension, ≥6 cm vs. <6 cm | 6.060
(2.132, 17.219) | <0.01 |
|
|
| BMI, ≥23.9 vs.
<23.9 | 0.844 (0.325,
2.187) | 0.726 |
|
|
| Pathologic T, T3 +
T4 vs. T1 + T2 | 10.859 (3.977,
29.647) | <0.001 | 7.101
(1.965, 25.659) | <0.01 |
| Fuhrman score, 2+3
vs. 1 | 4.898
(0.649, 36.992) | 0.123 |
|
|
Biological analysis of DEF6 in
ccRCC
The analysis contained 539 ccRCC samples in the TCGA
database, 101 ccRCC samples in GSE40435 and 71 ccRCC samples in
GSE53757. A total of 188 overlapping DEGs related to DEF6
expression were identified from 3 datasets, including 180
upregulated genes and 8 downregulated genes (Fig. 4A).
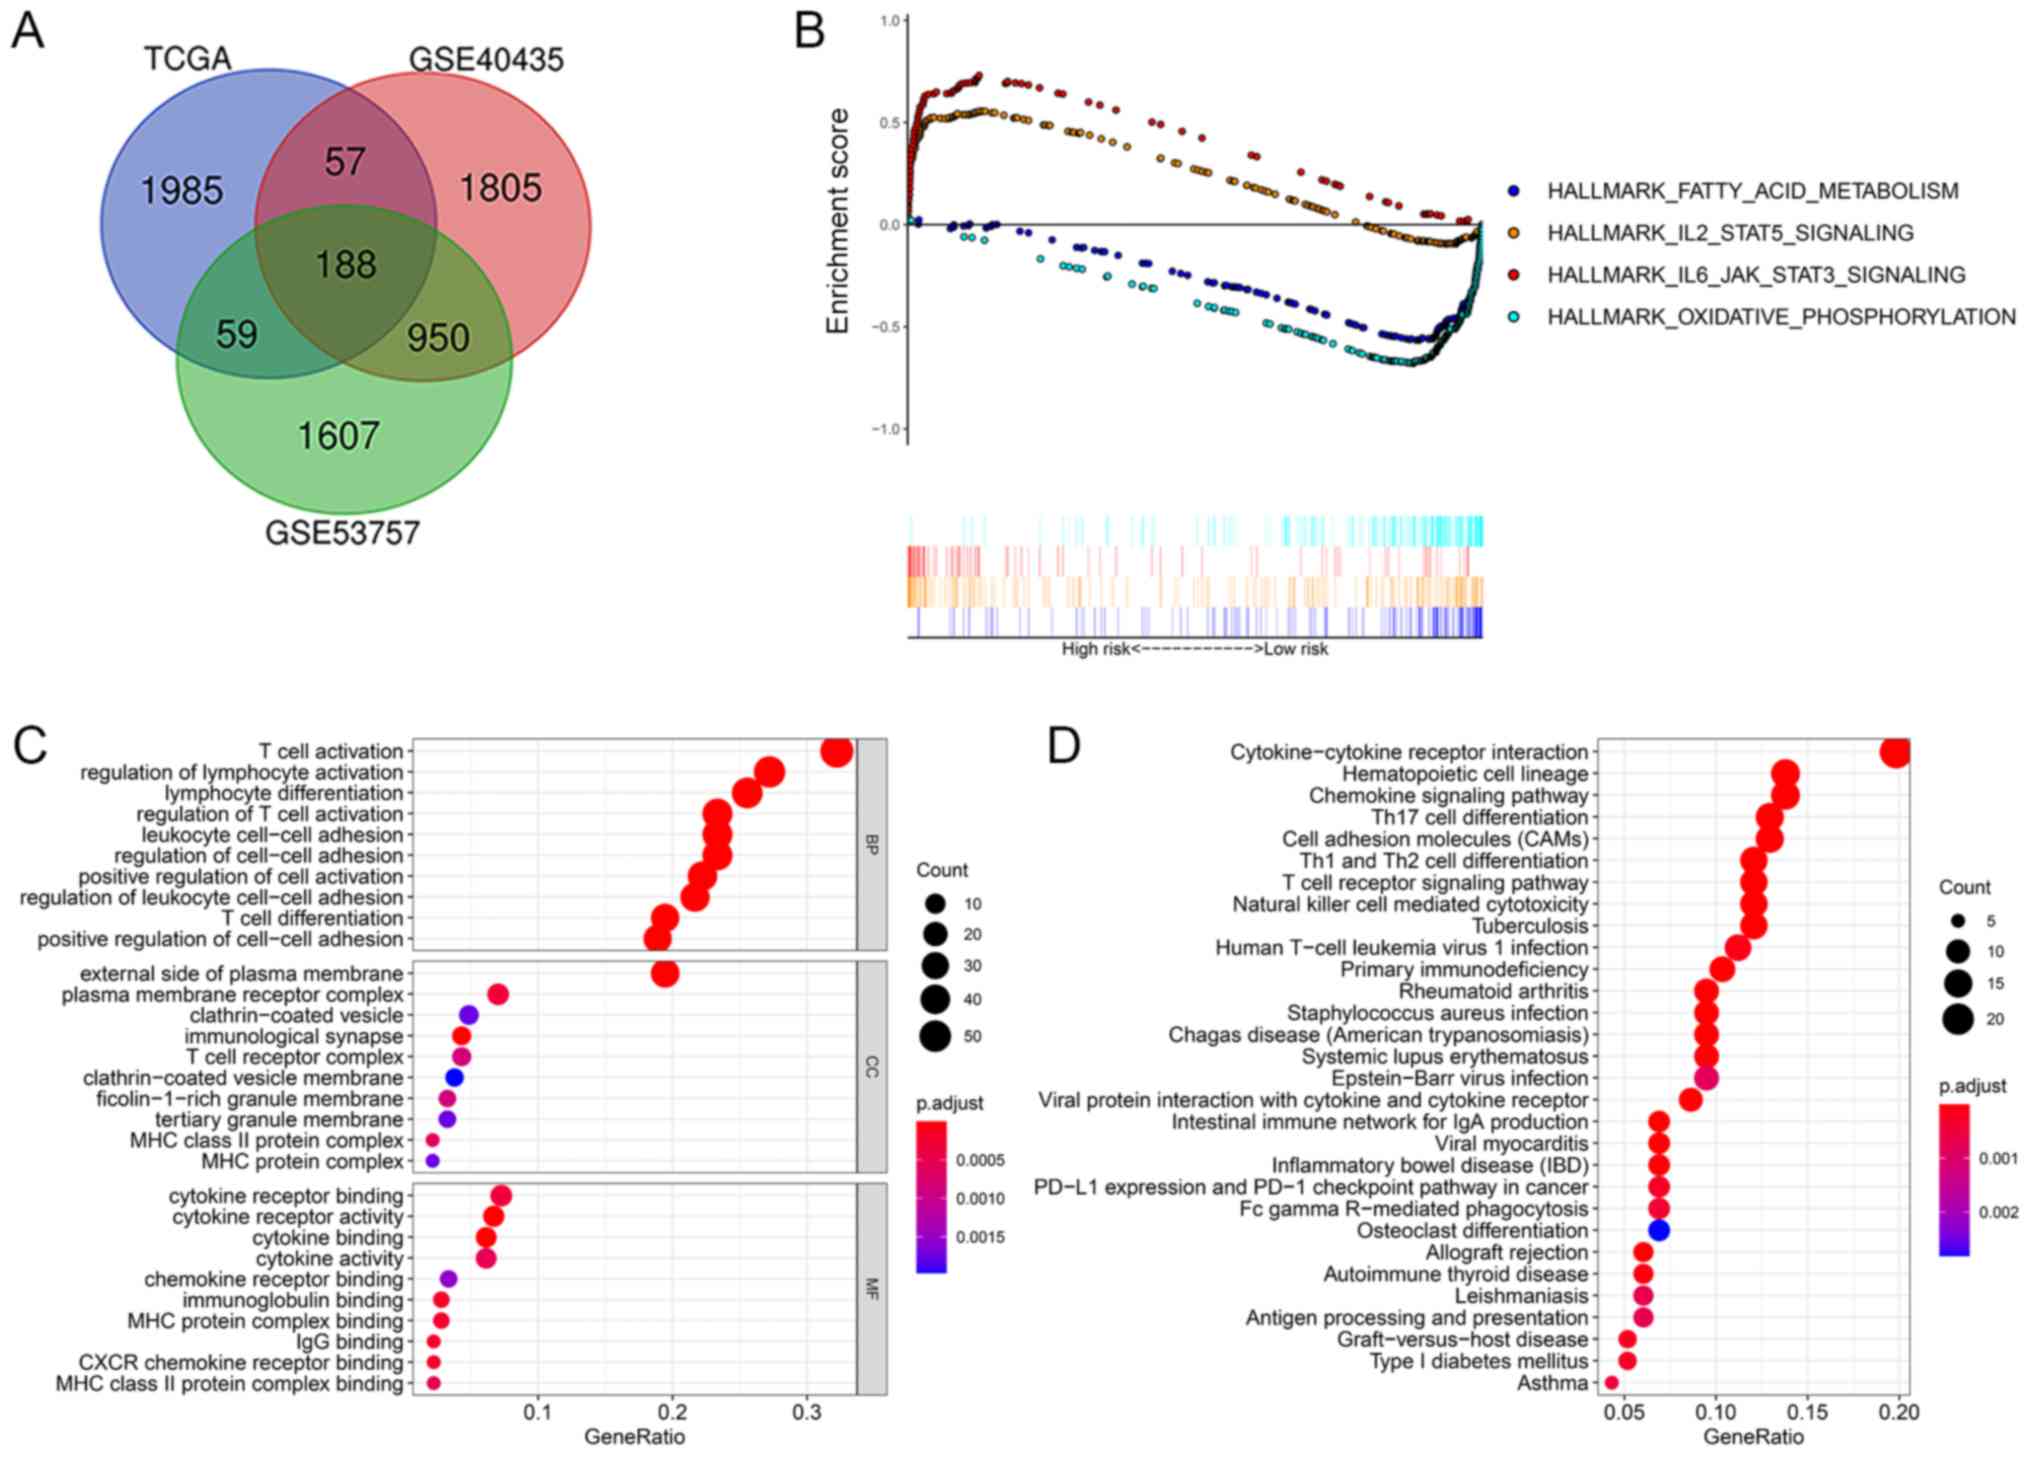 | Figure 4.(A) The 188 overlapping DEGs from
three datasets: TCGA, GSE40435 and GSE53757. (B) Representative
GSEA results showing enrichment of the immune response and tumor
metabolism in ccRCC is shown. The dot plot images of (C) GO and (D)
KEGG were constructed, where larger dot sizes are correlated with
higher counts and a darker red color is related to lower P-value.
CAM, cell adhesion molecule; CXCR, chemokine receptor type 4; DEG,
differentially expressed genes; IBD, inflammatory bowel disorder;
Ig, immunoglobulin; MHC, major histocompatibility complex; PD-1,
programmed cell death 1; PD-L1, programmed cell death ligand 1; Th,
T helper cell. |
Moreover, GO, KEGG and GSEA analyses were conducted
to explore the biological functions of these DEGs. The GO analysis
showed that the DEGs were mainly enriched in the activation and
regulation of the immune microenvironment (Fig. 4C). Moreover, the KEGG pathway
enrichment analysis indicated that the primary functions of the
identified DEGs were the regulation of the immune microenvironment.
Interestingly, programmed cell death ligand 1 expression and
programmed cell death 1 checkpoint pathways in cancer were also
enriched in the KEGG pathway (Fig.
4D). Furthermore, GSEA analysis showed that 7 gene sets were
upregulated and 4 gene sets were downregulated, with significant
enrichment at both the NOM P-value<0.05 and FDR q-value<0.05
(Table III). These gene sets were
mainly correlated with the immune response and tumor metabolism
(Fig. 4B).
| Table III.The enrichment of GSEA gene sets at
both the NOM P-value <0.05 and FDR q-value <0.05. |
Table III.
The enrichment of GSEA gene sets at
both the NOM P-value <0.05 and FDR q-value <0.05.
| GS follow link to
MSigDB | Size | ES | NES | NOM P-value | FDR q-value |
|---|
|
HALLMARK_ALLOGRAFT_REJECTION | 199 | 0.81 | 2.32 | <0.001 | 0.007 |
|
HALLMARK_INTERFERON_GAMMA_RESPONSE | 198 | 0.75 | 2.2 |
0.002 | 0.016 |
|
HALLMARK_INFLAMMATORY_RESPONSE | 198 | 0.7 | 2.15 | <0.001 | 0.017 |
|
HALLMARK_IL6_JAK_STAT3_SIGNALING | 86 | 0.73 | 2.14 | <0.001 | 0.014 |
|
HALLMARK_INTERFERON_ALPHA_RESPONSE | 95 | 0.74 | 2.06 |
0.009 | 0.021 |
|
HALLMARK_IL2_STAT5_SIGNALING | 196 | 0.56 | 2 |
0.004 | 0.032 |
|
HALLMARK_COMPLEMENT | 199 | 0.56 | 1.95 |
0.017 | 0.038 |
|
HALLMARK_FATTY_ACID_METABOLISM | 157 | −0.57 | −2.07 |
0.014 | 0.037 |
|
HALLMARK_OXIDATIVE_PHOSPHORYLATION | 184 | −0.68 | −2.06 |
0.017 | 0.027 |
|
HALLMARK_ADIPOGENESIS | 193 | −0.5 | −1.94 |
0.022 | 0.045 |
|
HALLMARK_ANDROGEN_RESPONSE | 96 | −0.55 | −1.94 | 0.02 | 0.037 |
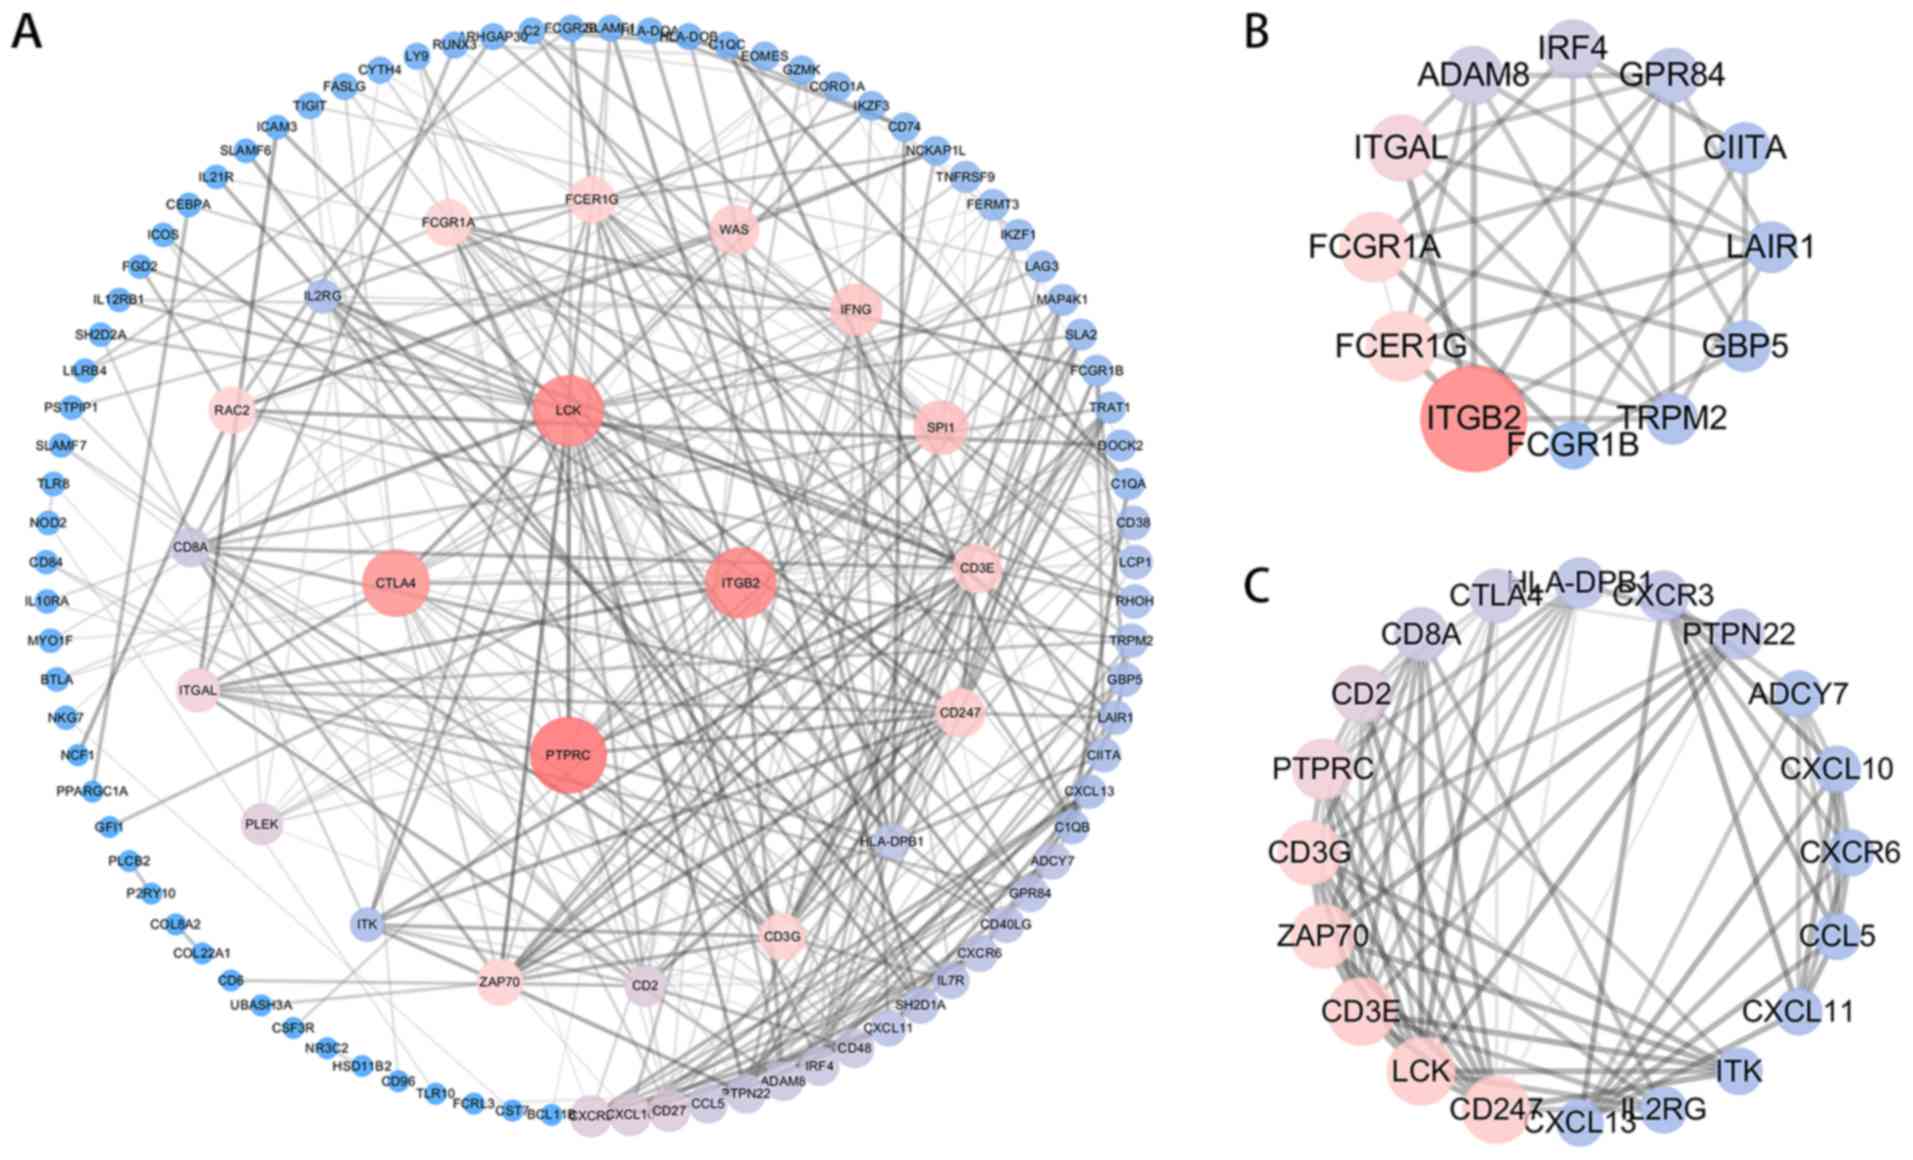
Construction of the PPI network
To identify the hub genes of these DEGs related to
DEF6 expression, a PPI network was constructed using STRING 11.0
(https://string-db.org/), including 108 nodes and
324 edges. Subsequently, Cytoscape (version 3.7.1) was used to
analyze the PPI network, where a low degree value is correlated
with a small node size and a low co-expression value is related to
a small edge size. The co-expression network showed that protein
tyrosine phosphatase receptor type c (PTPRC), integrin subunit beta
2 (ITGB2), lymphocyte-specific protein tyrosine kinase (LCK) and
cytotoxic T-lymphocyte associated protein 4 (CTLA4) were hub genes
with a degree >20 (Fig. 5A). The
MCODE plugin was then used to explore the critical modules of
target genes and two imperative modules were identified with MCODE
score and node number >4 (Fig. 5B
and C). Two imperative modules might act as the core regulatory
network for the biological functions.
Regulation of molecules involved with
the immune microenvironment by DEF6
The aforementioned biological analyses showed that
DEF6 was associated with the immune microenvironment. As such, the
TISIDB database was used to explore the correlations between DEF6
expression and lymphocytes and immunomodulators, using Spearman's
correlation tests. Figs. S1A and
6A showed the correlation between
DEF6 expression and tumor-infiltrating lymphocytes, and the 4 types
of tumor-infiltrating lymphocytes that significant correlated with
DEF6 expression, including myeloid-derived suppressor cells
(MDSCs), activate CD8 T cells (Act_CD8), activate B cells (Act_B)
and effector memory CD8 T cells (Tem_CD8). Moreover, Figs. S1B and 6B showed the correlation between DEF6
expression and immunoinhibitors, and the 4 significant
immunoinhibitors included lymphocyte activating 3 (LAG3),
programmed cell death 1 (PDCD1), T Cell Immunoreceptor With Ig And
ITIM Domains (TIGIT) and CD96. Furthermore, Figs. S1C and 6C showed the correlation between DEF6
expression and immunostimulators, and the 4 significant
immunostimulators included CD27, Lymphotoxin Alpha (LTA), Killer
Cell Lectin Like Receptor K1 (KLRK1) and CD48. Figs. S1D and 6D showed the correlation between DEF6
expression and major histocompatibility complexes (MHC) molecules,
and the 4 significant MHC molecules included 4 major
histocompatibility complexes (HLAs), which are HLA-DOB, HLA-DPB1,
HLA-DMA and HLA-DRA. Hence, DEF6 may influence the immune
microenvironment by regulating the aforementioned immune
molecules.
Discussion
DEF6, also known as IBP or SWAP-70, is a GEF that
regulates various processes associated with the immune
microenvironment. GEFs are members of the diffuse B-cell lymphoma
protein family and play a significant role in regulating the
activation status of Rho-GTPases (34,35).
To the best of our knowledge, Rho-GTPases are associated with
oncogenic activities and contribute to the processes of malignant
tumor phenotypes such as migration, invasion and metastasis
(36–38). Interestingly, as an upstream
activator of the Rho-GTPase family, DEF6 is involved in various
cellular processes, such as the cell polarity, microtubule
dynamics, membrane transport pathways and transcription factor
activity (39–41). Previous studies have demonstrated
that overexpression of DEF6 contributes to a poor prognosis in
various cancer types, such as ovarian carcinoma and prostate cancer
(42,43). However, the correlation between DEF6
expression and the prognosis in ccRCC is unclear.
A previous study showed the potential functions of
DEF6 in regulating kidney podocytes (44). This study was the first to reveal
the correlation between DEF6 expression and the prognosis in ccRCC.
In the present study, both DEF6 mRNA and protein expression levels
were explored in ccRCC. Compared with the adjacent normal tissue,
the DEF6 mRNA expression level was upregulated in the TCGA
database, GEO database and the present clinical samples. Moreover,
146 paired ccRCC tissues and their adjacent normal tissues were
analyzed using IHC. Raised DEF6 expression levels were found in
ccRCC. Univariate and multivariate Cox regression suggested that
high DEF6 expression was significantly related to a poor prognosis
for patients with ccRCC, which indicated that DEF6 may be an
independent prognostic factor for ccRCC.
According to the DEF6 expression levels, the ccRCC
samples were divided into the high expression group and low
expression group. Subsequently, ‘DESeq2’ and ‘edgeR’ were used to
analyze the transcription profile from the TCGA and GEO databases.
A total of 188 DEGs were found for subsequent analysis, including
180 upregulated genes and 8 downregulated genes. The biological
functions of these DEGs were explored using GO, KEGG and GSEA
enrichment analyses.
The enrichment of biological processes indicated
that DEF6 mainly regulated immune microenvironment molecules by
influencing their activation, difference and adhesion. In addition,
cell components showed that DEGs were enriched in various membranes
such as the external side of plasma membrane and ficolin-1-rich
granule membrane. These DEGs were also enriched in the composition
of various complexes such as the MHC II complex and reporter
complex, which suggested that DEF6 may influence the transmission
of biological information. Moreover, molecular function analysis
showed that DEF6 chiefly regulates cytokines and bind with various
structures, such as immunoglobulins and the MHC II protein complex.
Moreover, KEGG pathway analysis also indicated that DEF6
participates in various processes of the immune microenvironment.
Interestingly DEF6 mainly influenced the functions of immune
molecules, such as Th17 cell differentiation and natural killer
cell mediated cytotoxicity, which indicated that DEF6 may regulate
the development of ccRCC by influencing the immune
microenvironment. In addition, GSEA analysis found 7 upregulated
gene sets and 4 downregulated gene sets. Enrichment analyses of
these gene sets showed that DEF6 was mainly involved in the immune
response and tumor metabolism. Immune response-related signaling
pathways, such as the interleukin (IL)2/STAT5 pathway and IL6/JAK/
STAT3 pathway, were upregulated. In addition, tumor
metabolism-related signaling pathways, such as fatty acid
metabolism and oxidative phosphorylation, were downregulated.
To explore the hub genes among DEGs, a PPI network
was constructed and found 4 hub genes: PTPRC, ITGB2, LCK and CTLA4.
The detailed information of the 4 hub genes was described as
follows: PTPRC belongs to a member of the protein tyrosine
phosphatase (PTP) family. PTPs are signaling molecules that
regulate a variety of cellular processes, including cell growth,
differentiation, mitosis and oncogenic transformation (45). PTPRC is an essential regulator of T
cell and B cell antigen receptor signaling, which also suppresses
JAK kinases (46). Moreover, ITGB2
is a crucial regulator of lymphocyte trafficking, activation and
residence time (47). LCK is a
member of the Src family and regulates the activation of T cells
(48). Recent studies have shown
that LCK is expressed in various tumor types, such as breast
cancer, colon cancer and lung carcinoma (49–51).
In addition, CLTA-4 is a member of the immunoglobulin superfamily
and mediates opposing functions in T cell activation. These
functions contribute to tumur development (52). A total of 4 hub genes were found to
be involved in regulating the immune microenvironment. In addition,
ITGB2 and CLTA-4 were also associated with various tumur
processes.
The analyses performed in the present study showed
that DEF6 is associated with the immune microenvironment. To the
best of our knowledge, RCC has a high level of immune infiltration
and T cells are the main immune cell type enriched in ccRCC
(53,54). As such, the TISIDB database was used
to explore the correlation DEF6 expression with lymphocytes and
immunomodulators. The results showed that DEF6 had the most
significant correlation with lymphocytes (such as MDSCs, Act_CD8,
Act_B and Tem_CD8), immunoinhibitors [such as LAG3, PDCD1, TIGIT
and CD96], immunostimulators (such as CD27, LTA, KLRK1 and CD48),
and MHC molecules (such as HLA-DOB, HLA-DPB1, HLA-DMA and HLA-DRA).
CD8+ T cells have been shown to be associated with
improved clinical outcomes and responses to immunotherapy (55). Moreover, TIGIT and CD96 are
correlated with anti-tumor immunity (56). Combined with the outcome of the GSEA
and KEGG analyses, TISIDB indicated that patients with ccRCC with
high DEF6 expression may benefit more from immunotherapy.
There are several limitations to this study.
Firstly, the biological functions of DEF6 in ccRCC cancer cell
lines need to be verified in vitro. Moreover, the specific
mechanisms of action by which DEF6 influences ccRCC remain unclear
and require further study. In conclusion, the present study
demonstrated for the first time that both DEF6 mRNA and protein
levels were upregulated in ccRCC. Overexpression of DEF6 is an
unfavorable prognostic factor for patients with ccRCC. In addition,
the mechanism of action by which DEF6 regulates ccRCC may be
associated with the immune microenvironment.
Supplementary Material
Supporting Data
Supporting Data
Acknowledgements
Sincere thanks is given for the experimental
guidance from Dr Anbang He, Dr Cong Huang and Dr Guangjie Ji. Dr
Anbang He and Dr Guangjie Ji gave us guidance on bioinformatics
analyses. Moreover, Dr Cong Huang gave us guidance on cell culture
and laboratory techniques.
Funding
This study was supported by the National Natural
Science Foundation of China (grant no. 81670617).
Availability of data and materials
The datasets used and/or analyzed during the current
study are available from the corresponding authors on reasonable
request.
Authors' contributions
JL and ZPZ designed the study. JL obtained the
financial support for this study. ZPZ collected the sequencing data
from public datasets and analyzed the data. LRL, TYC and CRX
collected the clinical samples and performed IHC staining, western
blot experiments as well as RT-qPCR. ZPZ and TYC drafted and
revised the manuscript. ZPZ and TDL performed bioinformatics
analyses for this study. All authors have read and approved the
final manuscript.
Ethics approval and consent to
participate
For the use of the clinical materials for research
purposes, the study was conducted following the Declaration of
Helsinki. This study was conducted with the approval of the Peking
University First Hospital Ethical Committee and informed consent
was obtained from all participants.
Patient consent for publication
Not applicable.
Competing interests
The authors declare that they have no competing
interests.
Glossary
Abbreviations
Abbreviations:
|
ccRCC
|
clear cell renal cell carcinoma
|
|
DEGs
|
differentially expressed genes
|
|
GEF
|
guanine nucleotide exchange factor
|
|
GEO
|
Gene Expression Omnibus
|
|
GO
|
gene ontology
|
|
GSEA
|
gene set enrichment analysis
|
|
KEGG
|
Kyoto encyclopedia of genes and
genomes
|
|
OS
|
overall survival
|
|
PPI
|
protein-protein interaction
|
|
RCC
|
renal cell carcinoma
|
|
TCGA
|
the Cancer Genome Atlas
|
References
|
1
|
Siegel RL, Miller KD and Jemal A: Cancer
statistics, 2020. CA Cancer J Clin. 70:7–30. 2020. View Article : Google Scholar : PubMed/NCBI
|
|
2
|
Nicholson HE, Tariq Z, Housden BE,
Jennings RB, Stransky LA, Perrimon N, Signoretti S and Kaelin WG
Jr: HIF-independent synthetic lethality between CDK4/6 inhibition
and VHL loss across species. Sci Signal. 12:122019. View Article : Google Scholar
|
|
3
|
Li QK, Pavlovich CP, Zhang H, Kinsinger CR
and Chan DW: Challenges and opportunities in the proteomic
characterization of clear cell renal cell carcinoma (ccRCC): A
critical step towards the personalized care of renal cancers. Semin
Cancer Biol. 55:8–15. 2019. View Article : Google Scholar : PubMed/NCBI
|
|
4
|
Cancer Genome Atlas Research Network, .
Comprehensive molecular characterization of clear cell renal cell
carcinoma. Nature. 499:43–49. 2013. View Article : Google Scholar : PubMed/NCBI
|
|
5
|
Sato Y, Yoshizato T, Shiraishi Y, Maekawa
S, Okuno Y, Kamura T, Shimamura T, Sato-Otsubo A, Nagae G, Suzuki
H, et al: Integrated molecular analysis of clear-cell renal cell
carcinoma. Nat Genet. 45:860–867. 2013. View Article : Google Scholar : PubMed/NCBI
|
|
6
|
Oliver GR, Hart SN and Klee EW:
Bioinformatics for clinical next generation sequencing. Clin Chem.
61:124–135. 2015. View Article : Google Scholar : PubMed/NCBI
|
|
7
|
Xuan J, Yu Y, Qing T, Guo L and Shi L:
Next-generation sequencing in the clinic: Promises and challenges.
Cancer Lett. 340:284–295. 2013. View Article : Google Scholar : PubMed/NCBI
|
|
8
|
Majer W, Kluzek K, Bluyssen H and Wesoły
J: Potential Approaches and Recent Advances in Biomarker Discovery
in Clear-Cell Renal Cell Carcinoma. J Cancer. 6:1105–1113. 2015.
View Article : Google Scholar : PubMed/NCBI
|
|
9
|
Yoshihara K, Shahmoradgoli M, Martínez E,
Vegesna R, Kim H, Torres-Garcia W, Treviño V, Shen H, Laird PW,
Levine DA, et al: Inferring tumour purity and stromal and immune
cell admixture from expression data. Nat Commun. 4:26122013.
View Article : Google Scholar : PubMed/NCBI
|
|
10
|
Atkins MB, Regan M and McDermott D: Update
on the role of interleukin 2 and other cytokines in the treatment
of patients with stage IV renal carcinoma. Clin Cancer Res.
10:6342S–6346S. 2004. View Article : Google Scholar : PubMed/NCBI
|
|
11
|
Escudier B: Emerging immunotherapies for
renal cell carcinoma. Ann Oncol. 23 (Suppl 8):viii35–viii40. 2012.
View Article : Google Scholar : PubMed/NCBI
|
|
12
|
Şenbabaoğlu Y, Gejman RS, Winer AG, Liu M,
Van Allen EM, de Velasco G, Miao D, Ostrovnaya I, Drill E, Luna A,
et al: Tumor immune microenvironment characterization in clear cell
renal cell carcinoma identifies prognostic and
immunotherapeutically relevant messenger RNA signatures. Genome
Biol. 17:2312016. View Article : Google Scholar : PubMed/NCBI
|
|
13
|
Gupta S, Lee A, Hu C, Fanzo J, Goldberg I,
Cattoretti G and Pernis AB: Molecular cloning of IBP, a SWAP-70
homologous GEF, which is highly expressed in the immune system. Hum
Immunol. 64:389–401. 2003. View Article : Google Scholar : PubMed/NCBI
|
|
14
|
Mavrakis KJ, McKinlay KJ, Jones P and
Sablitzky F: DEF6, a novel PH-DH-like domain protein, is an
upstream activator of the Rho GTPases Rac1, Cdc42, and RhoA. Exp
Cell Res. 294:335–344. 2004. View Article : Google Scholar : PubMed/NCBI
|
|
15
|
Tanaka Y, Bi K, Kitamura R, Hong S, Altman
Y, Matsumoto A, Tabata H, Lebedeva S, Bushway PJ and Altman A:
SWAP-70-like adapter of T cells, an adapter protein that regulates
early TCR-initiated signaling in Th2 lineage cells. Immunity.
18:403–414. 2003. View Article : Google Scholar : PubMed/NCBI
|
|
16
|
Canonigo-Balancio AJ, Fos C, Prod'homme T,
Bécart S and Altman A: SLAT/Def6 plays a critical role in the
development of Th17 cell-mediated experimental autoimmune
encephalomyelitis. J Immunol. 183:7259–7267. 2009. View Article : Google Scholar : PubMed/NCBI
|
|
17
|
Oka T, Ihara S and Fukui Y: Cooperation of
DEF6 with activated Rac in regulating cell morphology. J Biol Chem.
282:2011–2018. 2007. View Article : Google Scholar : PubMed/NCBI
|
|
18
|
Samson T, Will C, Knoblauch A, Sharek L,
von der Mark K, Burridge K and Wixler V: Def-6, a guanine
nucleotide exchange factor for Rac1, interacts with the skeletal
muscle integrin chain alpha7A and influences myoblast
differentiation. J Biol Chem. 282:15730–15742. 2007. View Article : Google Scholar : PubMed/NCBI
|
|
19
|
Lazer G and Katzav S: Guanine nucleotide
exchange factors for RhoGTPases: Good therapeutic targets for
cancer therapy? Cell Signal. 23:969–979. 2011. View Article : Google Scholar : PubMed/NCBI
|
|
20
|
Chen S, Han Q, Wang X, Yang M, Zhang Z, Li
P, Chen A, Hu C and Li S: IBP-mediated suppression of autophagy
promotes growth and metastasis of breast cancer cells via
activating mTORC2/Akt/FOXO3a signaling pathway. Cell Death Dis.
4:e8422013. View Article : Google Scholar : PubMed/NCBI
|
|
21
|
Xu Y, Hou Y, Liu T and Lou G:
Overexpression and clinical significance of IBP in epithelial
ovarian carcinoma. Oncol Lett. 15:6604–6610. 2018.PubMed/NCBI
|
|
22
|
Zhang Z, Wang Q, Li P, Zhou Y, Li S, Yi W,
Chen A, Kong P and Hu C: Overexpression of the Interferon
regulatory factor 4-binding protein in human colorectal cancer and
its clinical significance. Cancer Epidemiol. 33:130–136. 2009.
View Article : Google Scholar : PubMed/NCBI
|
|
23
|
Otsubo T, Hida Y, Ohga N, Sato H, Kai T,
Matsuki Y, Takasu H, Akiyama K, Maishi N, Kawamoto T, et al:
Identification of novel targets for antiangiogenic therapy by
comparing the gene expressions of tumor and normal endothelial
cells. Cancer Sci. 105:560–567. 2014. View Article : Google Scholar : PubMed/NCBI
|
|
24
|
Liao Y, Yin G, Wang X, Zhong P, Fan X and
Huang C: Identification of candidate genes associated with the
pathogenesis of small cell lung cancer via integrated
bioinformatics analysis. Oncol Lett. 18:3723–3733. 2019.PubMed/NCBI
|
|
25
|
Leek JT, Johnson WE, Parker HS, Jaffe AE
and Storey JD: The sva package for removing batch effects and other
unwanted variation in high-throughput experiments. Bioinformatics.
28:882–883. 2012. View Article : Google Scholar : PubMed/NCBI
|
|
26
|
Zhu Z, He A, Lv T, Xu C, Lin L and Lin J:
Overexpression of P4HB is correlated with poor prognosis in human
clear cell renal cell carcinoma. Cancer Biomark. 26:431–439. 2019.
View Article : Google Scholar : PubMed/NCBI
|
|
27
|
Livak KJ and Schmittgen TD: Analysis of
relative gene expression data using real-time quantitative PCR and
the 2(-Delta Delta C(T)) Method. Methods. 25:402–408. 2001.
View Article : Google Scholar : PubMed/NCBI
|
|
28
|
Martinez-Millana A, Hulst JM, Boon M,
Witters P, Fernandez-Llatas C, Asseiceira I, Calvo-Lerma J,
Basagoiti I, Traver V, De Boeck K, et al: Optimisation of children
z-score calculation based on new statistical techniques. PLoS One.
13:e02083622018. View Article : Google Scholar : PubMed/NCBI
|
|
29
|
Lv W, Yu X, Li W, Feng N, Feng T, Wang Y,
Lin H and Qian B: Low expression of LINC00982 and PRDM16 is
associated with altered gene expression, damaged pathways and poor
survival in lung adenocarcinoma. Oncol Rep. 40:2698–2709.
2018.PubMed/NCBI
|
|
30
|
Shannon P, Markiel A, Ozier O, Baliga NS,
Wang JT, Ramage D, Amin N, Schwikowski B and Ideker T: Cytoscape: A
software environment for integrated models of biomolecular
interaction networks. Genome Res. 13:2498–2504. 2003. View Article : Google Scholar : PubMed/NCBI
|
|
31
|
Yu G, Wang LG, Han Y and He QY:
clusterProfiler: An R package for comparing biological themes among
gene clusters. OMICS. 16:284–287. 2012. View Article : Google Scholar : PubMed/NCBI
|
|
32
|
Subramanian A, Tamayo P, Mootha VK,
Mukherjee S, Ebert BL, Gillette MA, Paulovich A, Pomeroy SL, Golub
TR, Lander ES, et al: Gene set enrichment analysis: A
knowledge-based approach for interpreting genome-wide expression
profiles. Proc Natl Acad Sci USA. 102:15545–15550. 2005. View Article : Google Scholar : PubMed/NCBI
|
|
33
|
Ru B, Wong CN, Tong Y, Zhong JY, Zhong
SSW, Wu WC, Chu KC, Wong CY, Lau CY, Chen I, et al: TISIDB: An
integrated repository portal for tumor-immune system interactions.
Bioinformatics. 35:4200–4202. 2019. View Article : Google Scholar : PubMed/NCBI
|
|
34
|
Zheng Y: Dbl family guanine nucleotide
exchange factors. Trends Biochem Sci. 26:724–732. 2001. View Article : Google Scholar : PubMed/NCBI
|
|
35
|
Cook DR, Rossman KL and Der CJ: Rho
guanine nucleotide exchange factors: Regulators of Rho GTPase
activity in development and disease. Oncogene. 33:4021–4035. 2014.
View Article : Google Scholar : PubMed/NCBI
|
|
36
|
Vega FM and Ridley AJ: Rho GTPases in
cancer cell biology. FEBS Lett. 582:2093–2101. 2008. View Article : Google Scholar : PubMed/NCBI
|
|
37
|
Jansen S, Gosens R, Wieland T and Schmidt
M: Paving the Rho in cancer metastasis: Rho GTPases and beyond.
Pharmacol Ther. 183:1–21. 2018. View Article : Google Scholar : PubMed/NCBI
|
|
38
|
Li H, Peyrollier K, Kilic G and Brakebusch
C: Rho GTPases and cancer. Biofactors. 40:226–235. 2014. View Article : Google Scholar : PubMed/NCBI
|
|
39
|
Etienne-Manneville S and Hall A: Rho
GTPases in cell biology. Nature. 420:629–635. 2002. View Article : Google Scholar : PubMed/NCBI
|
|
40
|
Hall A: Rho family GTPases. Biochem Soc
Trans. 40:1378–1382. 2012. View Article : Google Scholar : PubMed/NCBI
|
|
41
|
Jaffe AB and Hall A: Rho GTPases:
Biochemistry and biology. Annu Rev Cell Dev Biol. 21:247–269. 2005.
View Article : Google Scholar : PubMed/NCBI
|
|
42
|
Chiyomaru T, Tatarano S, Kawakami K,
Enokida H, Yoshino H, Nohata N, Fuse M, Seki N and Nakagawa M:
SWAP70, actin-binding protein, function as an oncogene targeting
tumor-suppressive miR-145 in prostate cancer. Prostate.
71:1559–1567. 2011. View Article : Google Scholar : PubMed/NCBI
|
|
43
|
Liew PL, Fang CY, Lee YC, Lee YC, Chen CL
and Chu JS: DEF6 expression in ovarian carcinoma correlates with
poor patient survival. Diagn Pathol. 11:682016. View Article : Google Scholar : PubMed/NCBI
|
|
44
|
Worthmann K, Leitges M, Teng B, Sestu M,
Tossidou I, Samson T, Haller H, Huber TB and Schiffer M: Def-6, a
novel regulator of small GTPases in podocytes, acts downstream of
atypical protein kinase C (aPKC) λ/ι. Am J Pathol. 183:1945–1959.
2013. View Article : Google Scholar : PubMed/NCBI
|
|
45
|
Lazo JS, McQueeney KE, Burnett JC, Wipf P
and Sharlow ER: Small molecule targeting of PTPs in cancer. Int J
Biochem Cell Biol. 96:171–181. 2018. View Article : Google Scholar : PubMed/NCBI
|
|
46
|
Porcu M, Kleppe M, Gianfelici V, Geerdens
E, De Keersmaecker K, Tartaglia M, Foà R, Soulier J, Cauwelier B,
Uyttebroeck A, et al: Mutation of the receptor tyrosine phosphatase
PTPRC (CD45) in T-cell acute lymphoblastic leukemia. Blood.
119:4476–4479. 2012. View Article : Google Scholar : PubMed/NCBI
|
|
47
|
Reichardt P, Patzak I, Jones K, Etemire E,
Gunzer M and Hogg N: A role for LFA-1 in delaying T-lymphocyte
egress from lymph nodes. EMBO J. 32:829–843. 2013. View Article : Google Scholar : PubMed/NCBI
|
|
48
|
Stirnweiss A, Hartig R, Gieseler S,
Lindquist JA, Reichardt P, Philipsen L, Simeoni L, Poltorak M,
Merten C, Zuschratter W, et al: T cell activation results in
conformational changes in the Src family kinase Lck to induce its
activation. Sci Signal. 6:ra132013. View Article : Google Scholar : PubMed/NCBI
|
|
49
|
Clarke CN, Lee MS, Wei W, Manyam G, Jiang
ZQ, Lu Y, Morris J, Broom B, Menter D, Vilar-Sanchez E, et al:
Proteomic Features of Colorectal Cancer Identify Tumor Subtypes
Independent of Oncogenic Mutations and Independently Predict
Relapse-Free Survival. Ann Surg Oncol. 24:4051–4058. 2017.
View Article : Google Scholar : PubMed/NCBI
|
|
50
|
Chakraborty G, Rangaswami H, Jain S and
Kundu GC: Hypoxia regulates cross-talk between Syk and Lck leading
to breast cancer progression and angiogenesis. J Biol Chem.
281:11322–11331. 2006. View Article : Google Scholar : PubMed/NCBI
|
|
51
|
Mahabeleshwar GH and Kundu GC: Tyrosine
kinase p56lck regulates cell motility and nuclear factor
kappaB-mediated secretion of urokinase type plasminogen activator
through tyrosine phosphorylation of IkappaBalpha following
hypoxia/reoxygenation. J Biol Chem. 278:52598–52612. 2003.
View Article : Google Scholar : PubMed/NCBI
|
|
52
|
Rowshanravan B, Halliday N and Sansom DM:
CTLA-4: A moving target in immunotherapy. Blood. 131:58–67. 2018.
View Article : Google Scholar : PubMed/NCBI
|
|
53
|
Poprach A, Lakomý R and Büchler T:
Immunotherapy of Renal Cell Carcinoma. Klin Onkol. 30 (Suppl
3):55–61. 2017.(In Czech). View Article : Google Scholar : PubMed/NCBI
|
|
54
|
Geissler K, Fornara P, Lautenschläger C,
Holzhausen HJ, Seliger B and Riemann D: Immune signature of tumor
infiltrating immune cells in renal cancer. OncoImmunology.
4:e9850822015. View Article : Google Scholar : PubMed/NCBI
|
|
55
|
Tumeh PC, Harview CL, Yearley JH, Shintaku
IP, Taylor EJ, Robert L, Chmielowski B, Spasic M, Henry G, Ciobanu
V, et al: PD-1 blockade induces responses by inhibiting adaptive
immune resistance. Nature. 515:568–571. 2014. View Article : Google Scholar : PubMed/NCBI
|
|
56
|
Zhang Q, Bi J, Zheng X, Chen Y, Wang H, Wu
W, Wang Z, Wu Q, Peng H, Wei H, et al: Blockade of the checkpoint
receptor TIGIT prevents NK cell exhaustion and elicits potent
anti-tumor immunity. Nat Immunol. 19:723–732. 2018. View Article : Google Scholar : PubMed/NCBI
|