Introduction
Human plasma proteome analysis has the potential to
ease disease diagnosis and therapeutic monitoring (1,2).
Plasma protein biomarkers are useful for the diagnosis and
prognosis of numerous diseases, including diabetes. Inability to
utilize blood glucose is a hallmark of diabetes and leads to the
development of numerous complications, including neuropathy,
retinopathy, nephropathy and atherosclerosis (3). Development of these complications is
2.5 times higher in patients with long-term poorly controlled
glycaemic levels than controlled levels (4). Furthermore, on the basis of glycated
haemoglobin (HbA1c) levels diabetic subjects are categorized as
having controlled diabetes (CD) and poorly controlled diabetes
(PCD) with HbA1c levels ≤8% and >8%, respectively, of total
haemoglobin (5). To understand the
molecular mechanisms of pathophysiology of diabetic complications,
numerous studies have utilized proteomic approaches, which have
been reviewed in great detail (6).
Pathology of diabetic complications is associated with increased
generation of reactive oxygen species (ROS) resulting in oxidative,
glyco-oxidative and carbonyl stress (7). Following engagement with receptor for
AGE (RAGE), advanced glycation end-products (AGEs) induce the
generation of ROS and activation of the transcription factor NF-κB,
causing changes in gene expression (8). AGEs are also known to affect the
activity of several plasma proteins. For example, ~50% aspartate
aminotransferase enzyme activity is inactivated as a result of
glycation (9). Similarly, impaired
activity of glycated α-1-antitrypsin was observed in diabetes,
thereby leading to protease-antiprotease imbalance (10). Glycated transferrin demonstrated
the deterioration of antioxidant capacity in diabetic patients
(11). Additionally,
glyco-oxidative modification leads to protein aggregation resulting
in protein instability. To prevent serious metabolic disturbances
caused by the accumulation of glyco-oxidatively modified proteins,
these proteins are further degraded by the proteasomal system
(12). Glyco-oxidative
modification of protein results in the elicitation of
autoantibodies against several diabetic plasma proteins. These
proteins include albumin, insulin, carbonic anhydrase and heat
shock proteins, thereby resulting in their decreased levels in
diabetic plasma (13). However,
any variation in insulin levels affects the insulin-regulated
protein synthesis of several proteins. For example, decreased
insulin synthesis and resistance in diabetes affects the gene
expression of albumin and fibrinogen (14,15).
These factors contribute to differential protein expression. To
compensate for the altered protein function and loss, enhanced or
altered gene expression may occur, resulting in varying levels of
proteins in diabetes.
Previous studies have reported differential
expression of various proteins in diabetes, including
α-1-antitrypsin, fibrinogen, vitamin D binding protein, complement
C3 and apolipoprotein A1 (Apo A1) (16–19).
However, it is important to study differential protein expression
in PCD to understand the pathophysiology associated with the
development of diabetic complications. In the present study, we
analyzed differential protein expression in the plasma of CD and
PCD subjects using proteomic methods and validating the results by
western and dot blot analysis. Analysis of PCD subjects has not
previously been performed.
Materials and methods
Chemicals
Chemicals were obtained from Sigma-Aldrich (St.
Louis, MO, USA) unless otherwise stated. Antibody against Apo A1
was purchased from Abcam, Cambridge, UK.
Clinical plasma sample collection
Blood samples were collected from diabetic patients
at the Maharashtra Medical Research Society. Informed consent was
obtained from all patients and the study was approved by the Joshi
Hospital Ethics Committee. Fasting blood glucose and HbA1c levels
were determined by using a glucometer (Bayer AG, Leverkusen,
Germany) and in2it analyzer (Bio-Rad, Hercules, CA, USA),
respectively. Plasma was obtained by EDTA treatment, followed by
centrifugation at 1500 × g for 15 min. The supernatant was stored
at −80°C until further use.
Plasma sample preparation
Based on HbA1c levels, plasma samples were grouped
into ND (<6.4%), CD (7–8%) and PCD (8.8–12.3%). Ten
representative samples from each group were pooled and were used
for proteomic analysis. Albumin and IgGs were depleted by using a
PROTBA kit (Sigma-Aldrich) according to the manufacturer’s
instructions. Protein concentration was determined by using a Quick
Start Bradford protein assay kit (Bio-Rad).
Two dimensional gel electrophoresis
(2DE), image and western blot analysis
A depleted plasma protein sample (100 μg) was
solubilized in 125 μl rehydration buffer containing 8 M urea, 2 M
thiourea, 4% CHAPS, 70 mM DTT, 0.1% C7BzO and 1 μl ampholytes (pH
3–10). The solubilized sample was loaded onto 7-cm non-linear IPG
strips (pH 4–7) and rehydrated overnight. Isoelectric focusing was
performed by using the Protean IEF Cell (Bio-Rad) followed by
SDS-PAGE separation. Resolved proteins on 12.5% gel were visualized
by CBB-R250 staining or by western blot analysis (using anti-Apo A1
polyclonal antibody). Stained gel images were captured using the GS
800 calibrated densitometer (Bio-Rad). Image analysis was performed
using PDQUEST advanced software (Bio-Rad).
Trypsin digestion
CBB-stained protein spots were excised and destained
by washing with 50% acetonitrile (ACN)/50 mM ammonium bicarbonate.
Proteins were reduced and alkylated by 10 mM DTT and 55 mM
iodoacetamide, respectively, followed by overnight digestion with
trypsin at 37°C. Digested peptides were extracted with 5% formic
acid in 50% ACN and were reconstituted in 5 μl 0.1% formic acid in
3% ACN.
Liquid chromatography-mass spectrometry
(LC-MSE) analysis and protein identification
LC-MSE analysis was performed with 2 μl
peptide digest (100 ng/μl concentration) by using nanoACQUITY UPLC
online coupled to SYNAPT HDMS system (Waters Corp., Milford, PA,
USA) equipped with a nanolockspray ion source with a flow rate of
300 nl/min (external lockmass standard: Glu-fibrinopeptide) as
described by Cheng et al(20). Following MSE analysis,
data were analyzed with Protein Lynx Global Server software (PLGS,
version 2.4, Waters Corp.). Protein identification of processed
samples was performed by database search against a human subset of
UniProt containing 44,987 protein entries.
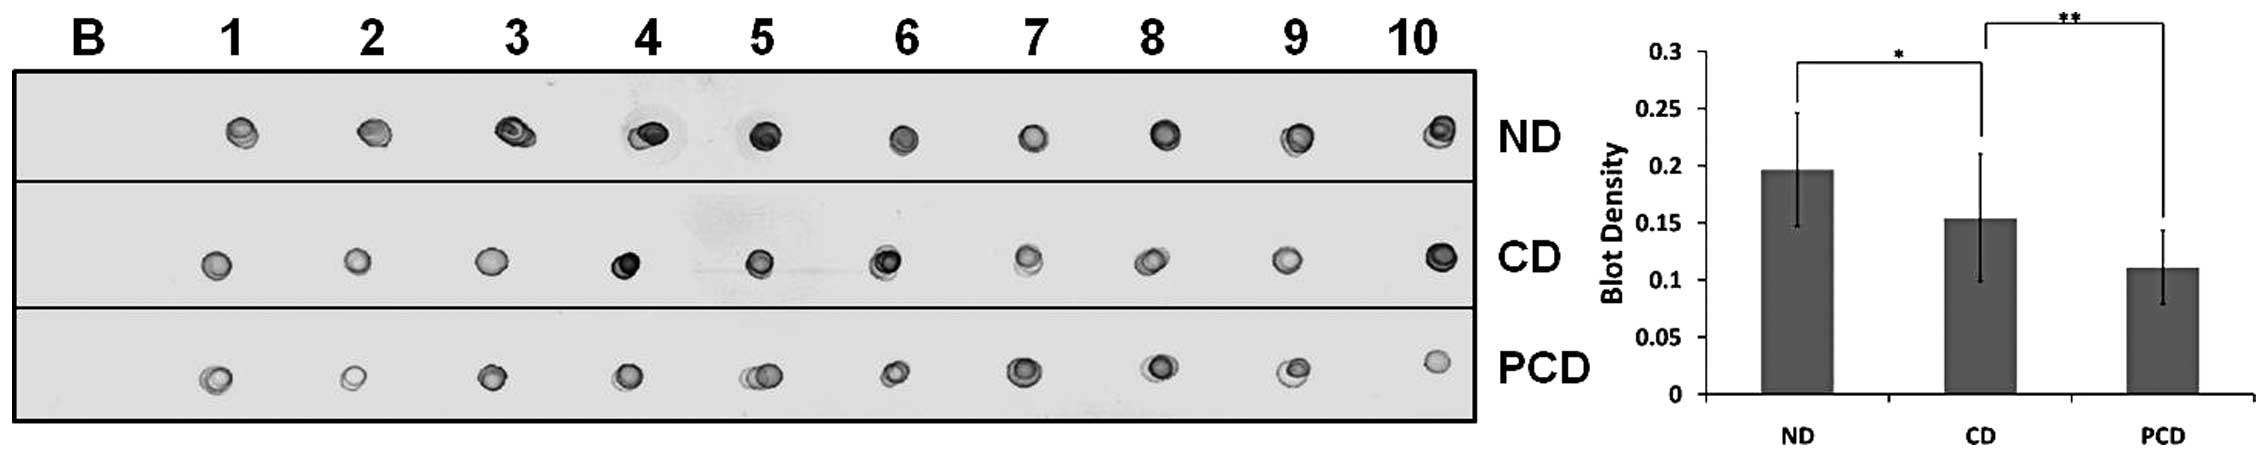
Dot blot analysis
Ten plasma samples from each ND, CD and PCD patient
were diluted with PBS in 1:1,000 dilutions. The diluted sample (2
μl) was spotted onto nitrocellulose membranes. The membrane was air
dried and blocked for 2 h with 5% skimmed milk in TBS at 37°C. The
membrane was then incubated with anti-Apo A1 antibody (1:7,000) for
1 h, washed twice with TBS-T (0.05% Tween-20) and then incubated
with biotinylated secondary antibody for 30 min. Immunodetection
was performed by incubating membranes with streptavidin-conjugated
horseradish peroxidase and Sigmafast DAB substrate.
Statistical analysis
Experiments were performed in triplicate.
Statistical analysis was performed by the Student’s t-test. Data
were expressed as the mean ± SD. P<0.05 was considered to
indicate a statistically significant difference.
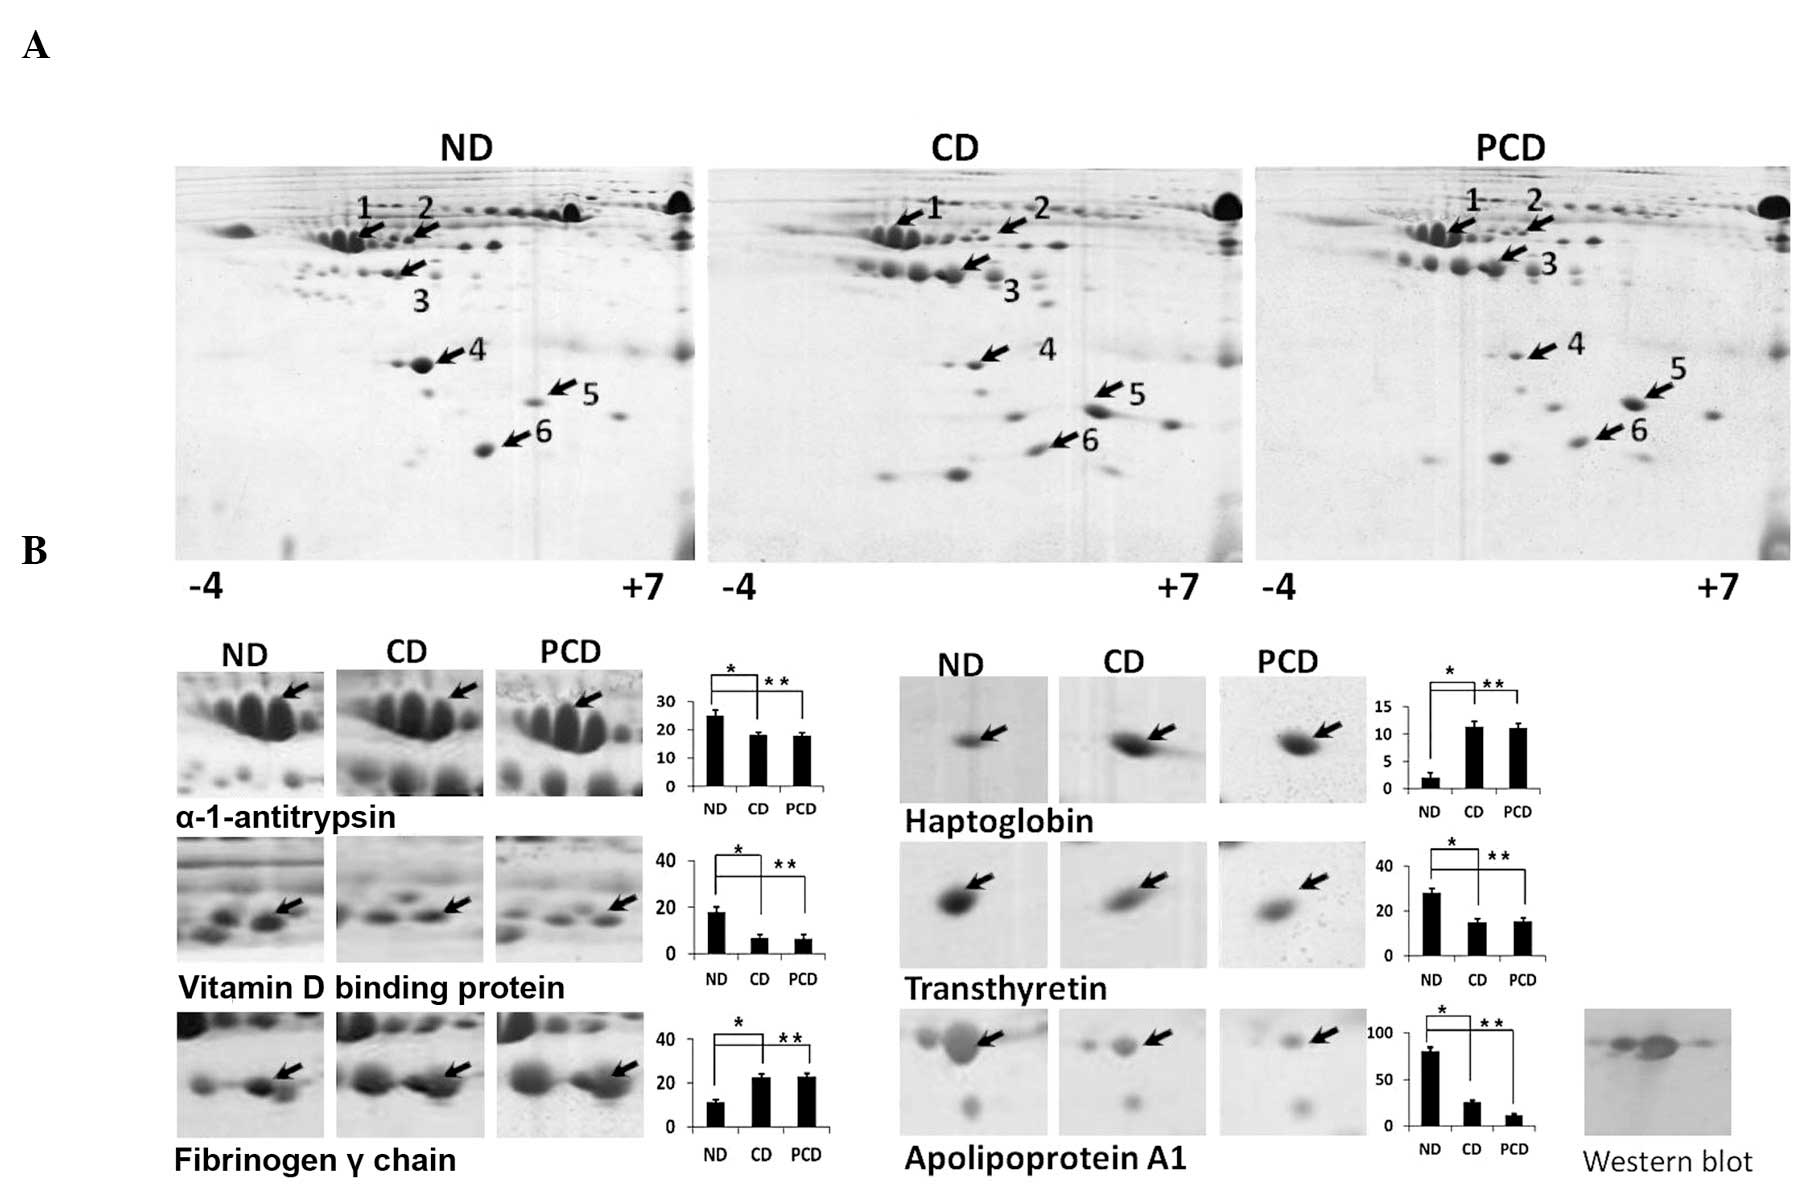
Results
Differential plasma protein expression was studied
in CD and PCD clinical plasma samples following analysis of fasting
plasma glucose, HbA1c levels, serum creatinine, high density
lipoproteins (HDL), triglycerides and cholesterol levels (Table I). Differentially expressed
proteins were identified by 2DE and LC-MSE and are
listed in Table II. Densitometric
analysis of 2DE gels revealed upregulation of fibrinogen and
haptoglobin and downregulation of vitamin D binding protein,
α-1-antitrypsin, transthyretin and Apo A1 in CD and PCD compared
with ND samples (Fig. 1). However,
no significant difference in differentially expressed proteins was
detected between CD and PCD plasma with the exception of Apo A1,
whose downregulation was more prominent in PCD. The observed
downregulation of Apo A1 was validated by western blot analysis
(Fig. 1) and dot-blot analysis of
each clinical plasma sample from ND, CD and PCD (Fig. 2). Apo A1 downregulation in PCD was
considered statistically significant (P<0.05).
 | Table IParameters evaluated in CD, ND and PCD
for 2DE, western blot and LC-MSE analysis. |
Table I
Parameters evaluated in CD, ND and PCD
for 2DE, western blot and LC-MSE analysis.
| Subjects | Fasting plasma
glucose (mg/dl) | HbA1c (%) | Serum creatinine
(mg/dl) | HDL (mg/dl) | Triglycerides
(mg/dl) | Cholesterol
(mg/dl) |
|---|
| ND | 87.9±11.7 | 5.5±0.3 | 0.7± 0.05 | 50.6±5.6 | 91.0±22.6 | 145.1±15.4 |
| CD | 92.8±11.55a | 7.2±0.6a | 0.8±0.02a | 42.7±6.2a | 116.3±19.2a | 146.0±14.0 |
| PCD | 187.3±23.7b | 9.9±1.0b | 1.1±0.17b | 33.0±2.1b | 219.3±16.8b | 200.0±30.3 |
| Table IIProtein identification and fold
expression in CD, ND and PCD using 2DE followed by
LC-MSE analysis. |
Table II
Protein identification and fold
expression in CD, ND and PCD using 2DE followed by
LC-MSE analysis.
| Spot no. | Protein name | Accession number | MW (Da) | pI (pH) | PLGS Score | Coverage (%) | Fold change
(CD/ND) | Fold change
(PCD/CD) |
|---|
| 1 | α1 antitrypsin | P01009 | 46707 | 5.24 | 1130.88 | 34.92 | 0.78 | 1.05 |
| 2 | Vitamin D binding
protein | P02774 | 52929 | 5.23 | 7865.01 | 51.05 | 0.77 | 1.04 |
| 3 | Fibrinogen γ
chain | P02679 | 51478 | 5.23 | 3187.94 | 31.78 | 1.87 | 1.08 |
| 4 | Apolipoprotein
A1 | P02647 | 30758 | 5.43 | 1290.93 | 32.20 | 0.5 | 0.6 |
| 5 | Haptoglobin | P00738 | 25176 | 6.11 | 3442.24 | 48.52 | 1.64 | 1.03 |
| 6 | Transthyretin | P02766 | 15877 | 5.39 | 9106.519 | 45.83 | 0.68 | 1.02 |
Discussion
Diabetic plasma proteomic studies are important for
understanding the molecular mechanisms which lead to complications.
Numerous studies have been performed comparing ND and CD plasma
samples (6). However, the
pathophysiology of diabetic complications is demonstrated more
clearly in PCD than CD. The present study was performed to identify
differentially expressed proteins in PCD. Although fibrinogen,
haptoglobin, VDBP, α-1-antitrypsin and transthyretin were found to
be differentially expressed in patients with diabetes, their levels
were not significantly different between CD and PCD. However,
significant downregulation of Apo A1 was detected in PCD.
Downregulation of Apo A1 is associated with the development of
diabetic vascular complications mediated by the reverse cholesterol
transport system (21). Decreased
levels of Apo A1 in PCD may be attributed to numerous reasons,
including autoantibodies against Apo A1 (22,23),
elevated levels of inflammatory molecules (24) and insulin resistance (25). The Apo B100/Apo A1 ratio predicts
cardiovascular risk more accurately than the lipids, lipoproteins
and lipid ratios (26) and the
ratio increases in PCD compared with CD plasma (27). Furthermore, a negative correlation
was observed between serum creatinine levels and Apo A1, which
supports the incidence of chronic kidney disease with lower plasma
HDL-cholesterol levels (28).
Therefore, lower levels of Apo A1 in PCD may be associated with
increased risk of cardiovascular and kidney disorders. Thus,
downregulation of Apo A1 may serve as an early predictive marker
for diabetic complications.
Acknowledgements
The authors thank Dr Vidya Gupta, Chair,
Biochemical, for assistance in establishing collaboration with
Joshi Hospital; Dr. A.M. Deshpande, Chairman of MMRS for his
support and the Lady Tata Memorial Trust for Senior Research
Fellowship. This study was carried out under CSIR network project
NWP0004.
References
|
1
|
Anderson NL and Anderson NG: The human
plasma proteome: history, character and diagnostic prospects. Mol
Cell Proteomics. 1:845–867. 2002. View Article : Google Scholar : PubMed/NCBI
|
|
2
|
Anderson NL: The clinical plasma proteome:
a survey of clinical assays for proteins in plasma and serum. Clin
Chem. 56:177–185. 2010. View Article : Google Scholar : PubMed/NCBI
|
|
3
|
Taylor R and Agius L: The biochemistry of
diabetes. Biochem J. 250:625–640. 1988.PubMed/NCBI
|
|
4
|
Chase HP, Jackson WE, Hoops SL, et al:
Glucose control and the renal and retinal complications of
insulin-dependent diabetes. JAMA. 261:1155–1160. 1989. View Article : Google Scholar : PubMed/NCBI
|
|
5
|
Takahashi S, Uchino H, Shimizu T, et al:
Comparison of glycated albumin (GA) and glycated hemoglobin (HbA1c)
in type 2 diabetic patients: usefulness of GA for evaluation of
short-term changes in glycemic control. Endocr J. 54:139–144. 2007.
View Article : Google Scholar : PubMed/NCBI
|
|
6
|
Sundsten T and Ortsater H: Proteomics in
diabetes research. Mol Cell Endocrinol. 297:93–103. 2009.
View Article : Google Scholar
|
|
7
|
Brownlee M: Biochemistry and molecular
cell biology of diabetic complications. Nature. 414:813–820. 2001.
View Article : Google Scholar : PubMed/NCBI
|
|
8
|
Giacco F and Brownlee M: Oxidative stress
and diabetic complications. Circ Res. 107:1058–1070. 2010.
View Article : Google Scholar : PubMed/NCBI
|
|
9
|
Bousova I, Bakala H, Chudacek R, et al:
Glycation-induced inactivation of aspartate aminotransferase,
effect of uric acid. Mol Cell Biochem. 278:85–92. 2005. View Article : Google Scholar : PubMed/NCBI
|
|
10
|
Hashemi M, Naderi M, Rashidi H, et al:
Impaired activity of serum alpha-1-antitrypsin in diabetes
mellitus. Diabetes Res Clin Pract. 75:246–248. 2007. View Article : Google Scholar : PubMed/NCBI
|
|
11
|
Mohammad TG, Mojtaba R and Mohsen R: Study
of nonenzymatic glycation of transferrin and its effect on
iron-binding antioxidant capacity. Iran J Basic Med Sci.
13:194–199. 2010.
|
|
12
|
Jung T and Grune T: The proteasome and its
role in the degradation of oxidized proteins. IUBMB Life.
11:743–752. 2008. View
Article : Google Scholar : PubMed/NCBI
|
|
13
|
Winter WE and Schatz DA: Autoimmune
markers in diabetes. Clin Chem. 57:168–175. 2011. View Article : Google Scholar : PubMed/NCBI
|
|
14
|
Tessari P, Kiwanuka E, Millioni R, et al:
Albumin and fibrinogen synthesis and insulin effect in type 2
diabetic patients with normoalbuminuria. Diabetes Care. 29:323–328.
2006. View Article : Google Scholar : PubMed/NCBI
|
|
15
|
Peavy DE, Taylor JM and Jefferson LS:
Correlation of albumin production rates and albumin mRNA levels in
livers of normal, diabetic and insulin-treated diabetic rats. Proc
Natl Acad Sci USA. 75:5879–5883. 1978. View Article : Google Scholar : PubMed/NCBI
|
|
16
|
Blanton D, Han Z, Bierschenk L, et al:
Reduced serum vitamin D-binding protein levels are associated with
type 1 diabetes. Diabetes. 60:2566–2570. 2011. View Article : Google Scholar : PubMed/NCBI
|
|
17
|
Ceriello A: Fibrinogen and diabetes
mellitus: is it time for intervention trials? Diabetologia.
40:731–734. 1997. View Article : Google Scholar : PubMed/NCBI
|
|
18
|
Engstrom G, Hedblad B, Eriksson KF, et al:
Complement C3 is a risk factor for the development of diabetes. A
population-based cohort study. Diabetes. 54:570–575. 2005.
View Article : Google Scholar : PubMed/NCBI
|
|
19
|
Lapolla A, Brioschi M, Banfi C, et al: On
the search for glycated lipoprotein ApoA-I in the plasma of
diabetic and nephropathic patients. J Mass Spectrom. 43:74–81.
2008. View
Article : Google Scholar : PubMed/NCBI
|
|
20
|
Cheng FY, Blackburn K, Lin YM, et al:
Absolute protein quantification by LC/MS(E) for global analysis of
salicylic acid-induced plant protein secretion responses. J
Proteome Res. 8:82–93. 2009. View Article : Google Scholar : PubMed/NCBI
|
|
21
|
Quintao EC, Medina WL and Passarelli M:
Reverse cholesterol transport in diabetes mellitus. Diabetes Metab
Res Rev. 16:237–250. 2000. View Article : Google Scholar : PubMed/NCBI
|
|
22
|
Vuilleumier N, Bas S, Pagano S, et al:
Anti-apolipoprotein A-1 IgG predicts major cardiovascular events in
patients with rheumatoid arthritis. Arthritis Rheum. 62:2640–2650.
2010. View Article : Google Scholar : PubMed/NCBI
|
|
23
|
Montecucco F, Vuilleumier N, Pagano S, et
al: Anti-Apolipoprotein A-1 auto-antibodies are active mediators of
atherosclerotic plaque vulnerability. Eur Heart J. 32:412–421.
2011. View Article : Google Scholar : PubMed/NCBI
|
|
24
|
Haas MJ, Horani M, Mreyoud A, et al:
Suppression of apolipoprotein AI gene expression in HepG2 cells by
TNF alpha and IL-1beta. Biochim Biophys Acta. 1623:120–128. 2003.
View Article : Google Scholar : PubMed/NCBI
|
|
25
|
Mooradian AD, Haas MJ and Wong NC:
Transcriptional control of apolipoprotein A-I gene expression in
diabetes. Diabetes. 53:513–520. 2004. View Article : Google Scholar : PubMed/NCBI
|
|
26
|
Mallick KA, Joshi MR and Bhat PG: A study
on Apo B100/Apo A-I ratio in uncontrolled type 2 diabetes mellitus.
Int J Appl Biol Pharm Technol. 2:379–384. 2011.
|
|
27
|
Wagner AM and Ordonez-Llanos J:
Apolipoproteins and prediction of fatal myocardial infarction.
Lancet. 359:1863–1864. 2002. View Article : Google Scholar : PubMed/NCBI
|
|
28
|
Zoppini G, Targher G, Chonchol M, et al:
Higher HDL cholesterol levels are associated with a lower incidence
of chronic kidney disease in patients with type 2 diabetes. Nutr
Metab Cardiovasc Dis. 19:580–586. 2009. View Article : Google Scholar : PubMed/NCBI
|